
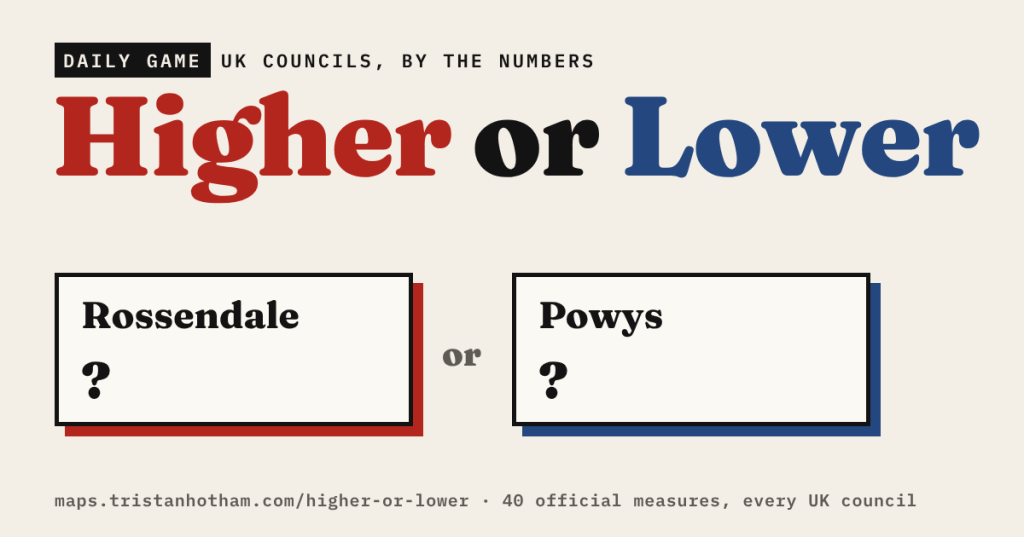
Two places, one number: which is higher? I’ve made a daily game out of 66 measures for every council in the UK, from pay and house prices to sunshine, the Leave vote, sheep farms and Druids. Ten new pairs every day, and an endless mode that gets harder as you go.
Most of the maps on this blog answer one question in depth. This is the opposite: hundreds of small questions, one at a time. Is pay higher in Wigan or Oxford? Does Bristol get more rain than Newcastle-under-Lyme? Which has more pubs per person, Westminster or the Derbyshire Dales? Most people have a hunch. The fun is finding out how often the hunch is right.
How it works
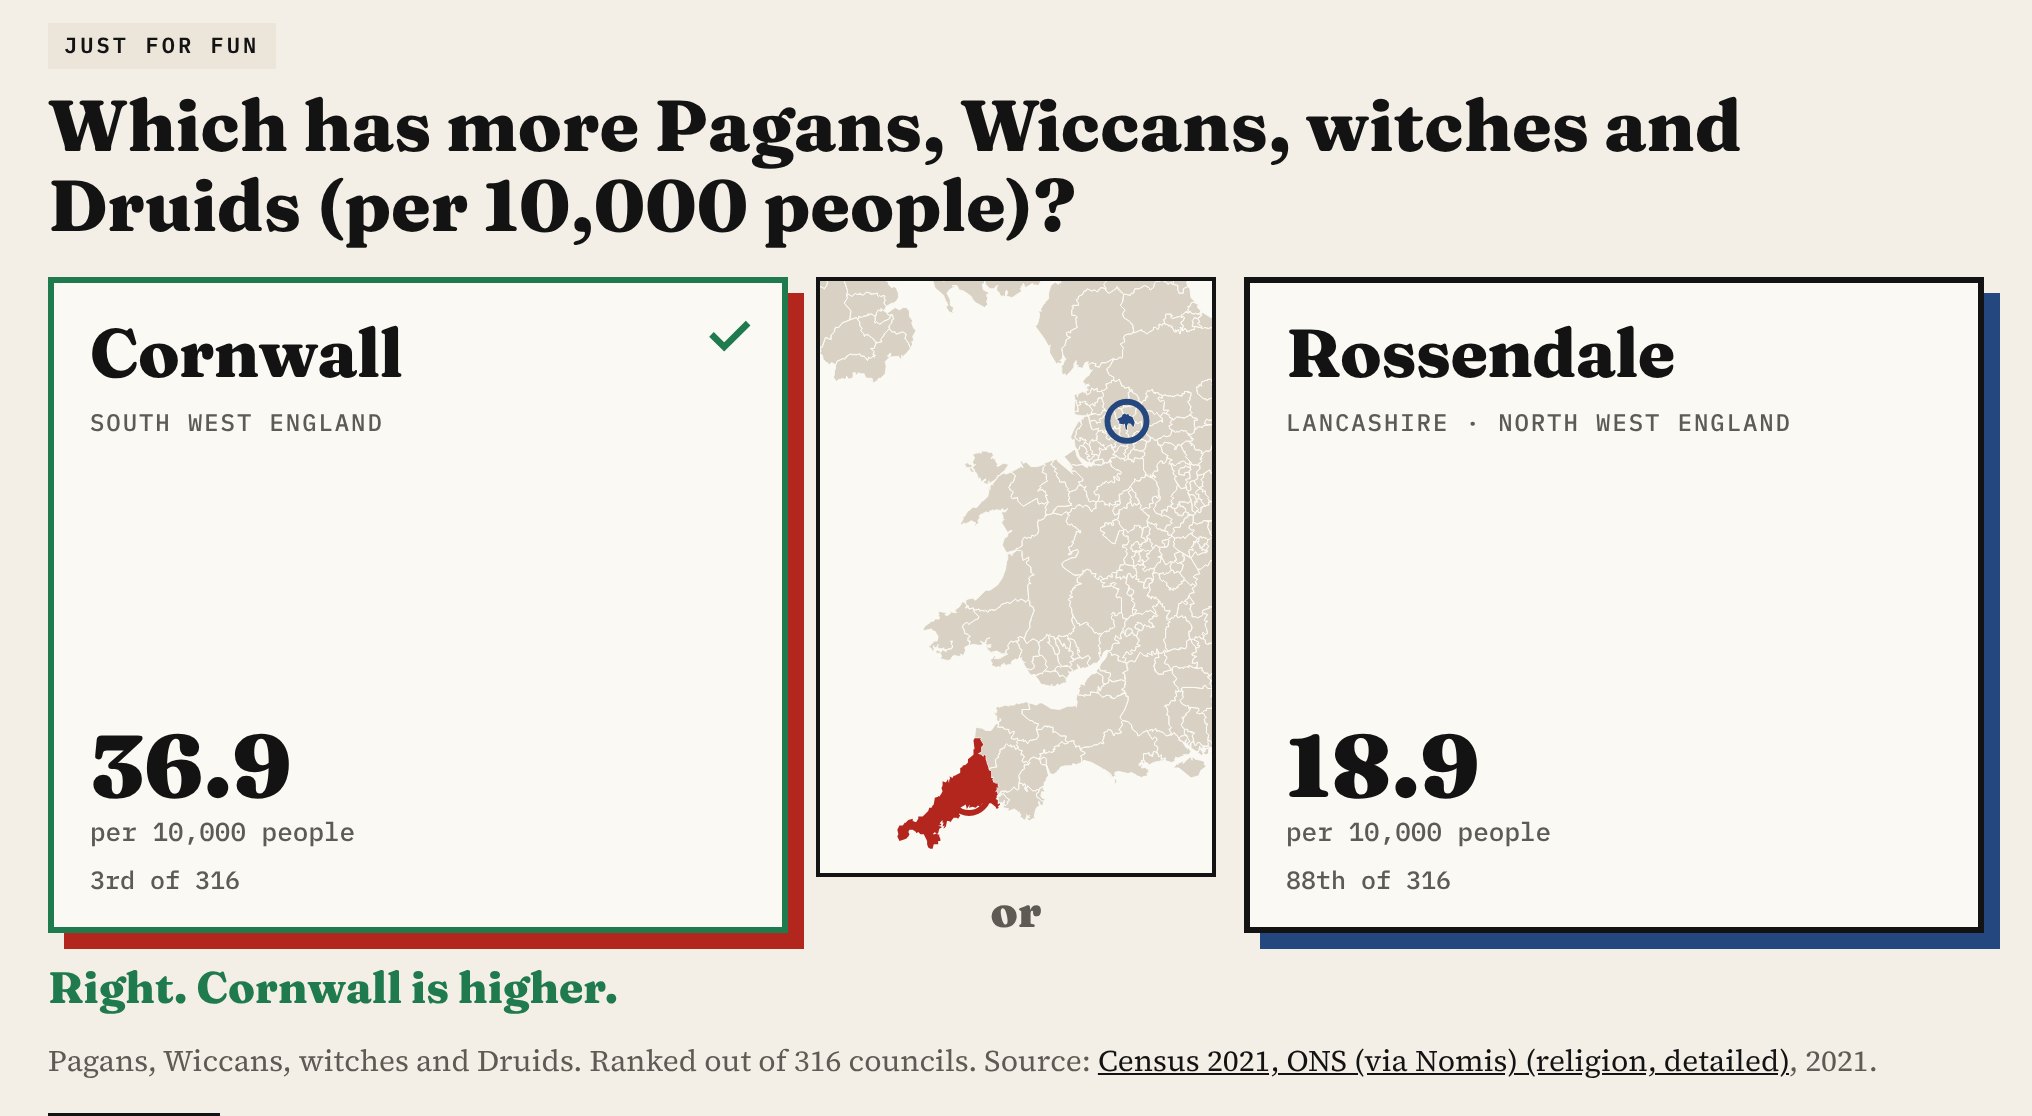
You see two councils and a question. Tap the one you think is higher, and both numbers count up with each council’s rank and the source. A small map zooms to the two places, and each council carries its county and region, because not everyone knows where Castle Point or Hyndburn are.
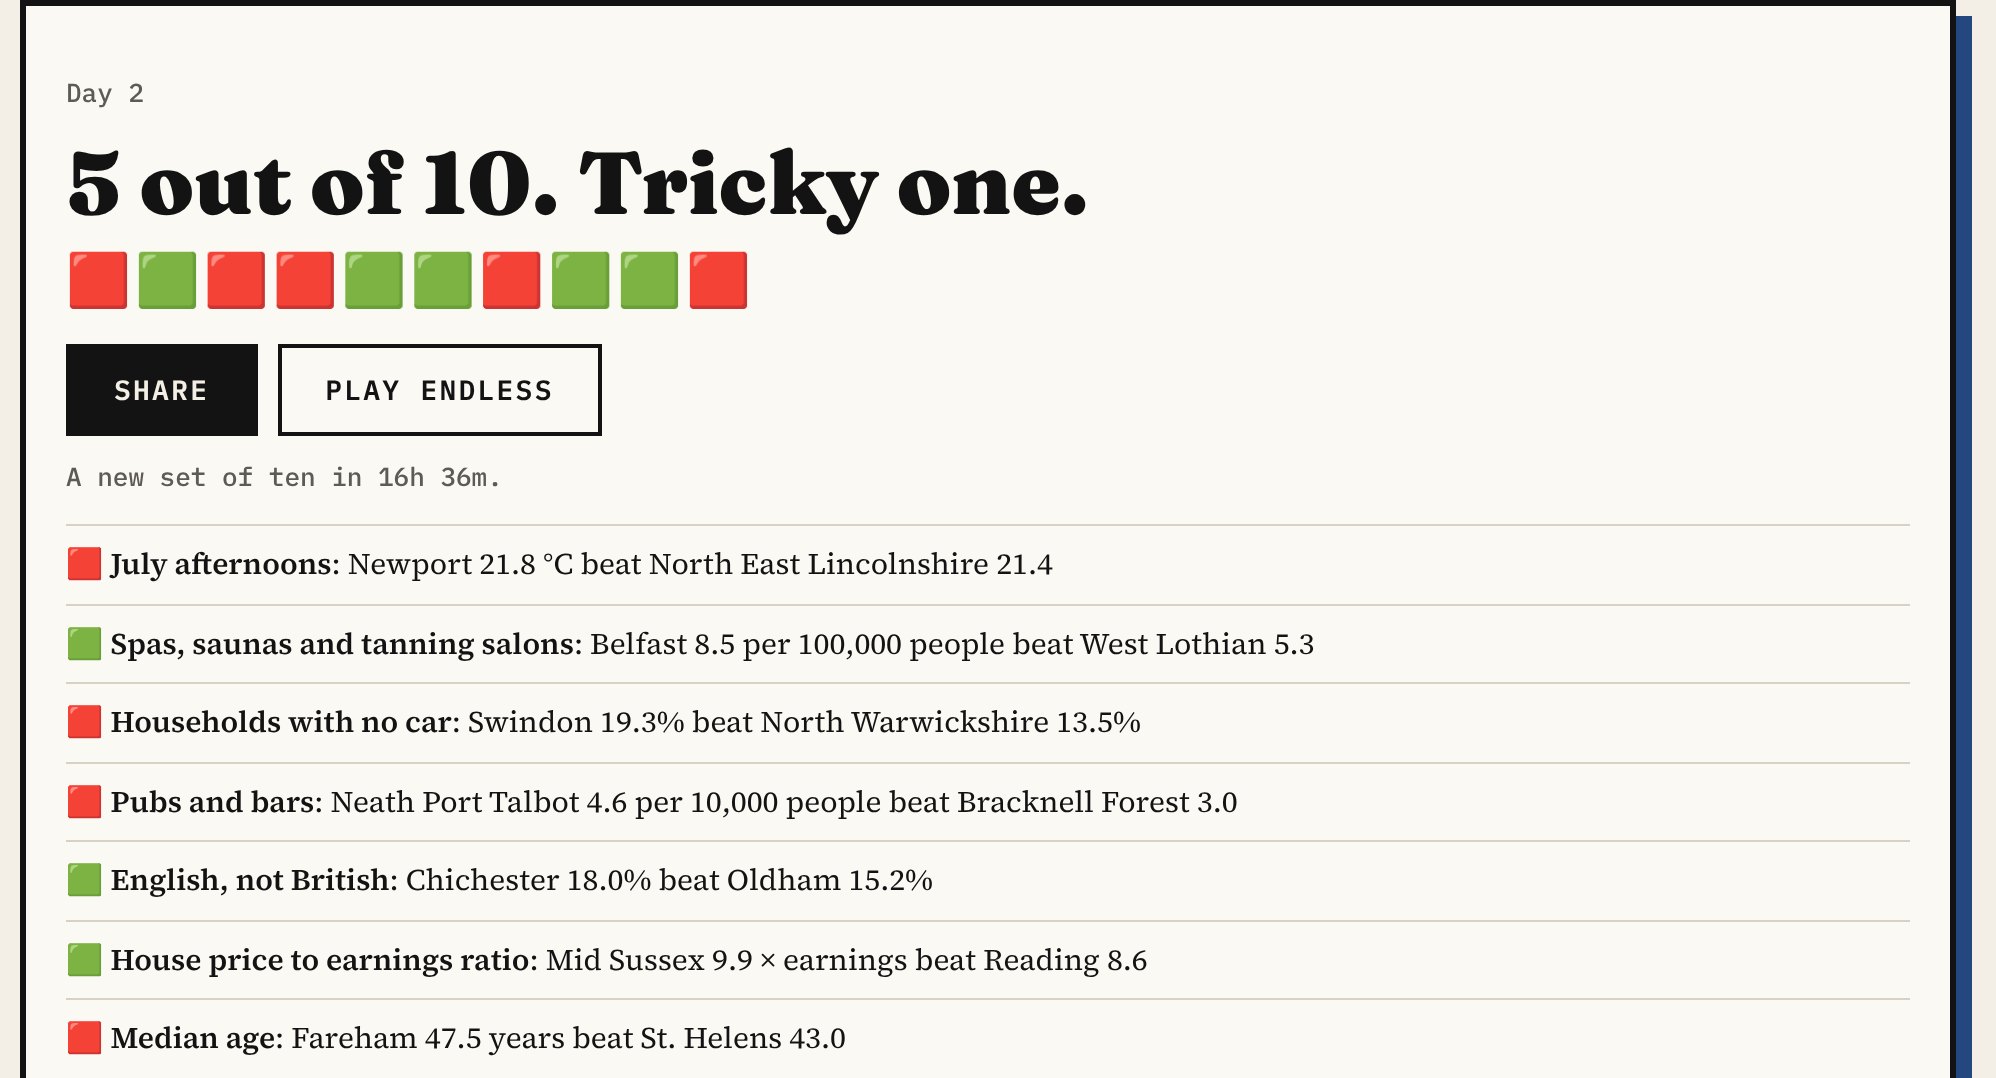
Today’s 10 is the same ten pairs for everyone each day, so you can compare scores. At least three of the ten are Just for fun. At the end you get a row of green and red squares to share. Endless keeps going until you get one wrong, and the pairs get closer the longer your streak runs. You can stick to one topic there, such as Money, Weather or Just for fun.
Where the numbers come from
Every figure is the latest official one I could find for each council, taken straight from the source:
- Money: median full-time pay, disposable household income per person, median house prices and how many years of pay a house costs (ONS).
- People and homes: population, density, median age, life expectancy, and Census 2021 measures from degrees and veterans to households with no car (ONS, via Nomis).
- High street: pubs, takeaways, hairdressers and hotels per person (UK Business Counts).
- Politics: the Leave vote and turnout in the 2016 EU referendum (Electoral Commission).
- Weather and land: sunshine, rainfall, July and January temperatures (Met Office averages for 1991 to 2020), plus area and footpaths per square mile.
- Just for fun: Druids and witches, people without a passport, caravan homes, breweries, distilleries, sheep farms, funeral directors, and counts from my own studies: Queen Victoria’s post boxes, church bells, earthquakes, haunted places and old trees.
Some numbers that might catch you out
- Median full-time pay runs from £57,396 a year in St Albans to £29,805 in Boston.
- The median house in Kensington and Chelsea costs £1,150,000. In Burnley it is £130,000.
- Hastings is the sunniest council, with 1,895 hours a year. Highland gets 1,077. Argyll and Bute is the wettest, with 2,269 mm of rain a year; Southend-on-Sea gets 543 mm.
- Boston also had the highest Leave vote in 2016, 75.6%. Lambeth had the lowest, 21.4%.
- The median person in North Norfolk is 54.8 years old. In Tower Hamlets they are 30.7.
- One in four people in East Lindsey (25.8%) has no passport. In Kensington and Chelsea it is 2.7%, and 57 in every 1,000 residents there have a holiday home.
- Castle Point, on the Essex coast, has the most people who say they are English only, not British (27.3%), and the most homes that are caravans or mobile homes (3.2%).
Just for fun
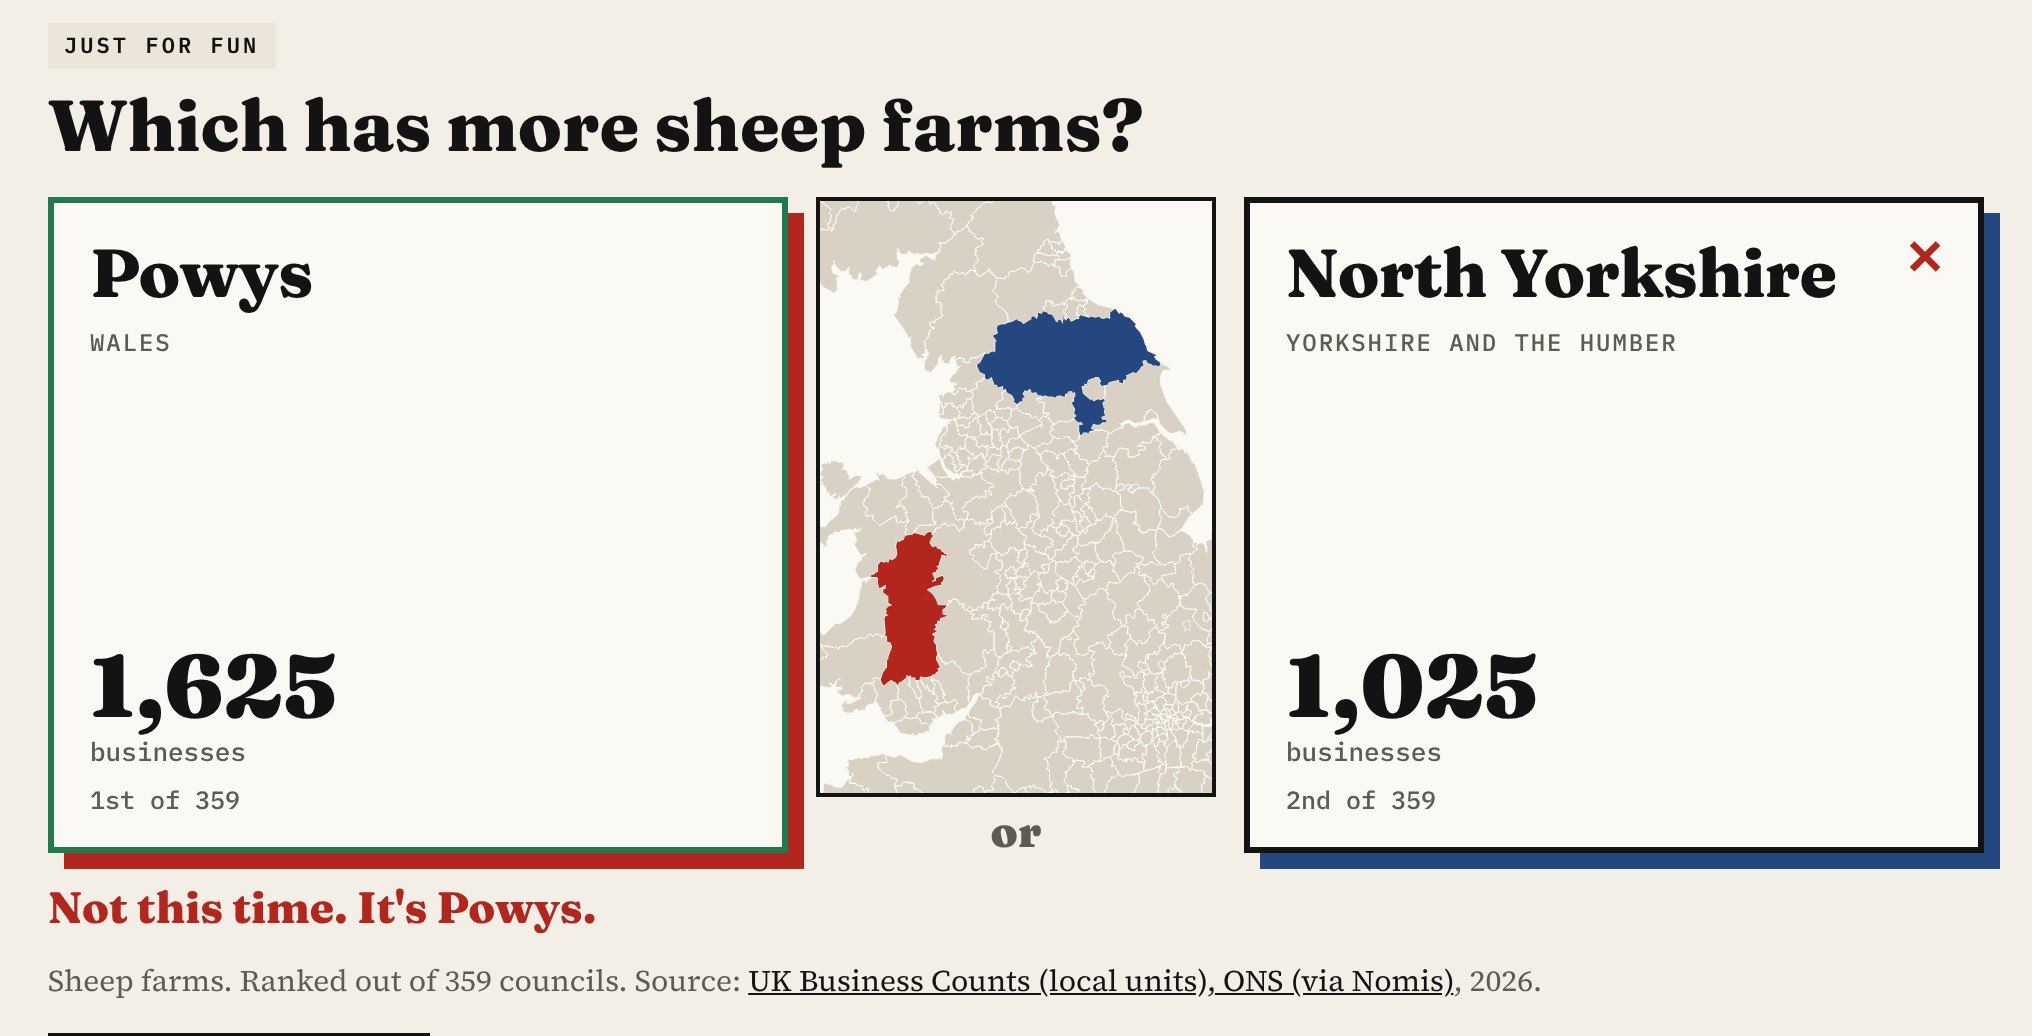
The odder questions are my favourites. Ceredigion has the most Pagans, Wiccans, witches and Druids, 44.5 for every 10,000 people. Moray has 58 distilleries for every 100,000 people, and Orkney the most breweries per person. Powys has 1,625 sheep farms. Cornwall still has 129 post boxes from Queen Victoria’s reign, Somerset has 302 rings of church bells, and the British Geological Survey has recorded 616 earthquakes in Highland since 1382.
How I built it
The places are the 359 councils of the UK as they stood in April 2023. Where councils have merged since a figure was published, I added the old ones together: Census 2021 counts for Cumbria, North Yorkshire and Somerset, and EU referendum votes for every council merged since 2016. I left out the City of London and the Isles of Scilly because they are so small. The census measures cover England and Wales only, so Scottish and Northern Irish councils only appear in the questions that cover them. Pairs too close to call are never asked.
Some numbers need a pinch of salt. Business counts are registered sites, so a few central London boroughs look busy because firms are based there. The counts from my own studies measure what has been recorded, so they also reflect how keen the local mappers are. And a council average hides a lot: Highland’s sunshine figure covers both Skye and the Moray Firth.
Notes and sources
- Office for National Statistics, via Nomis where noted: Census 2021, mid-year population estimates, Annual Survey of Hours and Earnings, regional gross disposable household income, house price statistics for small areas and affordability ratios, life expectancy for local areas, annual personal well-being estimates and UK Business Counts. Open Government Licence v3.
- Electoral Commission, EU referendum results. Met Office HadUK-Grid climate averages, 1991 to 2020. Open Government Licence v3.
- Council boundaries: ONS (Open Government Licence v3). Rights of way: council open data via rowmaps.com, as in The Footpath Capital.
- Just for fun counts from my earlier studies: post boxes (OpenStreetMap contributors, ODbL), church bells (Dove’s Guide), earthquakes (British Geological Survey), haunted places (Wikipedia) and old trees (OpenStreetMap).
- The game, the full table of 66 measures for every council and the code are on GitHub. Code MIT; derived data CC BY 4.0.
- I made this with coding and drafting help from Claude (Anthropic). I reviewed and checked the data and text.

