
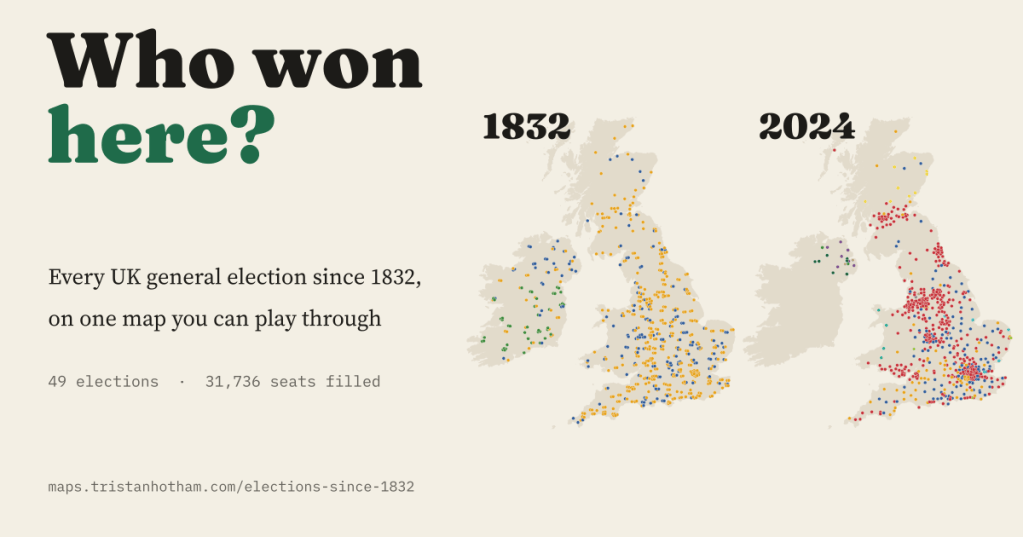
Every UK general election since 1832 on one map: 31,736 seats filled, from the first reformed Parliament to July 2024. Pick a town and see who it has sent to Westminster.
I research elections and campaigns, and one thing has always bothered me about British electoral history: it lives in tables. The great reference books list every result, but you cannot see the country change. So I built the map I wanted. It covers all 49 general elections from December 1832 to July 2024: 28,346 constituency contests and 89,545 candidacies. Each dot is a seat, coloured by the party family that won it, and a slider plays you through two centuries.
Tap any dot and you get the result, and a strip of colour showing who has won nearest that spot at every election since 1832. Search for your town and it does the same for you.
Two centuries in four maps
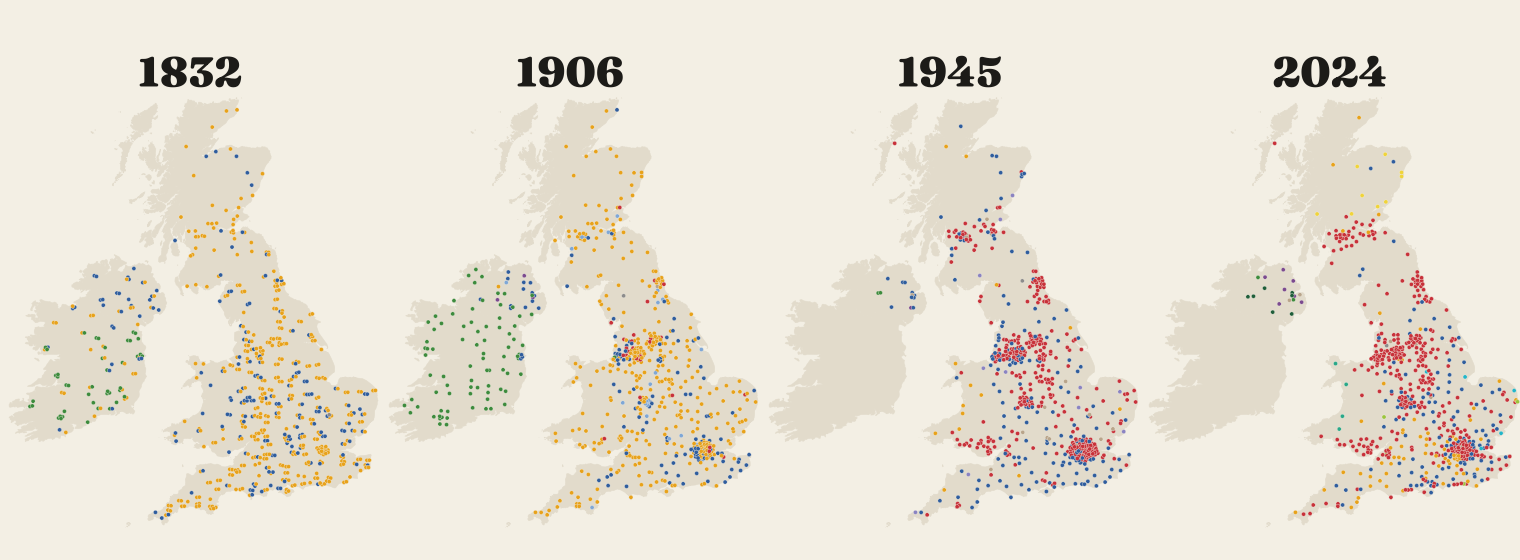
In 1832 the Whigs and their allies won 436 of 658 seats. In 1906 the Liberals won 397, while Ireland was almost solid for Home Rule. By 1945 Labour had 394 seats, its first majority, and the Liberals 14. In 2024 Labour won 411 of 650.
The election that was not
The first surprise is how often there was no vote at all. If nobody stood against the sitting members, they were simply returned. From 1832 to 1880, 40.1% of all seats were filled that way. In 1859 it was 380 seats, 58.1% of the House. Unopposed returns faded after 1918, and the last ones at a general election came in 1951, when 4 members were returned without a vote.
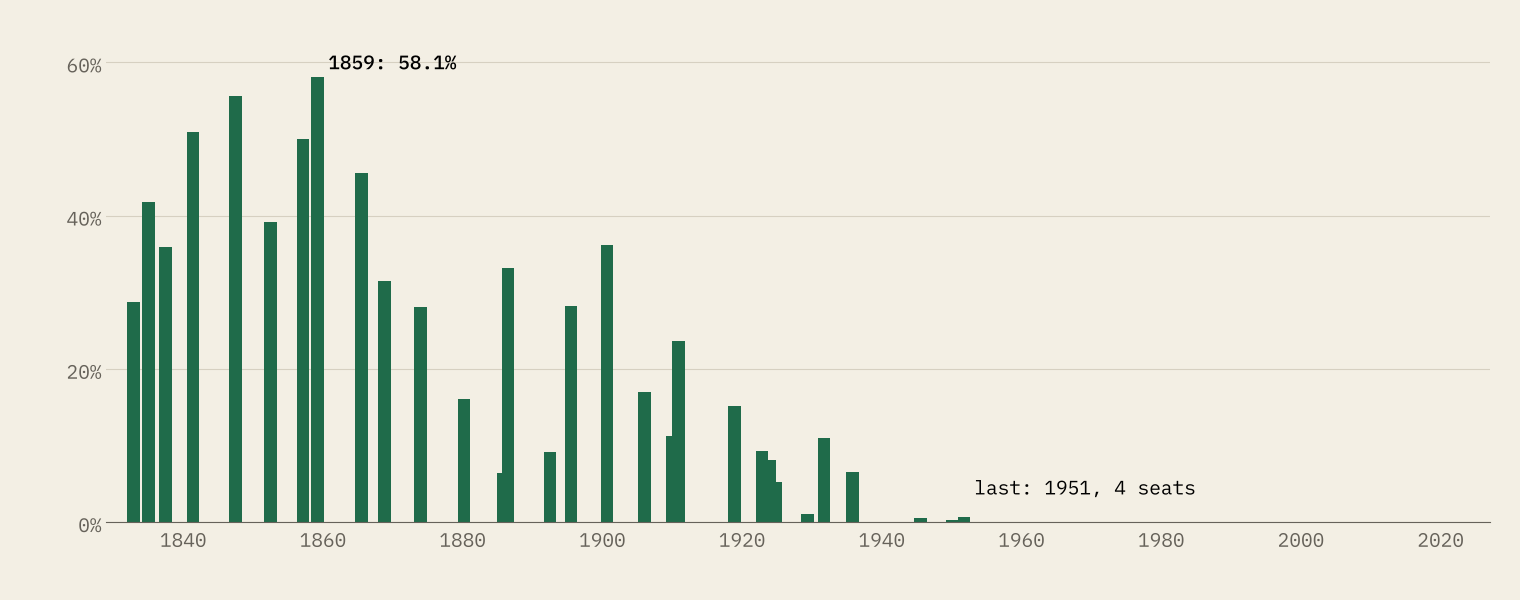
In 1859, most seats in the Commons were filled without a single vote being cast.
Many seats also had two members. In 1832, 505 of the 658 seats were in constituencies electing two or more, and between 1832 and 1880, 33.9% of two-member seats sent one member from each side. On the map these are pairs of dots. The boroughs that lost their members in 1832 have their own story in my Rotten Boroughs study.
The Liberal fall and Labour rise
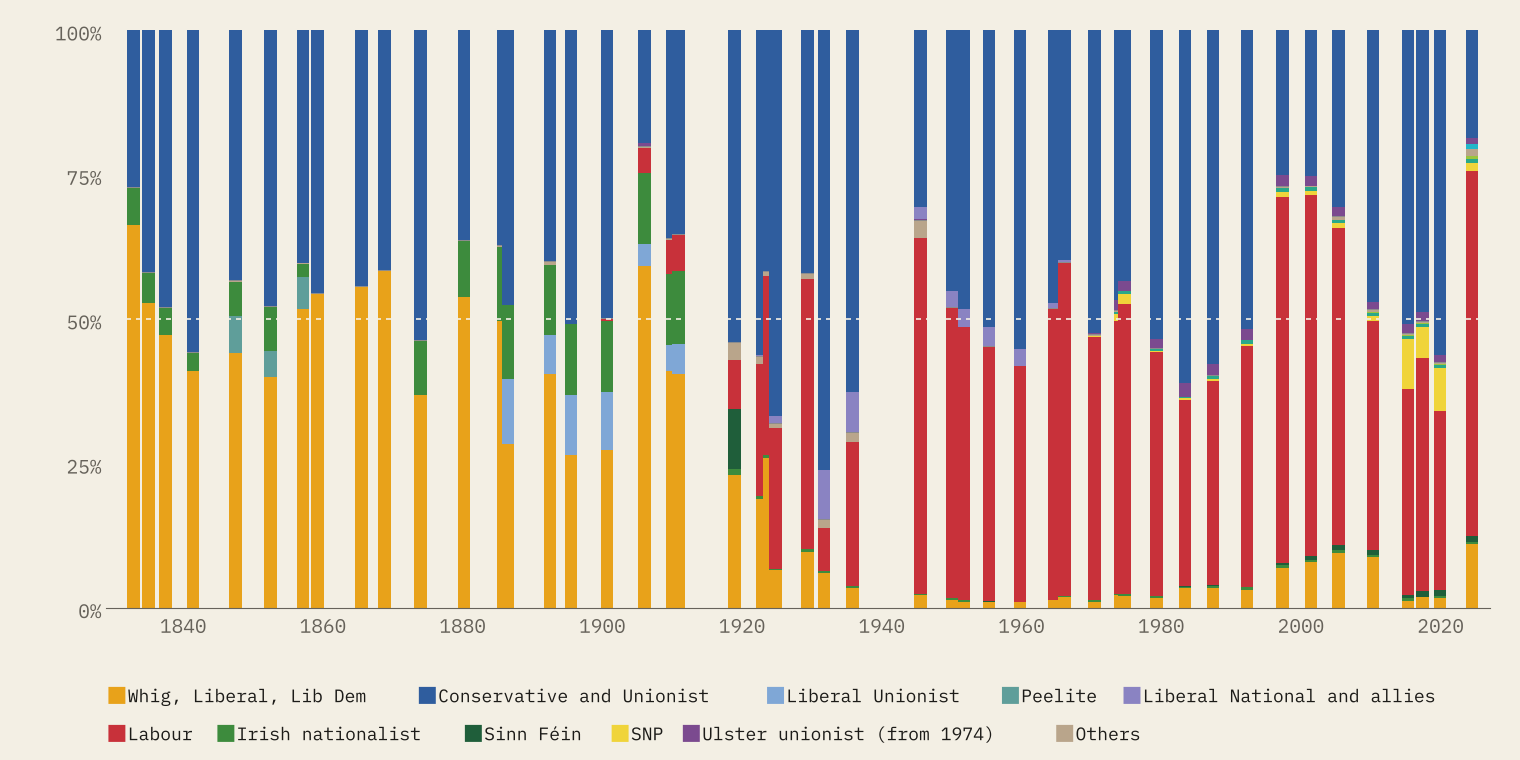
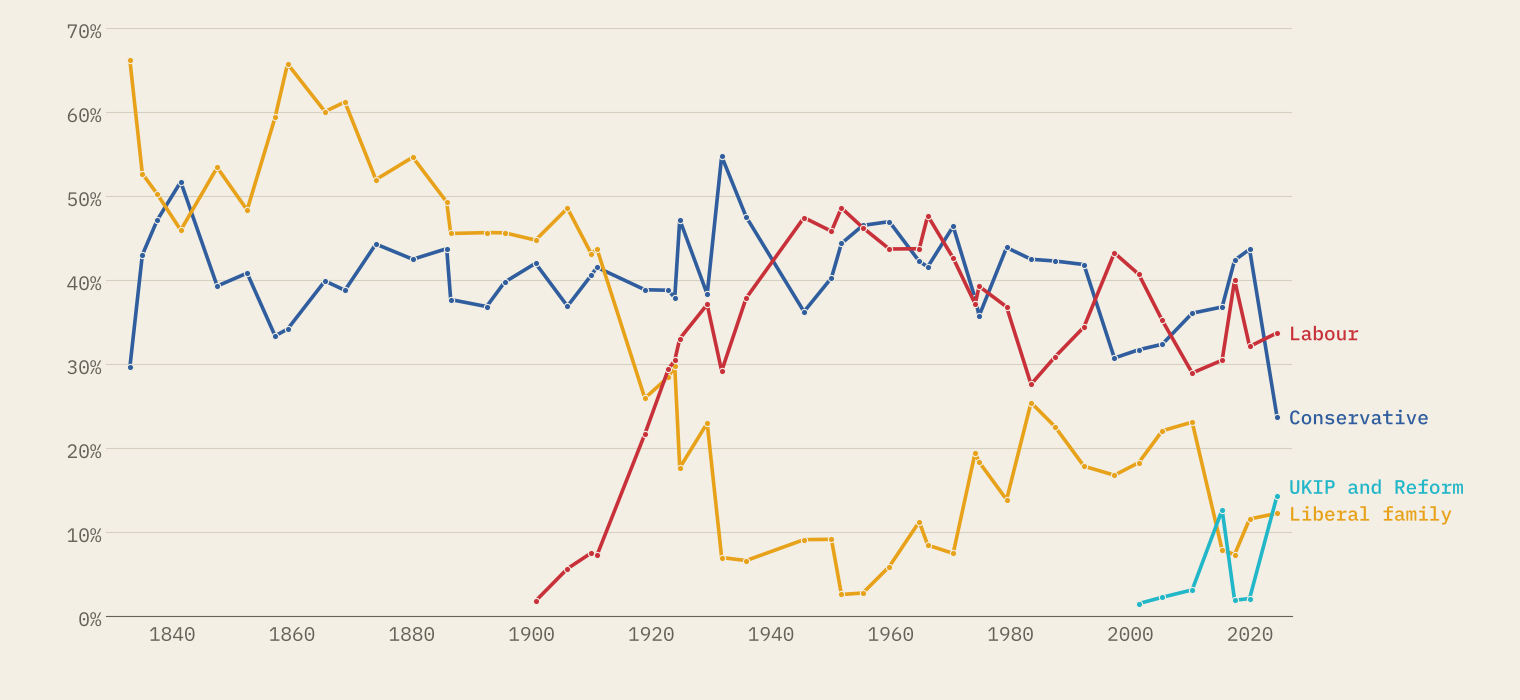
The Liberal family won 397 seats in 1906, 271 in December 1910, 40 in 1924 and just 6 in 1951. Labour won its first seats in 1900, passed the Liberals in 1922, and has alternated with the Conservatives ever since. The vote chart shows how unfair first past the post can look: in 1983 the Liberal and SDP Alliance won 25.4% of the votes and 23 seats, and in 2024 Reform UK won 14.3% and 5 seats, while Labour took 63.2% of the seats on 33.7% of the votes.
Scotland, Wales and Ireland
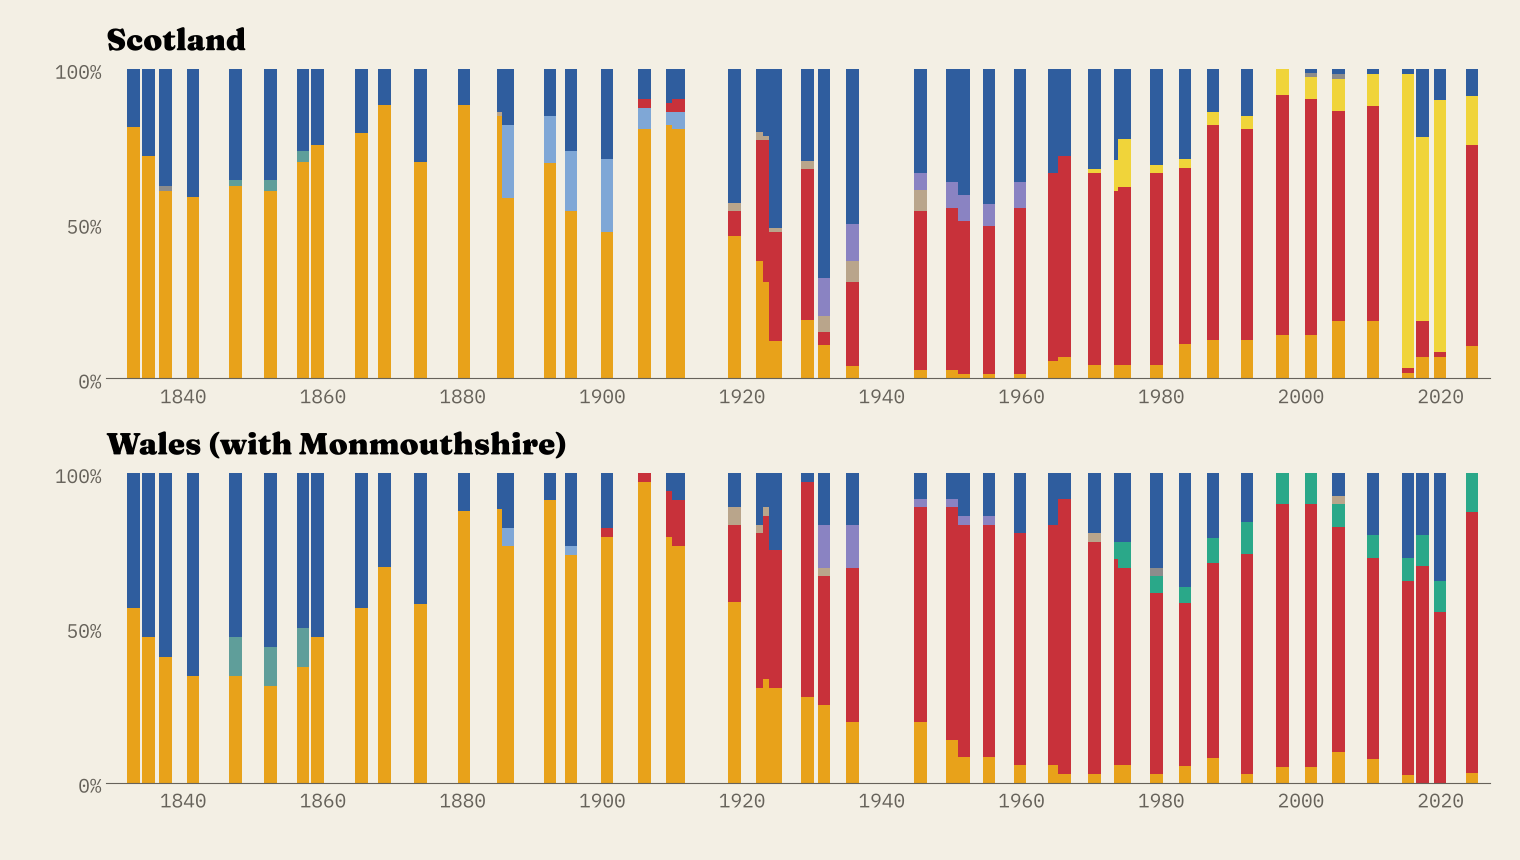
The nations tell their own stories. Wales was almost wholly Liberal before 1914: 33 of 34 seats in 1906 (counting Monmouthshire). Then it turned Labour, and the Conservatives won no Welsh seat at all in 1906, 1997, 2001 and 2024. Scotland went from Liberal to a long Labour lead, with a Unionist peak in 1955 (31 seats on 41.6% of the vote), before the SNP took 56 of 59 seats in 2015. In 2024 Labour won 37 Scottish seats and the SNP 9.
Ireland is the most dramatic of all. In December 1910 the nationalist parties held 84 of its 103 seats; in 1918 Sinn Féin won 73 of 105, and from 1922 only Northern Ireland sent members to Westminster.
The Red Wall, and after
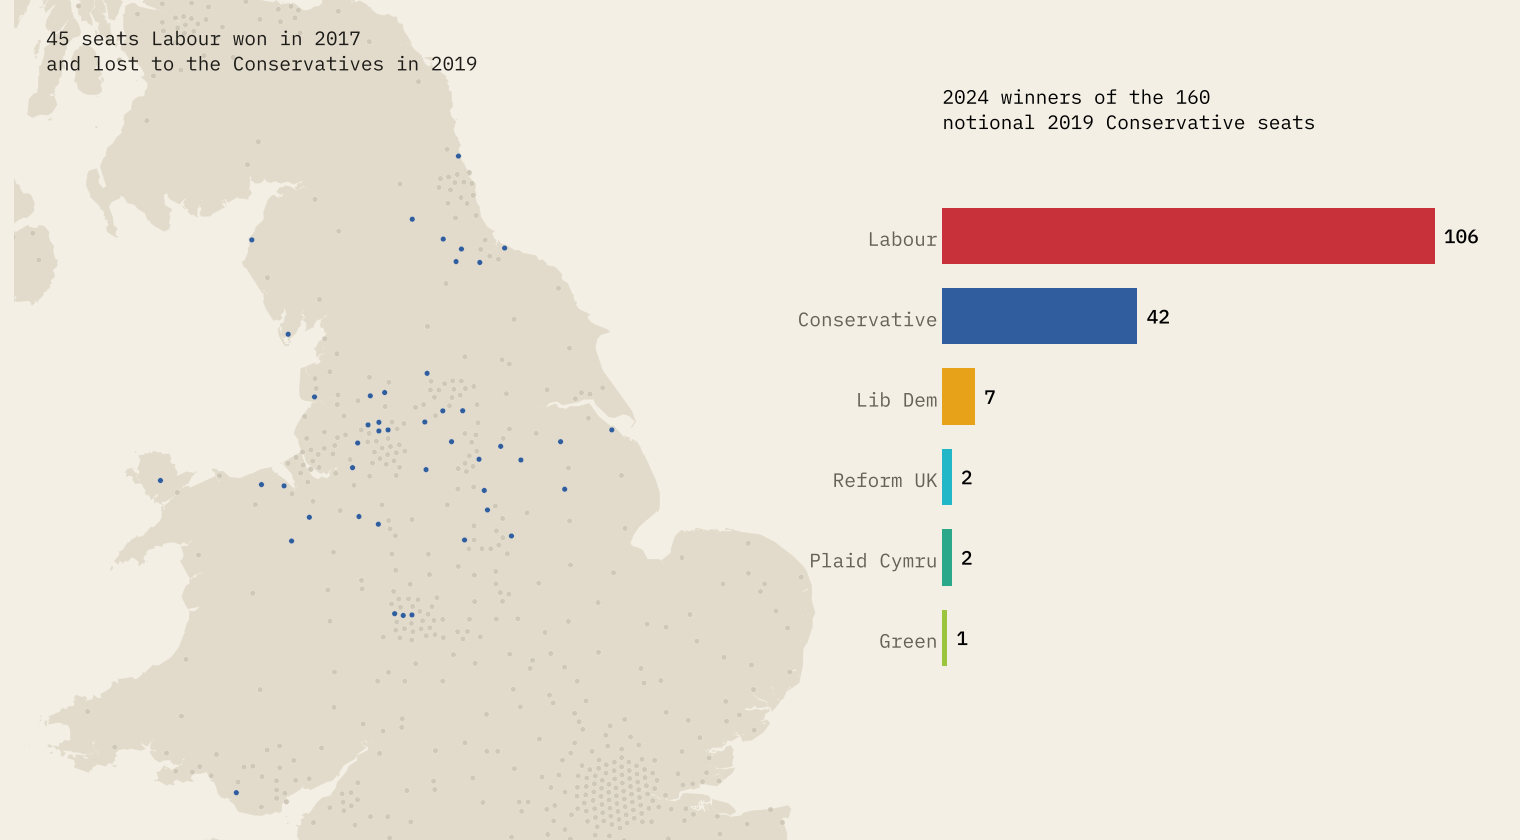
“Red Wall” is a label rather than a list, so I used a simple rule: seats in the North East, North West, Yorkshire and the Humber, the Midlands and Wales that Labour won in 2017 and the Conservatives won in 2019. That gives 45 seats. Followed back by name, the median one had returned Labour at 6 elections in a row.
The 2024 election used new boundaries, so you cannot compare seat by seat. The Commons Library publishes notional 2019 results for the new seats, and on those the Conservatives would have won 160 seats in the same regions. In 2024 Labour won 106 of them and the Conservatives kept 42.
How I did this
The results come from UK Parliament, which publishes every candidate at every general election from 1832 to 2019, and from the House of Commons Library for 2024 and the notional 2019 results. The results file does not say how many members each seat elected, so I took that from Wikidata, which records every MP and the election they won. The totals come out right for every election (658 seats in 1832, 707 in 1918), and the winners’ surnames agree with Wikidata’s members for 98.7% of seats.
Party labels are grouped into families, so that Whigs, Liberals and Liberal Democrats share a colour, and Liberal Unionists, Peelites and the National Liberals who sat with the Conservatives keep their own. Checked against Wikipedia’s election infoboxes, my Conservative, Liberal and Labour seat totals agree within two seats in 111 of 130 comparisons; the rest are differences in grouping. Historic boundaries are not open data for every era, so each constituency is a point, from Wikidata or its town or county, and the dots are spread apart so they do not overlap. Cities swell and big rural seats shrink, and the strip for your town uses the nearest seat point, not the boundary. By-elections are not included.
Notes and sources
- Results 1832 to 2019: UK Parliament, UK General Elections Results 1832 to 2019 (data), Open Parliament Licence v3.0.
- 2024 results and notional 2019 results on the 2024 boundaries: House of Commons Library, Election Results, Open Parliament Licence v3.0. Notional results by Rallings and Thrasher, Professor David Denver and Nicholas Whyte for Sky News, PA, BBC News and ITV News.
- Members per seat, constituencies and places: Wikidata (CC0), retrieved 29 October 2026.
- Check of seat totals: the English Wikipedia article on each general election (CC BY-SA 4.0).
- Places: OS Open Names (Open Government Licence v3.0), GeoNames (CC BY 4.0).
- Paper, data and code: Zenodo and GitHub.
- I wrote the text, with drafting and editing assistance from Claude (Anthropic), which also helped prepare the analysis code. I reviewed and checked all text and results.

