
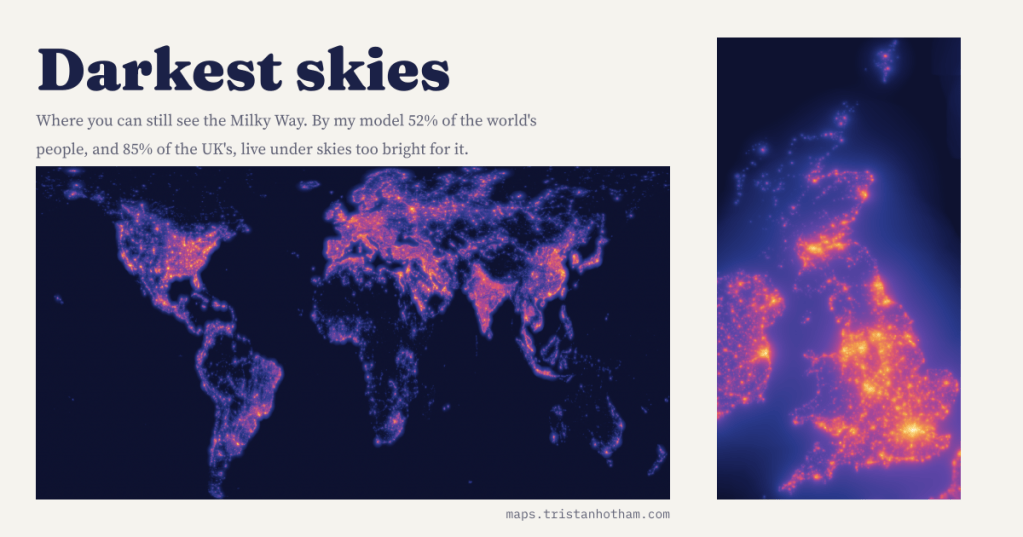
When did you last see the Milky Way? I mapped the glow that our lights throw into the night sky, for the whole world and for every square kilometre of the UK, and checked the map against 6,653 readings from volunteers’ sky meters. About half the world, and 85% of people in the UK, cannot see it from home.
On a clear night with no Moon, far from any town, the Milky Way crosses the sky as a pale, lumpy river of light. It is the disc of our own galaxy seen from inside. It is also faint, and easily drowned. Light that leaves streets, car parks and buildings and heads upwards does not all escape to space: some of it is scattered back down by air and dust, and the whole sky glows. A little glow and the faint stars go. A bit more and the Milky Way goes too.
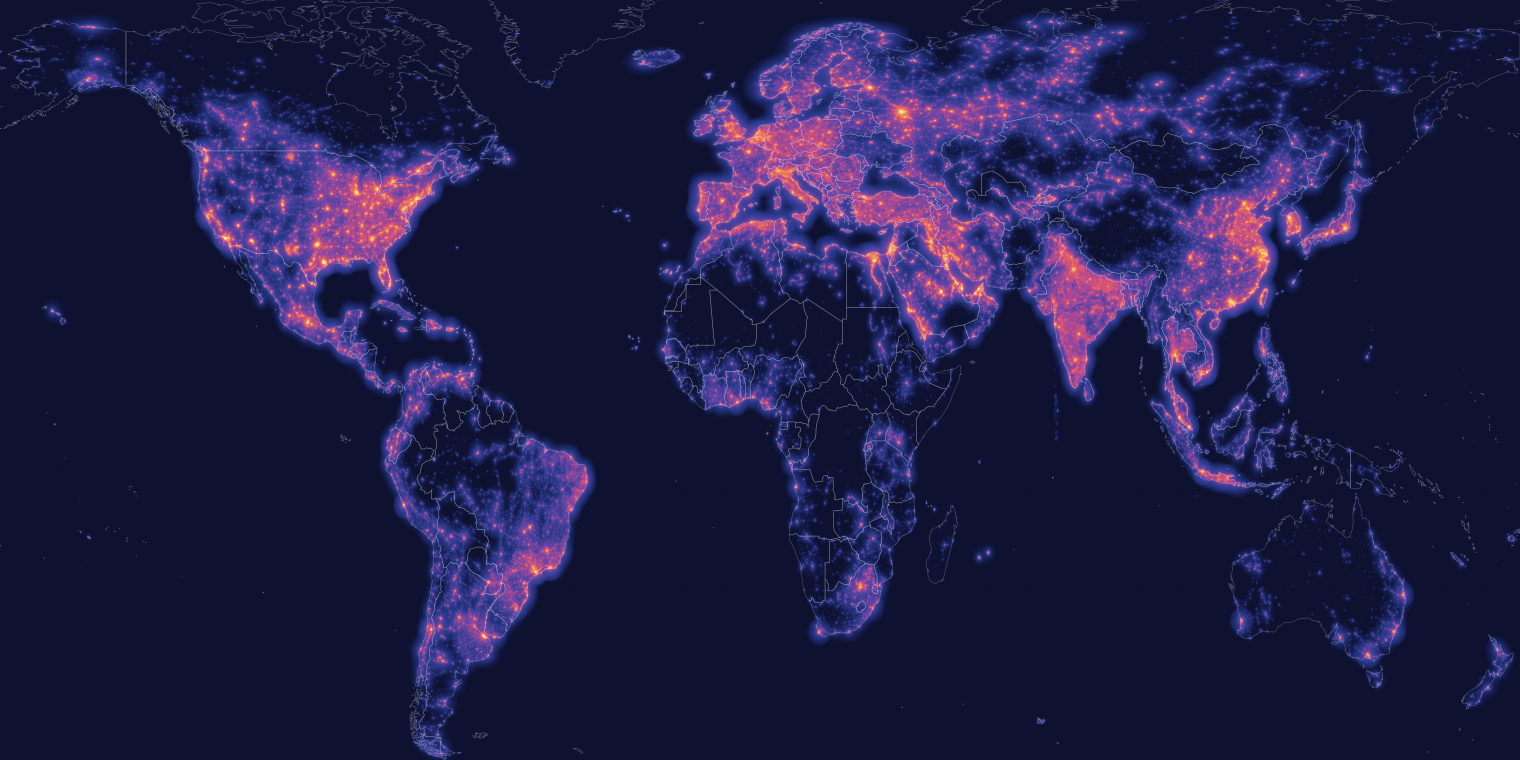
Satellites photograph the Earth at night every night. I took the yearly average of what the VIIRS instrument sees, for every country in 2023, spread each patch of light across the sky around it with a simple rule for how glow fades with distance, and tuned that rule against sky meter readings made by Globe at Night volunteers. Then I laid the result over a map of where people live.
Half the world under a hidden galaxy
I used the thresholds of the best-known study, the World Atlas of Artificial Night Sky Brightness (Falchi and colleagues, 2016). They count the Milky Way as hidden once artificial glow is about four times the natural brightness of the night sky. By my model 52% of the world’s people, about 4.2 billion, live under such a sky. The atlas, using lights from 2014, said 36%.
The gap is not a contradiction. My lights are nine years newer, my population map puts people only where there are buildings, and the sky meter readings I tuned against are mostly taken in the evening, when more lamps are lit than at the satellite’s 1:30 am pass. The atlas uses a far more detailed model of how light scatters, which mine does not. What matters is that the two agree closely on which countries are bright and which dark: the rank correlation across 148 countries is 0.94. I would put the truth somewhere between a third and a half of humanity.
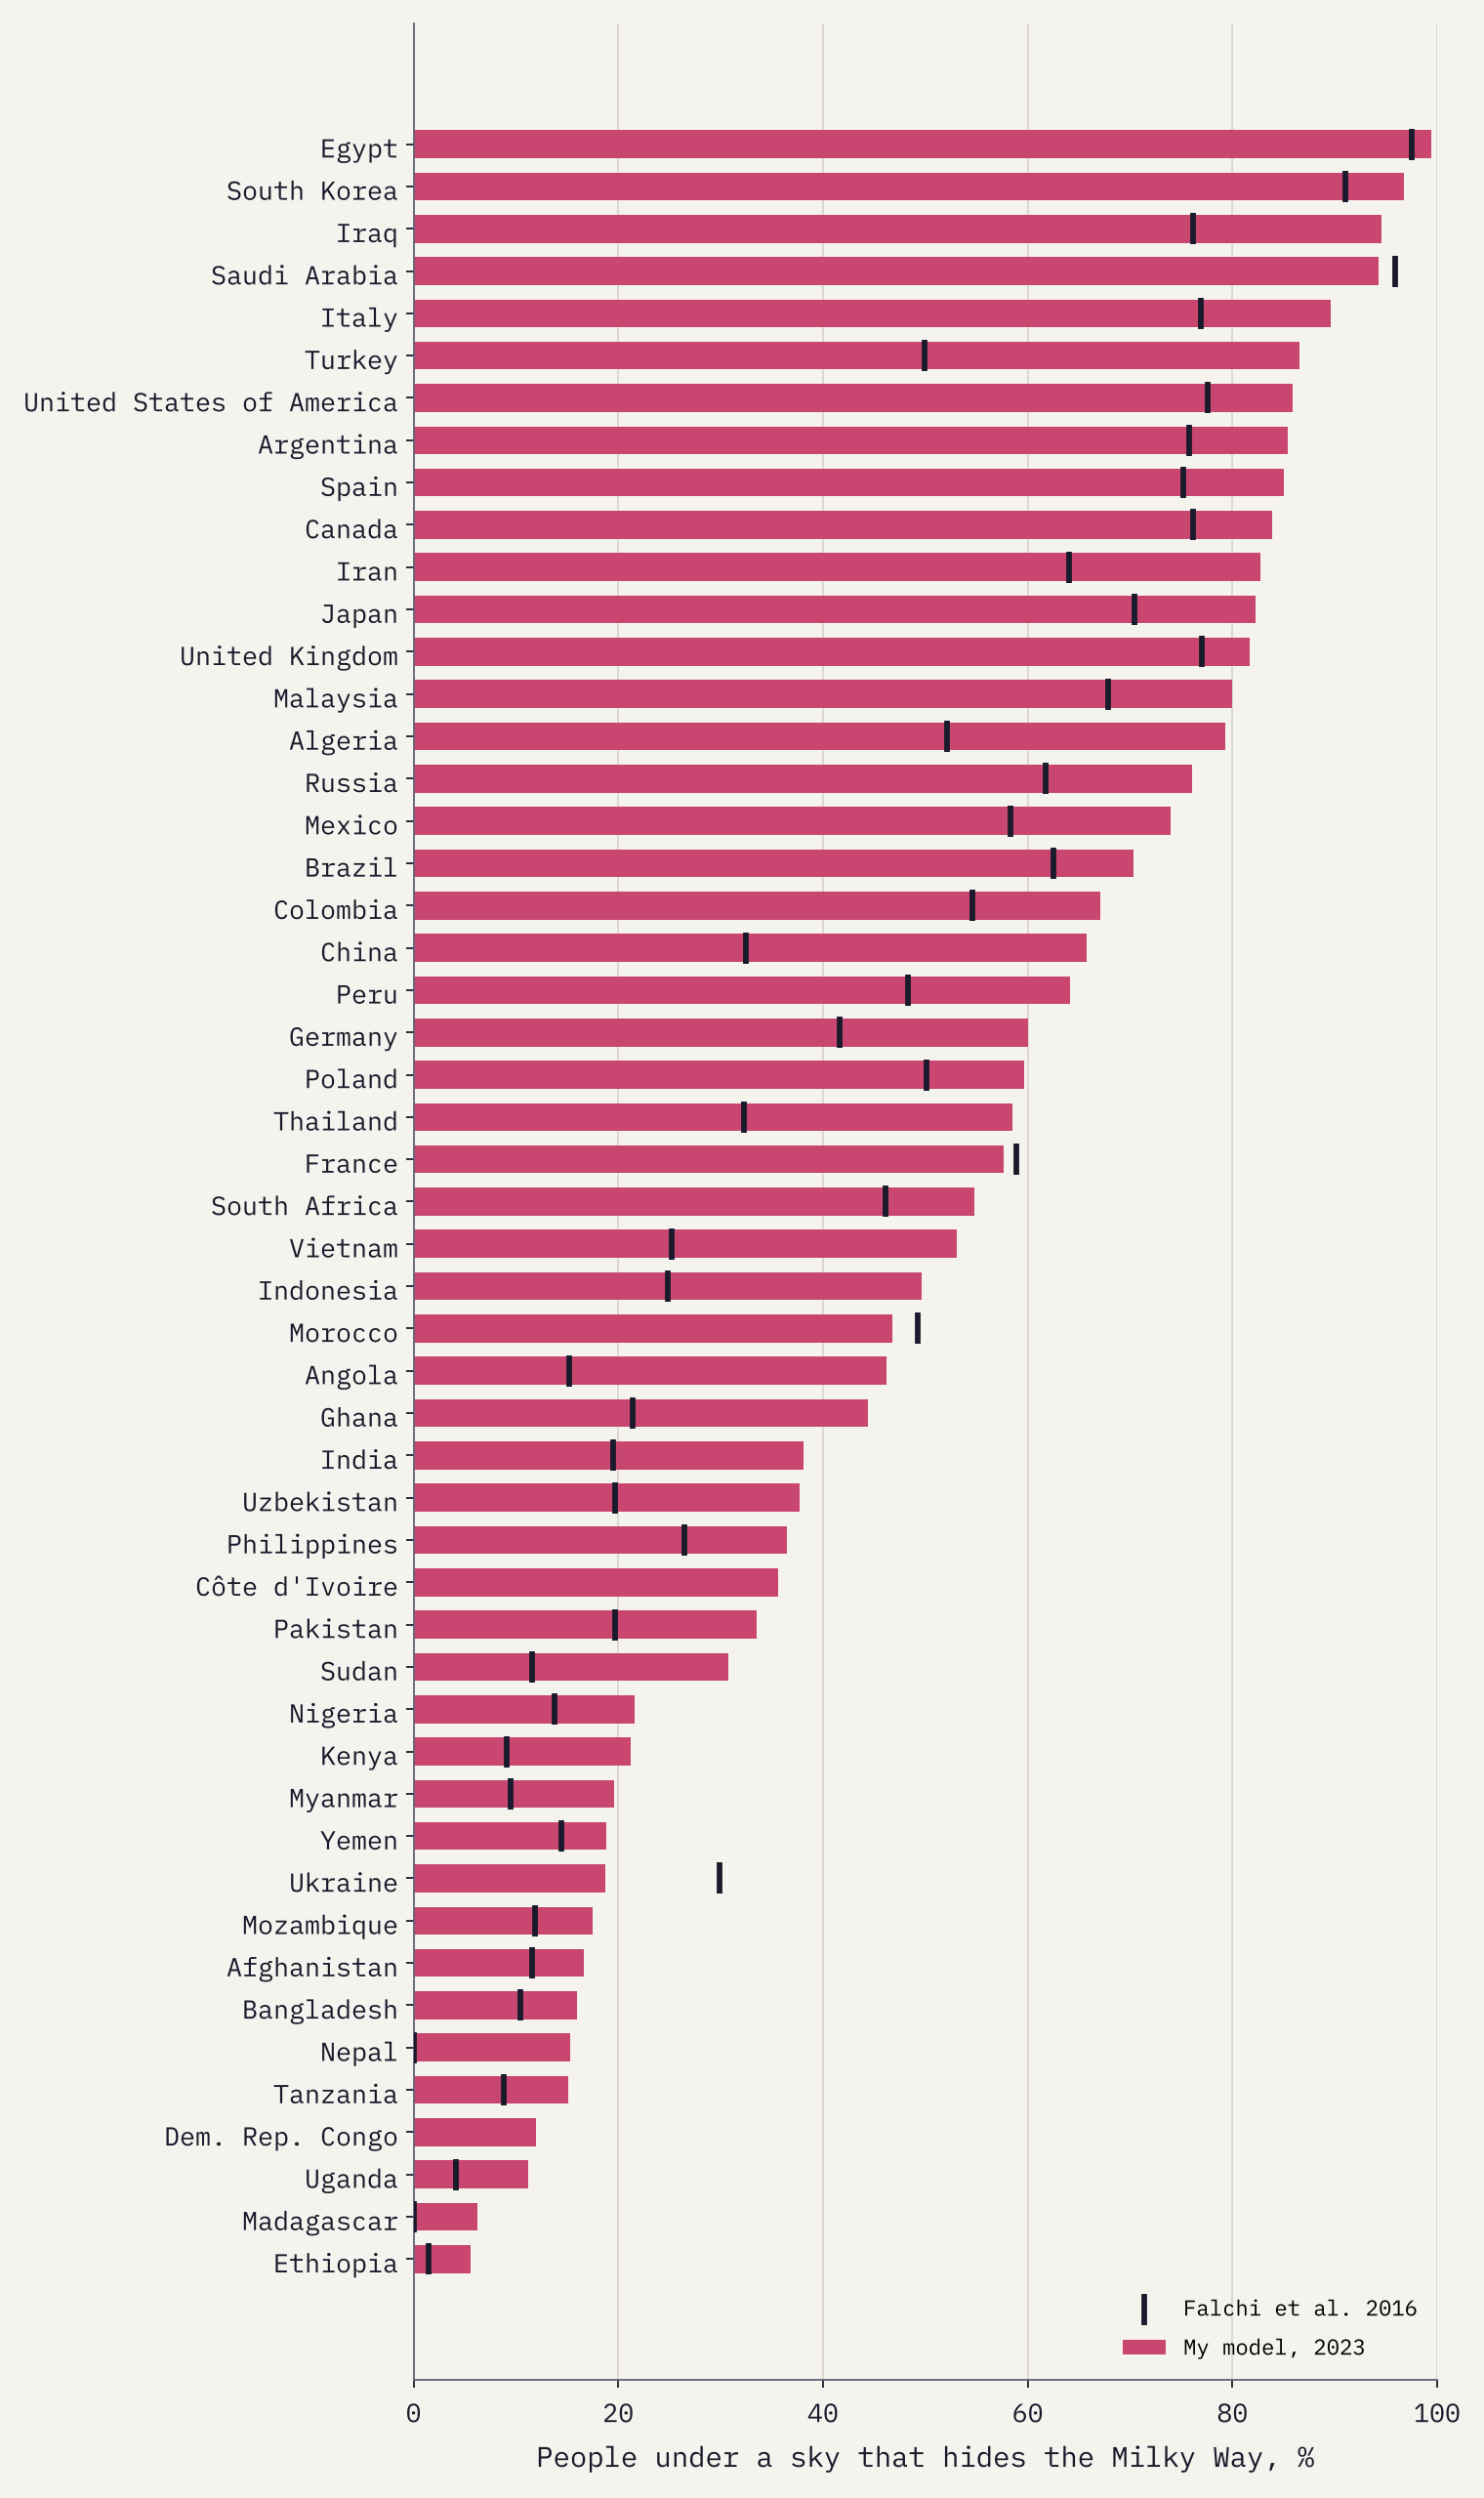
The brightest places are crowded and rich: Hong Kong, Singapore, the Gulf states, Israel, and Egypt, whose people pack into the lit ribbon of the Nile. 66% of people in China cannot see the Milky Way from home, 38% in India and 86% in the United States. In Ethiopia, Sierra Leone and South Sudan almost everyone can, mainly because there is so little electric light at all. A dark sky is not always a sign of good fortune. One country stands out for the opposite reason: in Ukraine my 2023 figure is 19%, against 30% in the atlas, as you would expect after the wartime blackouts.
Britain at one kilometre
For the UK I ran the model on a grid of about one kilometre. 85% of people, about 57.7 million, live where the glow hides the Milky Way. But Britain’s people are packed together, and the Milky Way still shows over 80% of the land.
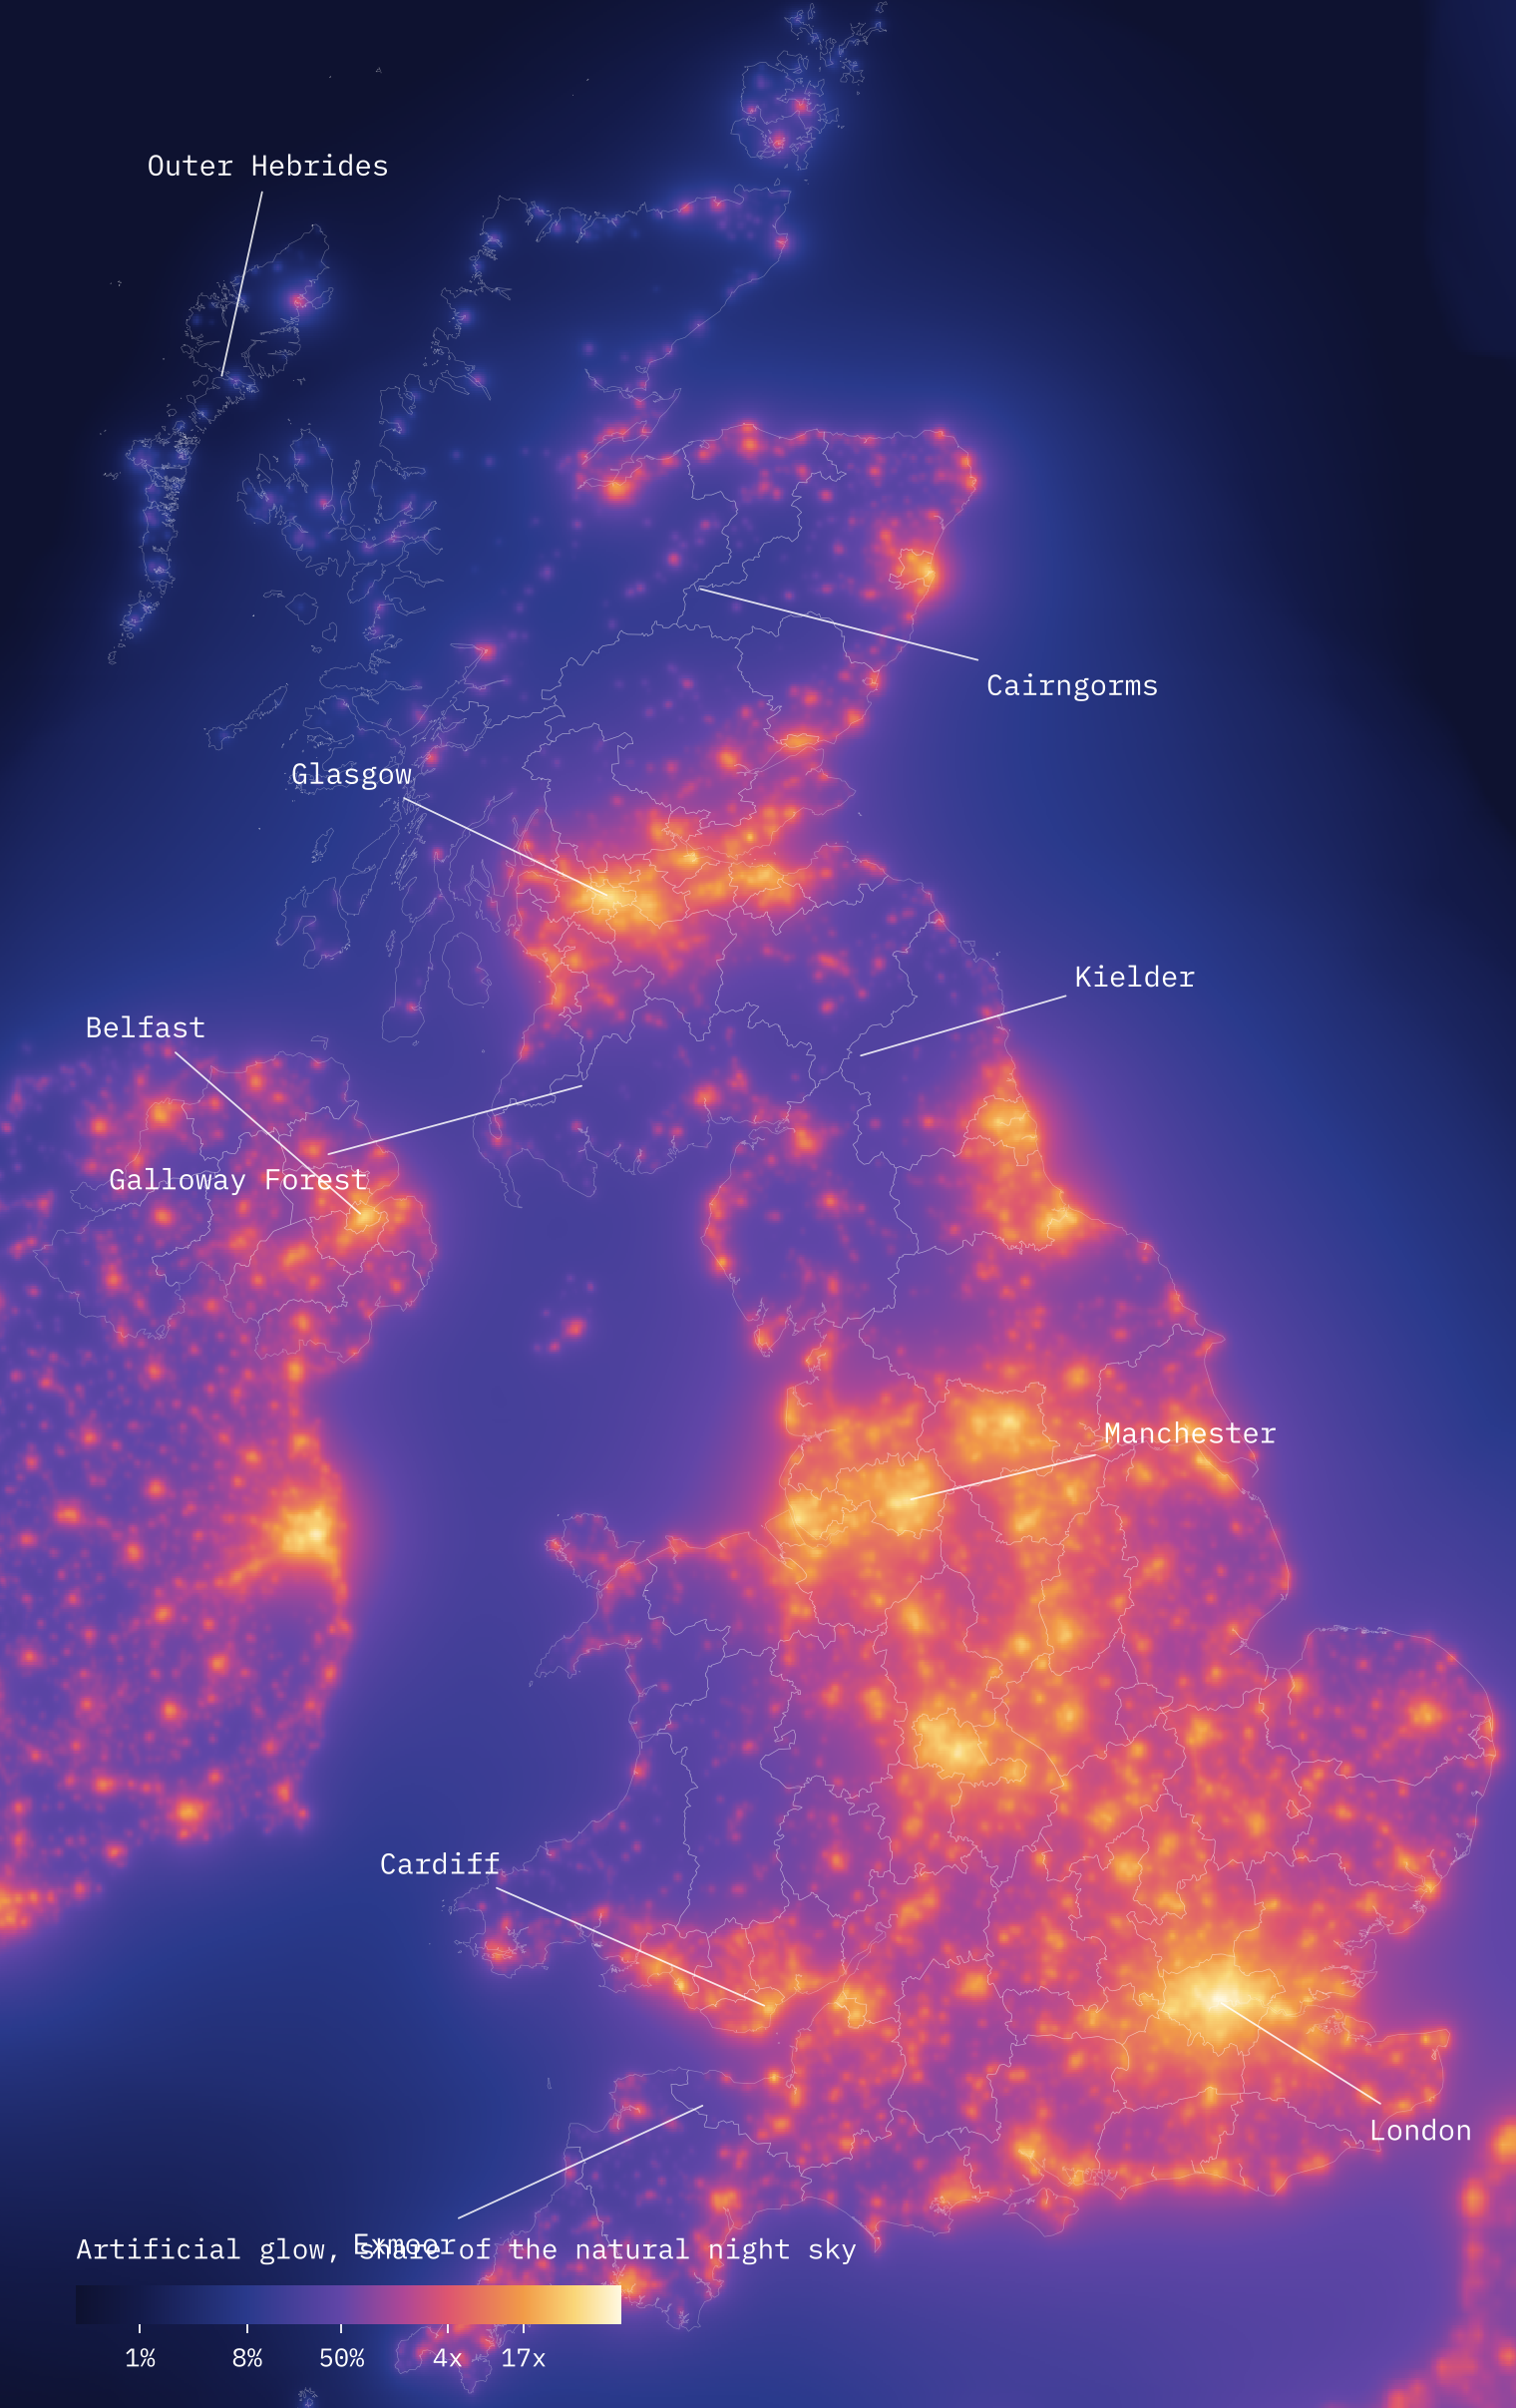
England is the brightest nation: 87% of its people and 32% of its land sit under a Milky Way hiding sky. The darkest places in the UK are all Scottish: the Western Isles, Highland, Orkney, Shetland, and Argyll and Bute. England’s darkest counties are Northumberland, Devon, Cumbria, Cornwall and Dorset. The town with the darkest sky is Hugh Town on St Mary’s in the Isles of Scilly, followed by New Galloway, Tobermory on Mull, Chagford on Dartmoor and Whithorn.
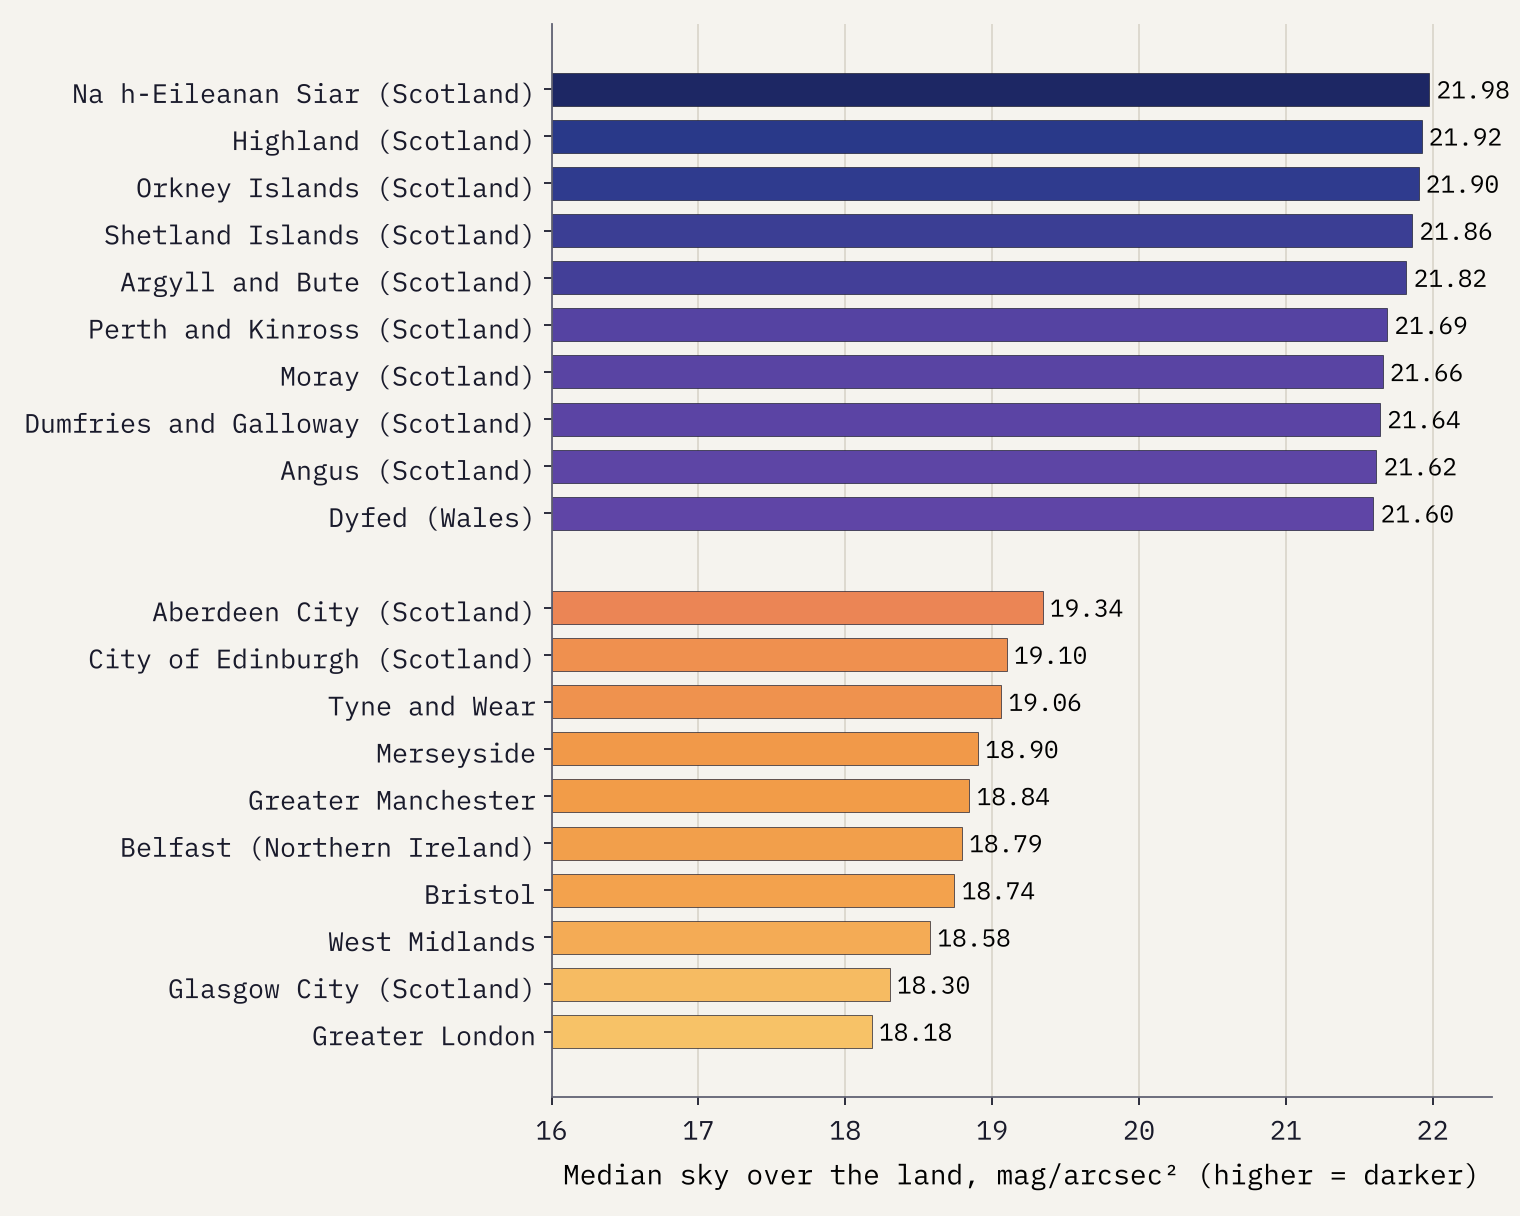
The size of the place you live matters more than where it is. The Milky Way should be visible from the centre of 3% of the UK’s cities, 37% of its towns, 67% of its villages and 82% of its hamlets. In 183 of 359 council areas, practically nobody can see it from home.
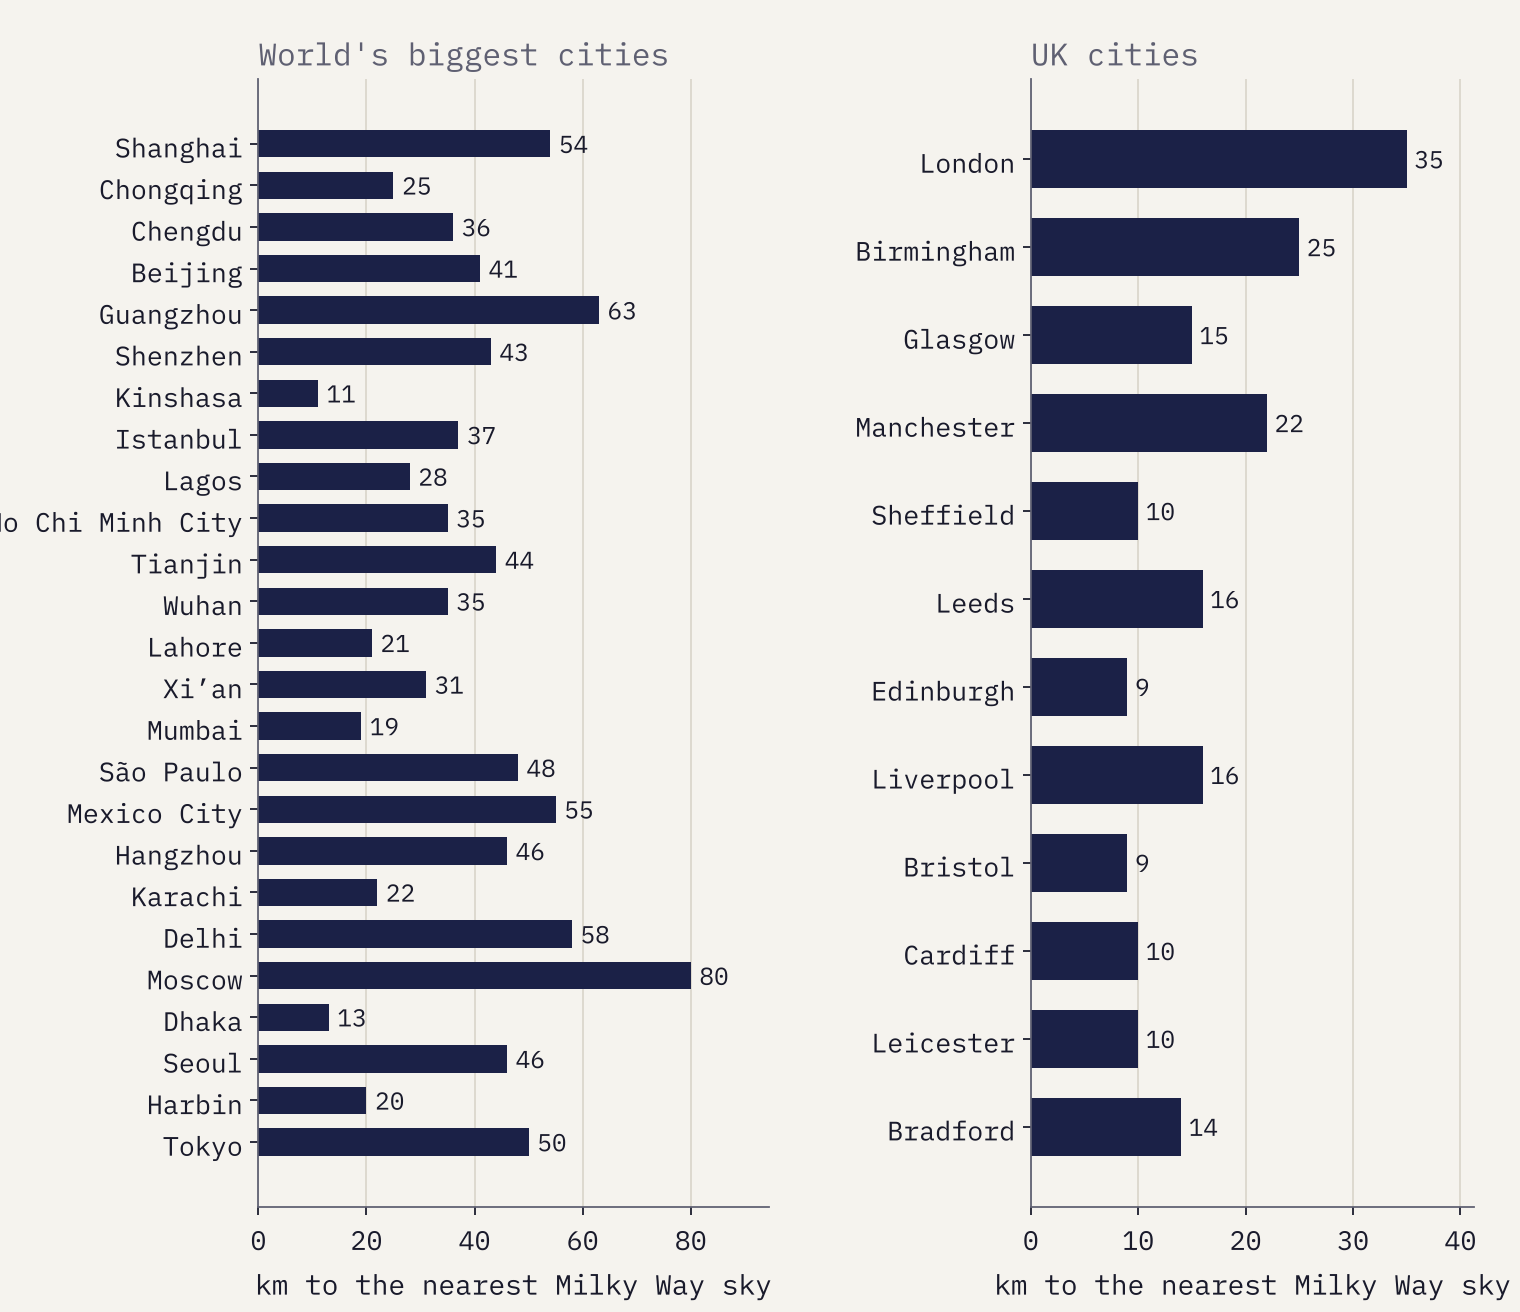
From central London, the nearest sky where the Milky Way shows is 35 km away, near Toys Hill in Kent.
How far to the dark?
The good news is that the worst glow is concentrated. For the median city of a million people or more, a Milky Way sky is only 17 km away. For Birmingham it is 25 km, for Manchester 22 km (up on the moors above Glossop) and for Glasgow 15 km. The great sprawls are harder: 74 km from New York, 80 km from Moscow.
Darker from space, brighter on the ground?
One result surprised me. The light that VIIRS records from Great Britain fell by 13.5% between 2015 and 2023, and fell in all but 19 of the UK’s 98 counties and council areas, most of all in Tyne and Wear. Ireland’s rose by 10.3%.
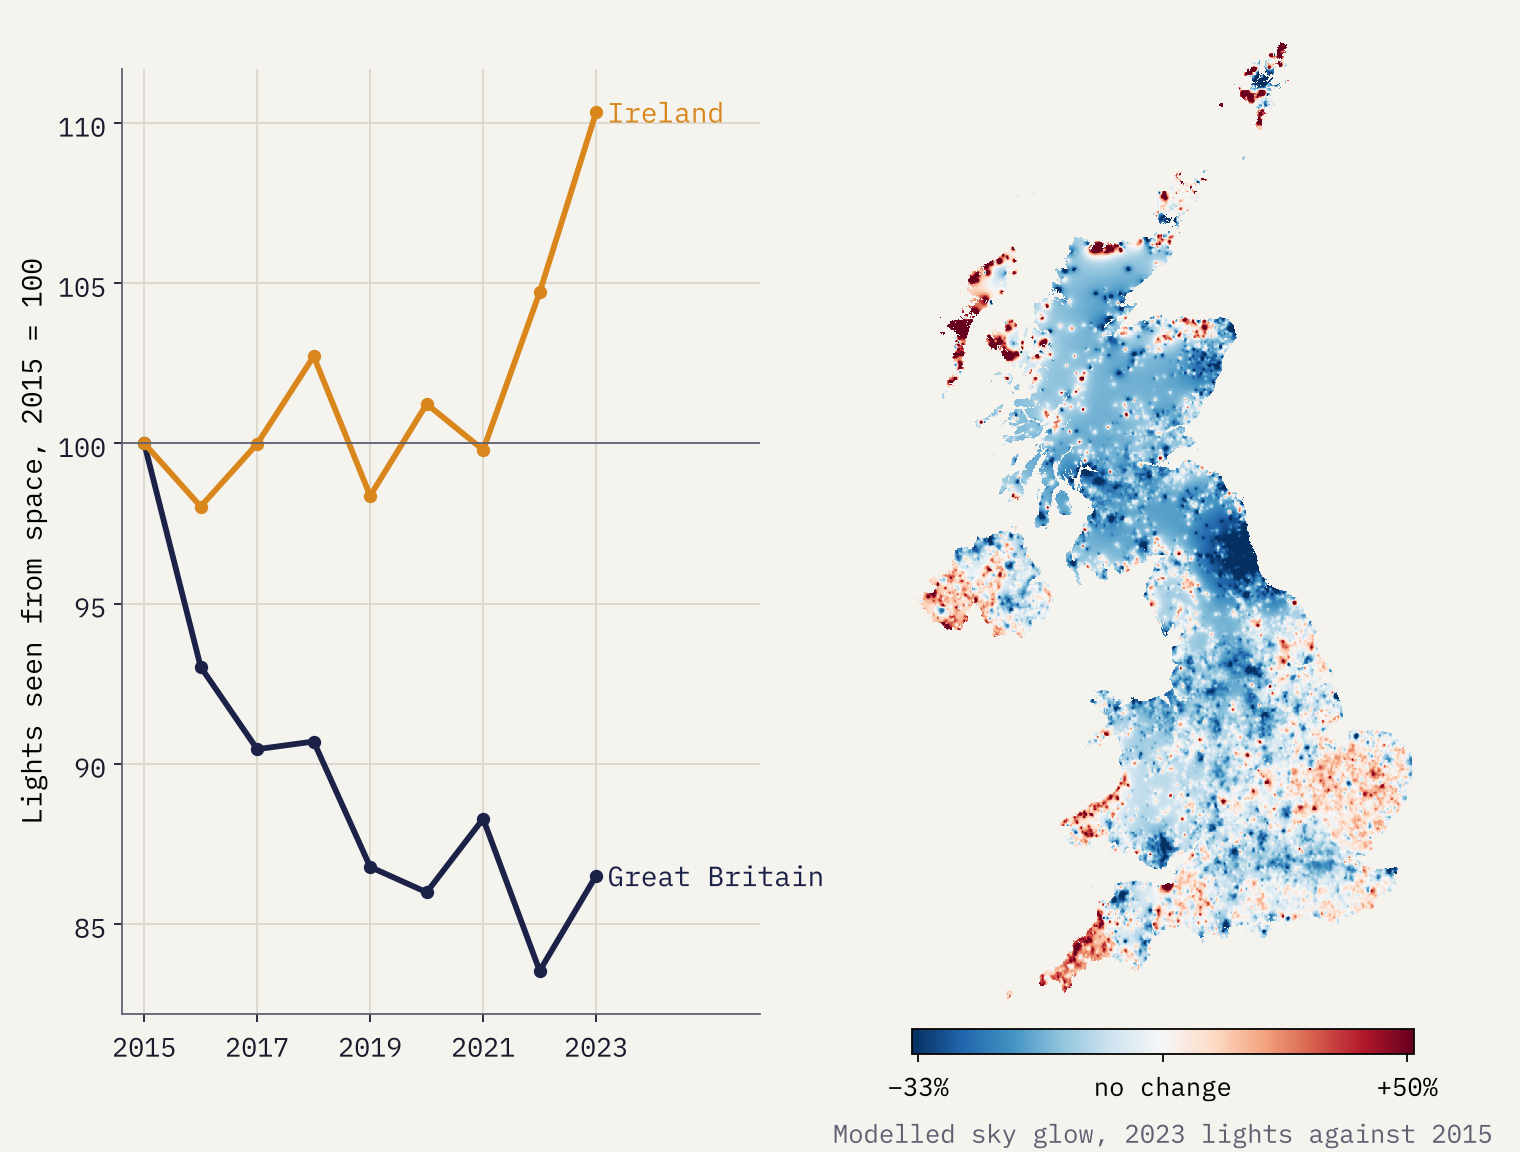
I would not take that at face value. Over these years councils swapped orange sodium street lamps for white LEDs. LEDs are often dimmer and better aimed, which helps. But they put much of their light into blue wavelengths that the satellite barely sees, and blue light scatters more in the air. Volunteers counting stars tell a different story: across the world, the stars people could see faded quickly between 2011 and 2022, equivalent to the sky brightening by about 10% a year (Kyba and colleagues, 2023). From space, Britain looks darker. From the back garden, probably not.
How I did this
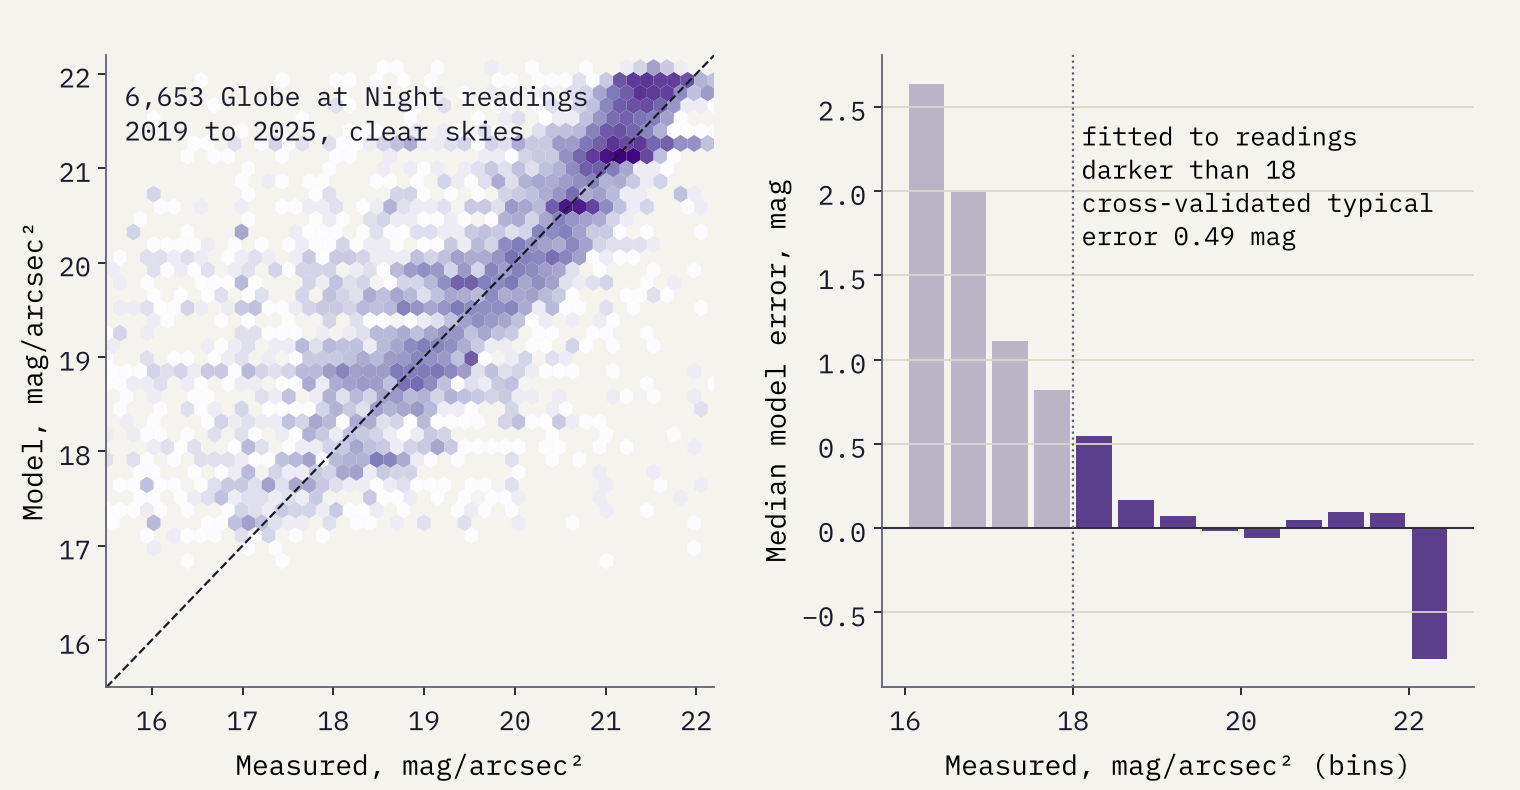
The lights are the Earth Observation Group’s yearly VIIRS composites, as republished per country by WorldPop. I read all 246 country files for 2023 in my browser and averaged them to a world grid of about 4.6 km, and the UK and Ireland files for 2015 to 2023 to about 1 km. Each patch’s light spreads to every place within 250 km with a weight that falls with distance to the power 2.3. I fitted that power and the overall scale to 5,775 Globe at Night sky meter readings from 2019 to 2025, leaving out the brightest city-centre readings that a 4.6 km grid cannot resolve. Tested on regions it had not seen, the model misses a typical reading by 0.49 magnitudes. People are from WorldPop’s 2023 population grid.
It is a model, not a measurement. It ignores hills, haze and the colour and angle of lamps, it is tuned on readings mostly from North America and Europe, and it underestimates the brightest city centres. I did not use the atlas grid itself: it is published under a non-commercial licence with a note forbidding redistribution, so I quote only the figures printed in the paper.
Notes and sources
- Night lights: Earth Observation Group, Colorado School of Mines, VIIRS annual night lights (Elvidge et al. 2021), as resampled per country by WorldPop (CC BY 4.0).
- Population: WorldPop 2023 population, R2025A (CC BY 4.0).
- Sky meter readings: Globe at Night, NOIRLab (CC BY 4.0).
- Thresholds and comparison: Falchi, F. et al. (2016) The new world atlas of artificial night sky brightness, Science Advances.
- Star visibility: Kyba, C.C.M. et al. (2023) Citizen scientists report global rapid reductions in the visibility of stars from 2011 to 2022, Science 379: 265 to 268.
- Dark Sky Places: English Wikipedia, Dark-sky preserve (CC BY-SA 4.0). Places: OS Open Names (Open Government Licence) and GeoNames.
- Paper, data and code: Zenodo and GitHub.
- I wrote the text, with drafting and editing assistance from Claude (Anthropic), which also helped prepare the analysis code. I reviewed and checked all text and results.

