
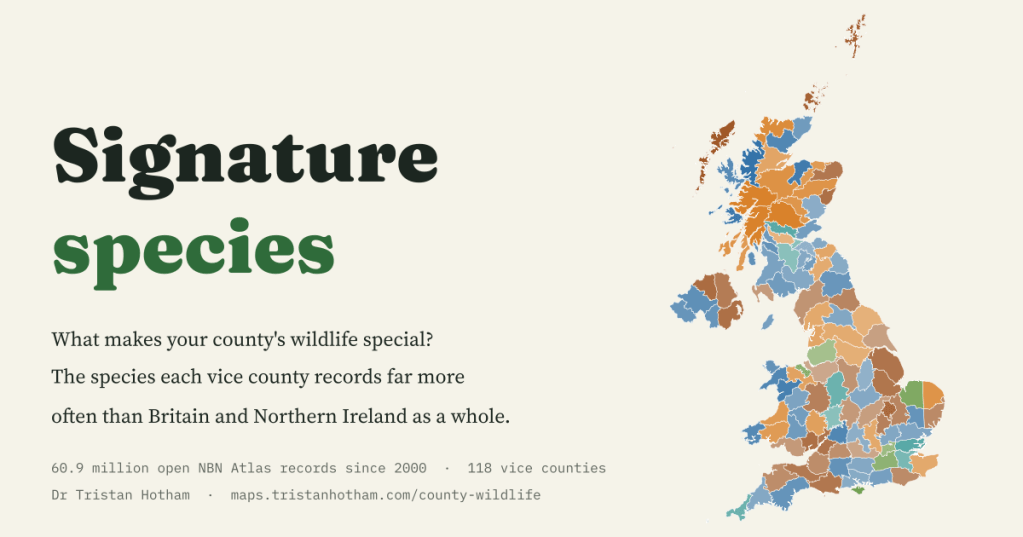
Every county has a creature that seems to belong to it. I sorted 60.9 million open wildlife records into Britain and Northern Ireland’s 118 vice counties to find each one’s signature species.
Ask anyone who walks, birds or botanises what is special about their county and you will get an answer straight away. Pembrokeshire has its shearwaters. The Broads have swallowtails. The Hebrides have corncrakes, rasping away in the iris beds at night. I wanted to know whether the records themselves give the same answers when every county is treated in exactly the same way, and what else turns up.
The National Biodiversity Network’s Atlas gathers wildlife sightings from hundreds of recording schemes, societies, records centres and volunteers. I took only the records that are openly licensed, identified to species and dated 2000 or later: 60,917,118 of them in the vice counties, the fixed recording areas naturalists have used since the nineteenth century. Then I asked one question of each county: which species make up a much bigger share of its records than they do nationally?
A signature for every county
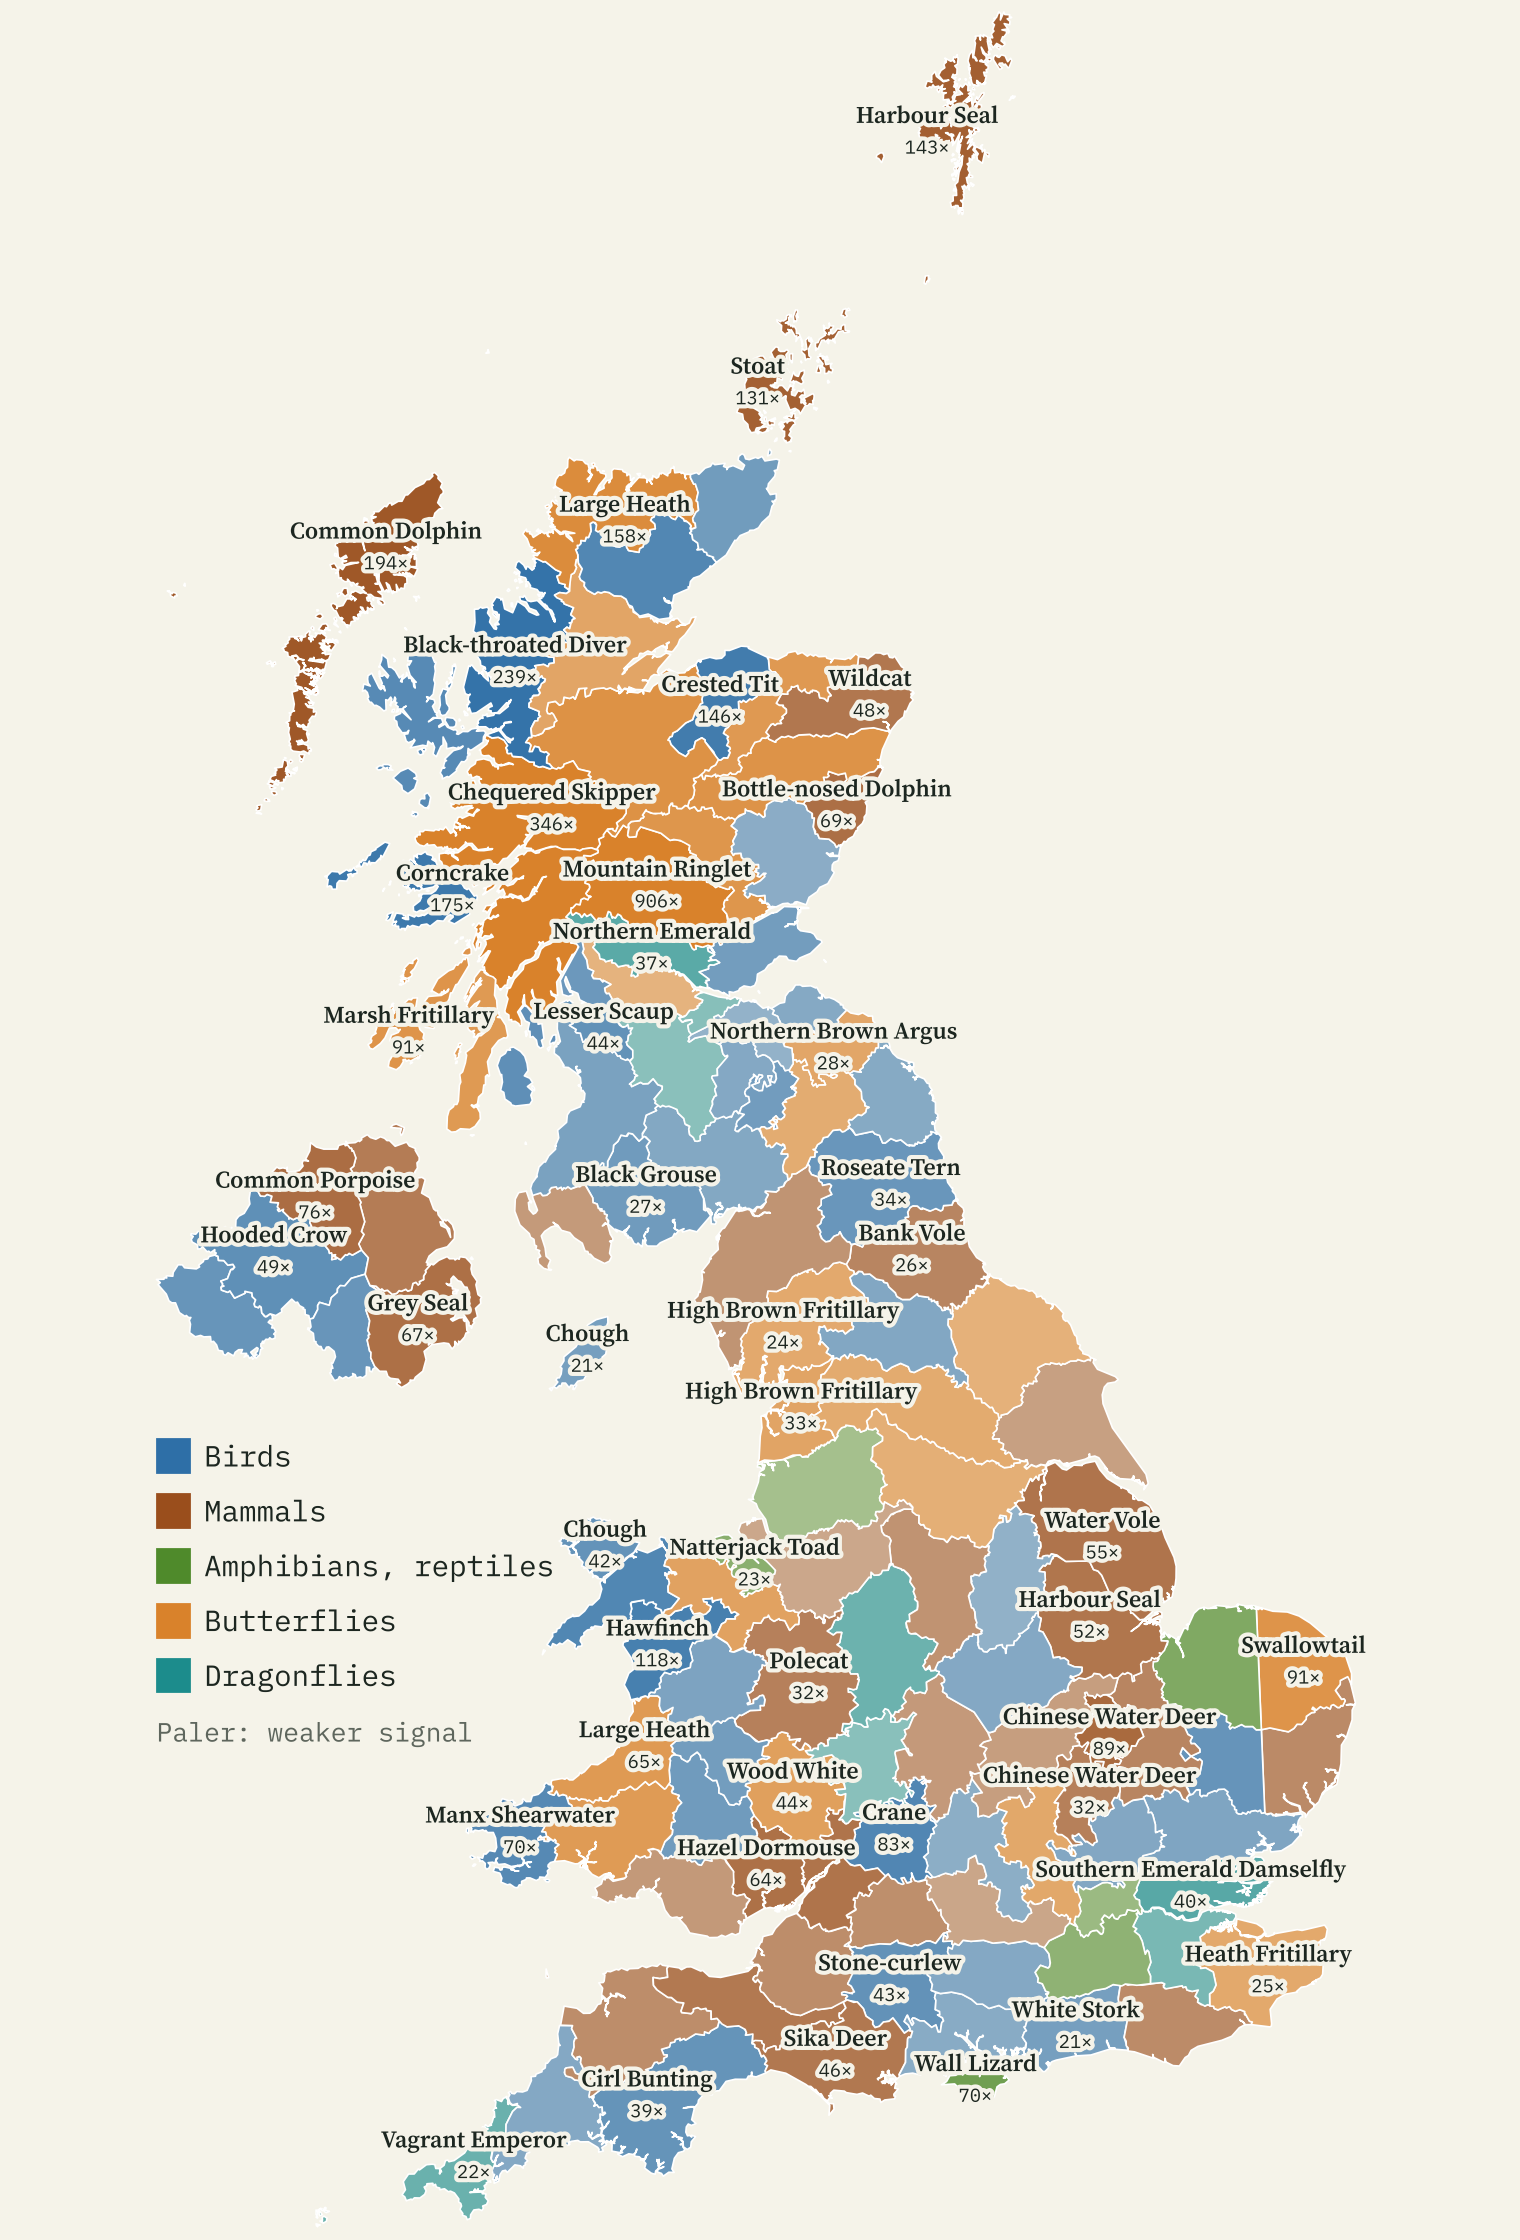
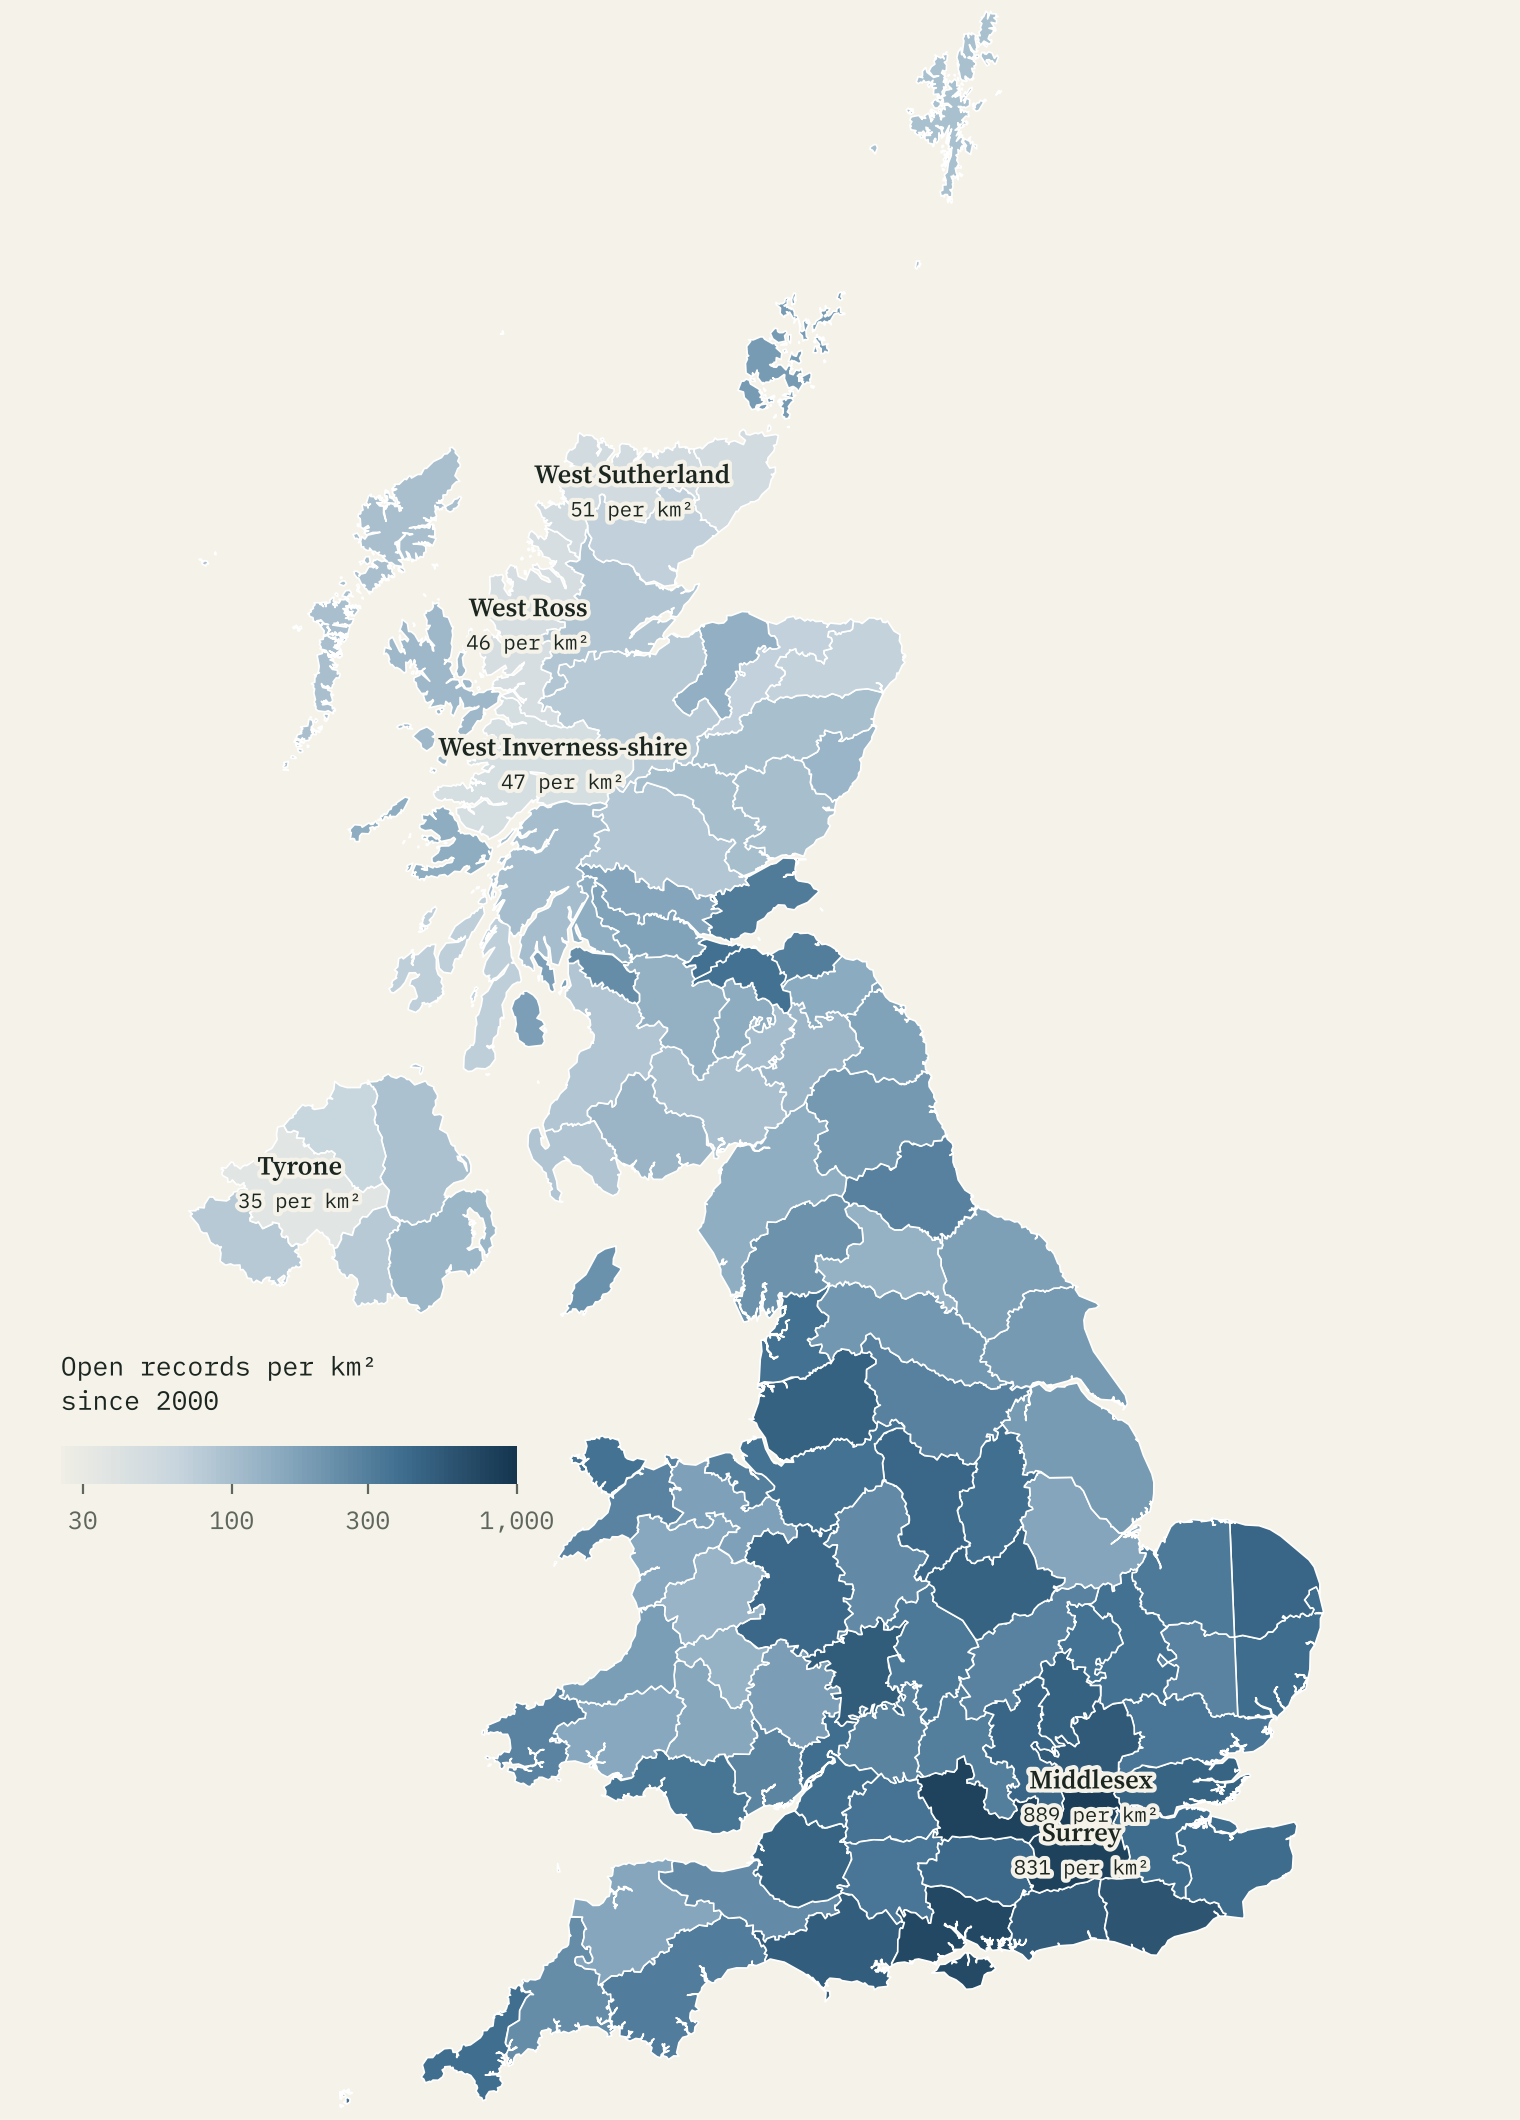
The measure is a location quotient. If corncrakes are a hundred times as large a slice of a county’s bird records as of all bird records, the quotient is 100. Using shares rather than raw counts matters, because recording effort is wildly uneven: Middlesex has 889 open records per square kilometre since 2000 and Tyrone has 35. Comparing each species with the rest of its own group in the same county cancels most of that out.
The map reads like a naturalist’s gazetteer. The corncrake makes up 175 times its national share of bird records in the Mid Ebudes (Mull, Coll, Tiree and their neighbours). The Manx shearwater is 70 times over-represented in Pembrokeshire, the crested tit 146 times in Moray, the chough 81 times in Caernarvonshire and the cirl bunting 39 times in South Devon. The swallowtail scores 91 in East Norfolk, the Glanville fritillary 62 on the Isle of Wight.
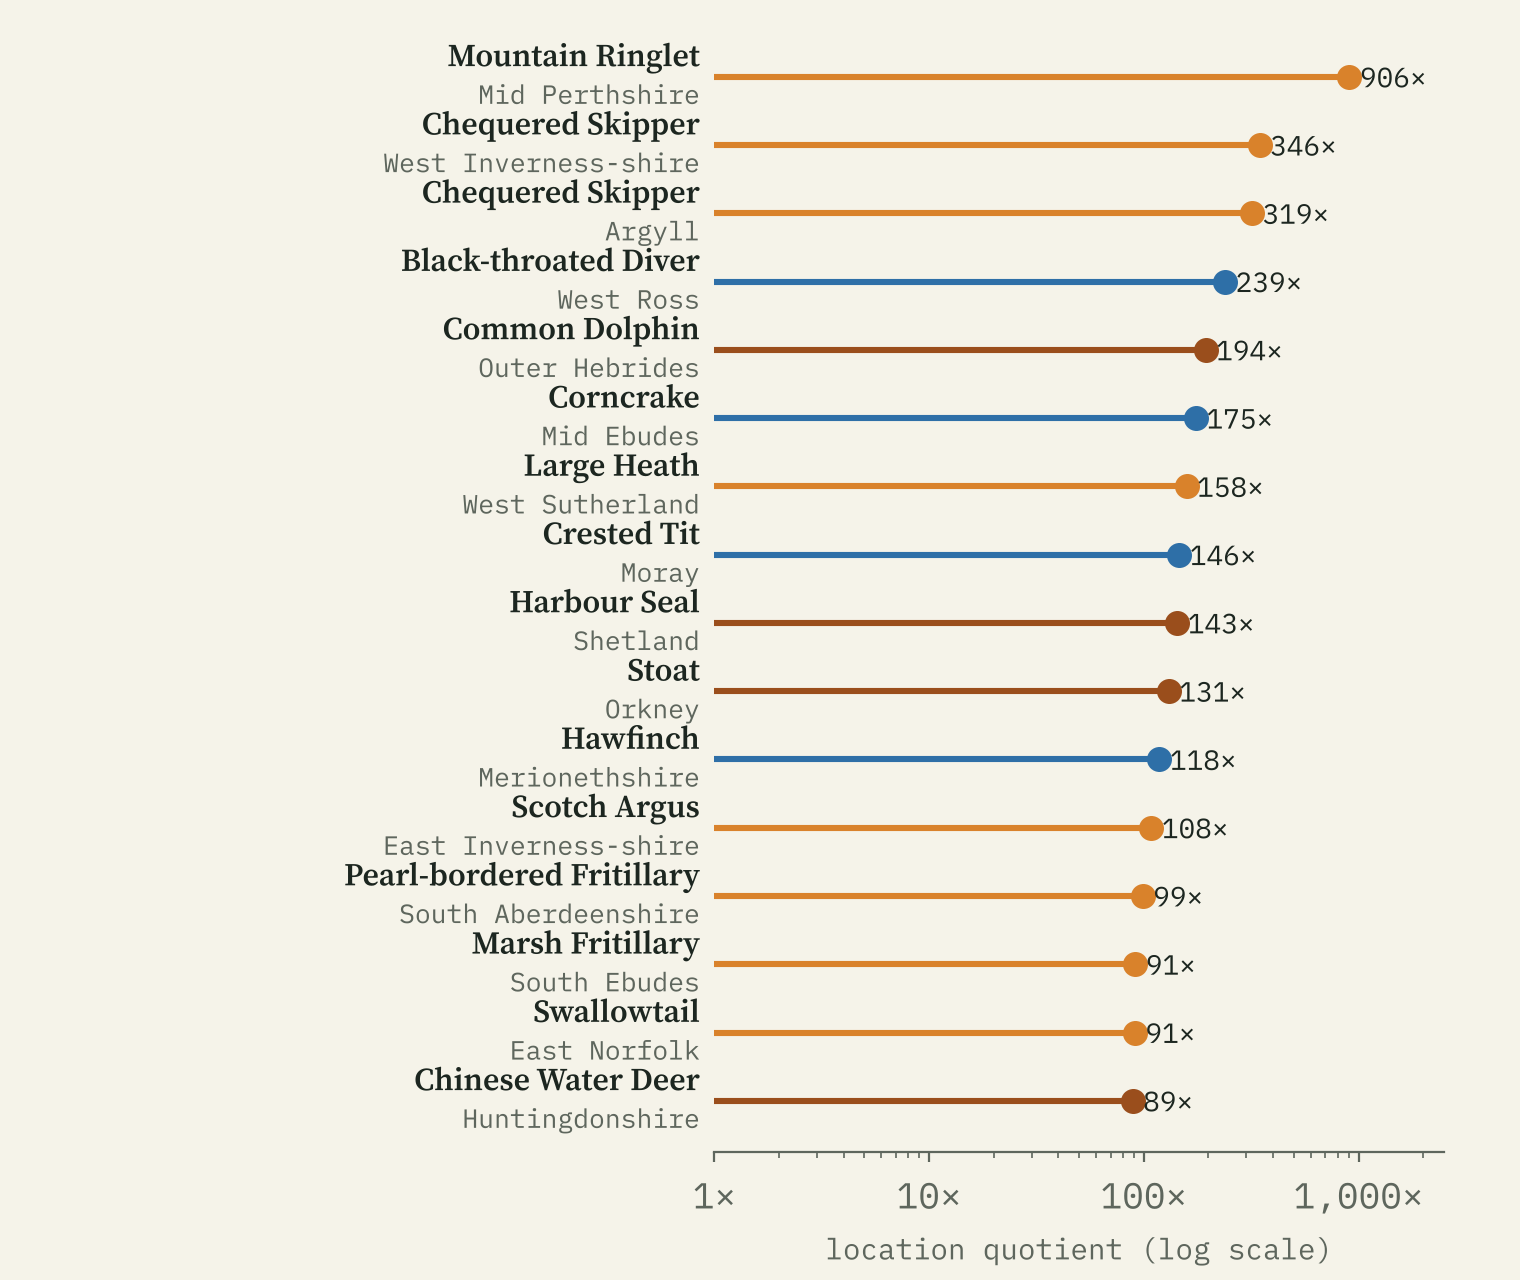
The mountain ringlet makes up 906 times as large a share of butterfly records in Mid Perthshire as it does across the UK.
Birds, then mammals, then butterflies
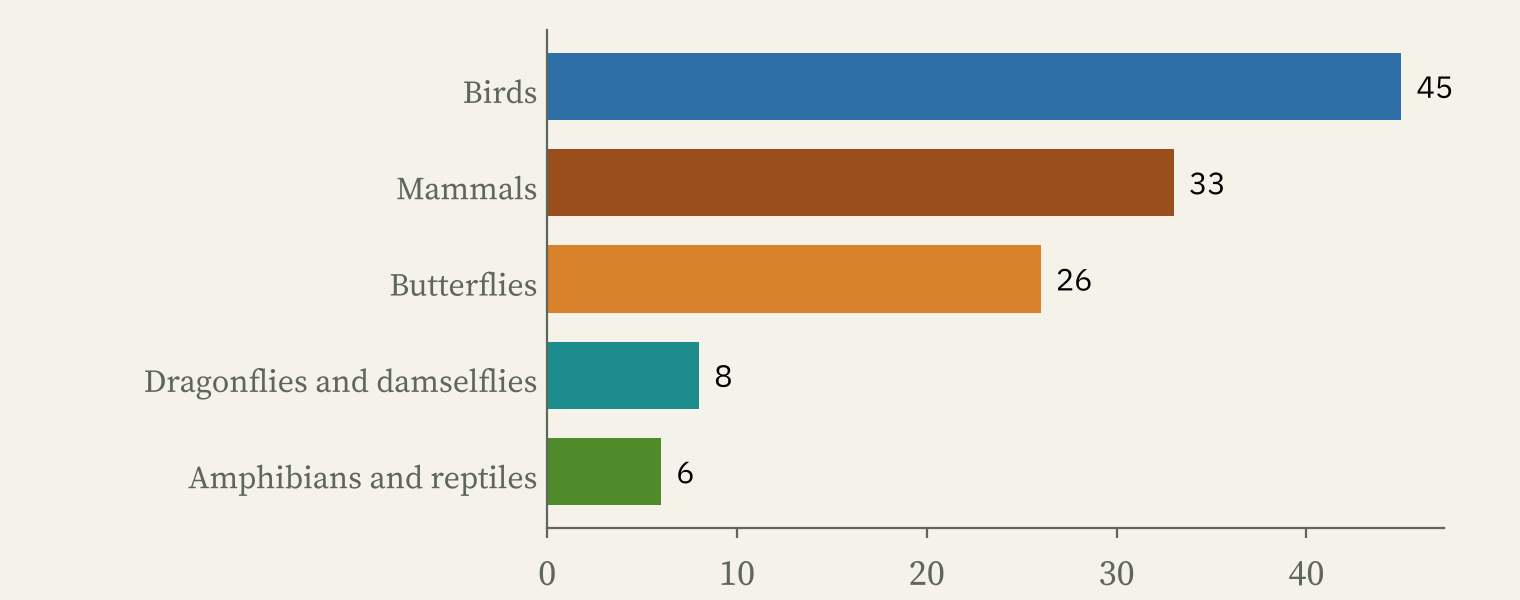
A bird is the signature animal of 45 counties, a mammal of 33, a butterfly of 26, a dragonfly of 8 and an amphibian or reptile of 6. The Scotch argus, a dark brown butterfly of Scottish grassland, is the signature of 6 counties, more than any other species, and the hooded crow is the signature bird of 6 of Northern Ireland’s six.
Some signatures are animals people brought. Chinese water deer top the list in Huntingdonshire (89 times), wild boar in West Gloucestershire, home of the Forest of Dean (56), wall lizards on the Isle of Wight and stoats on Orkney (131). And because records just offshore count for the county, dolphins, porpoises and seals turn up as coastal signatures.
The least typical counties
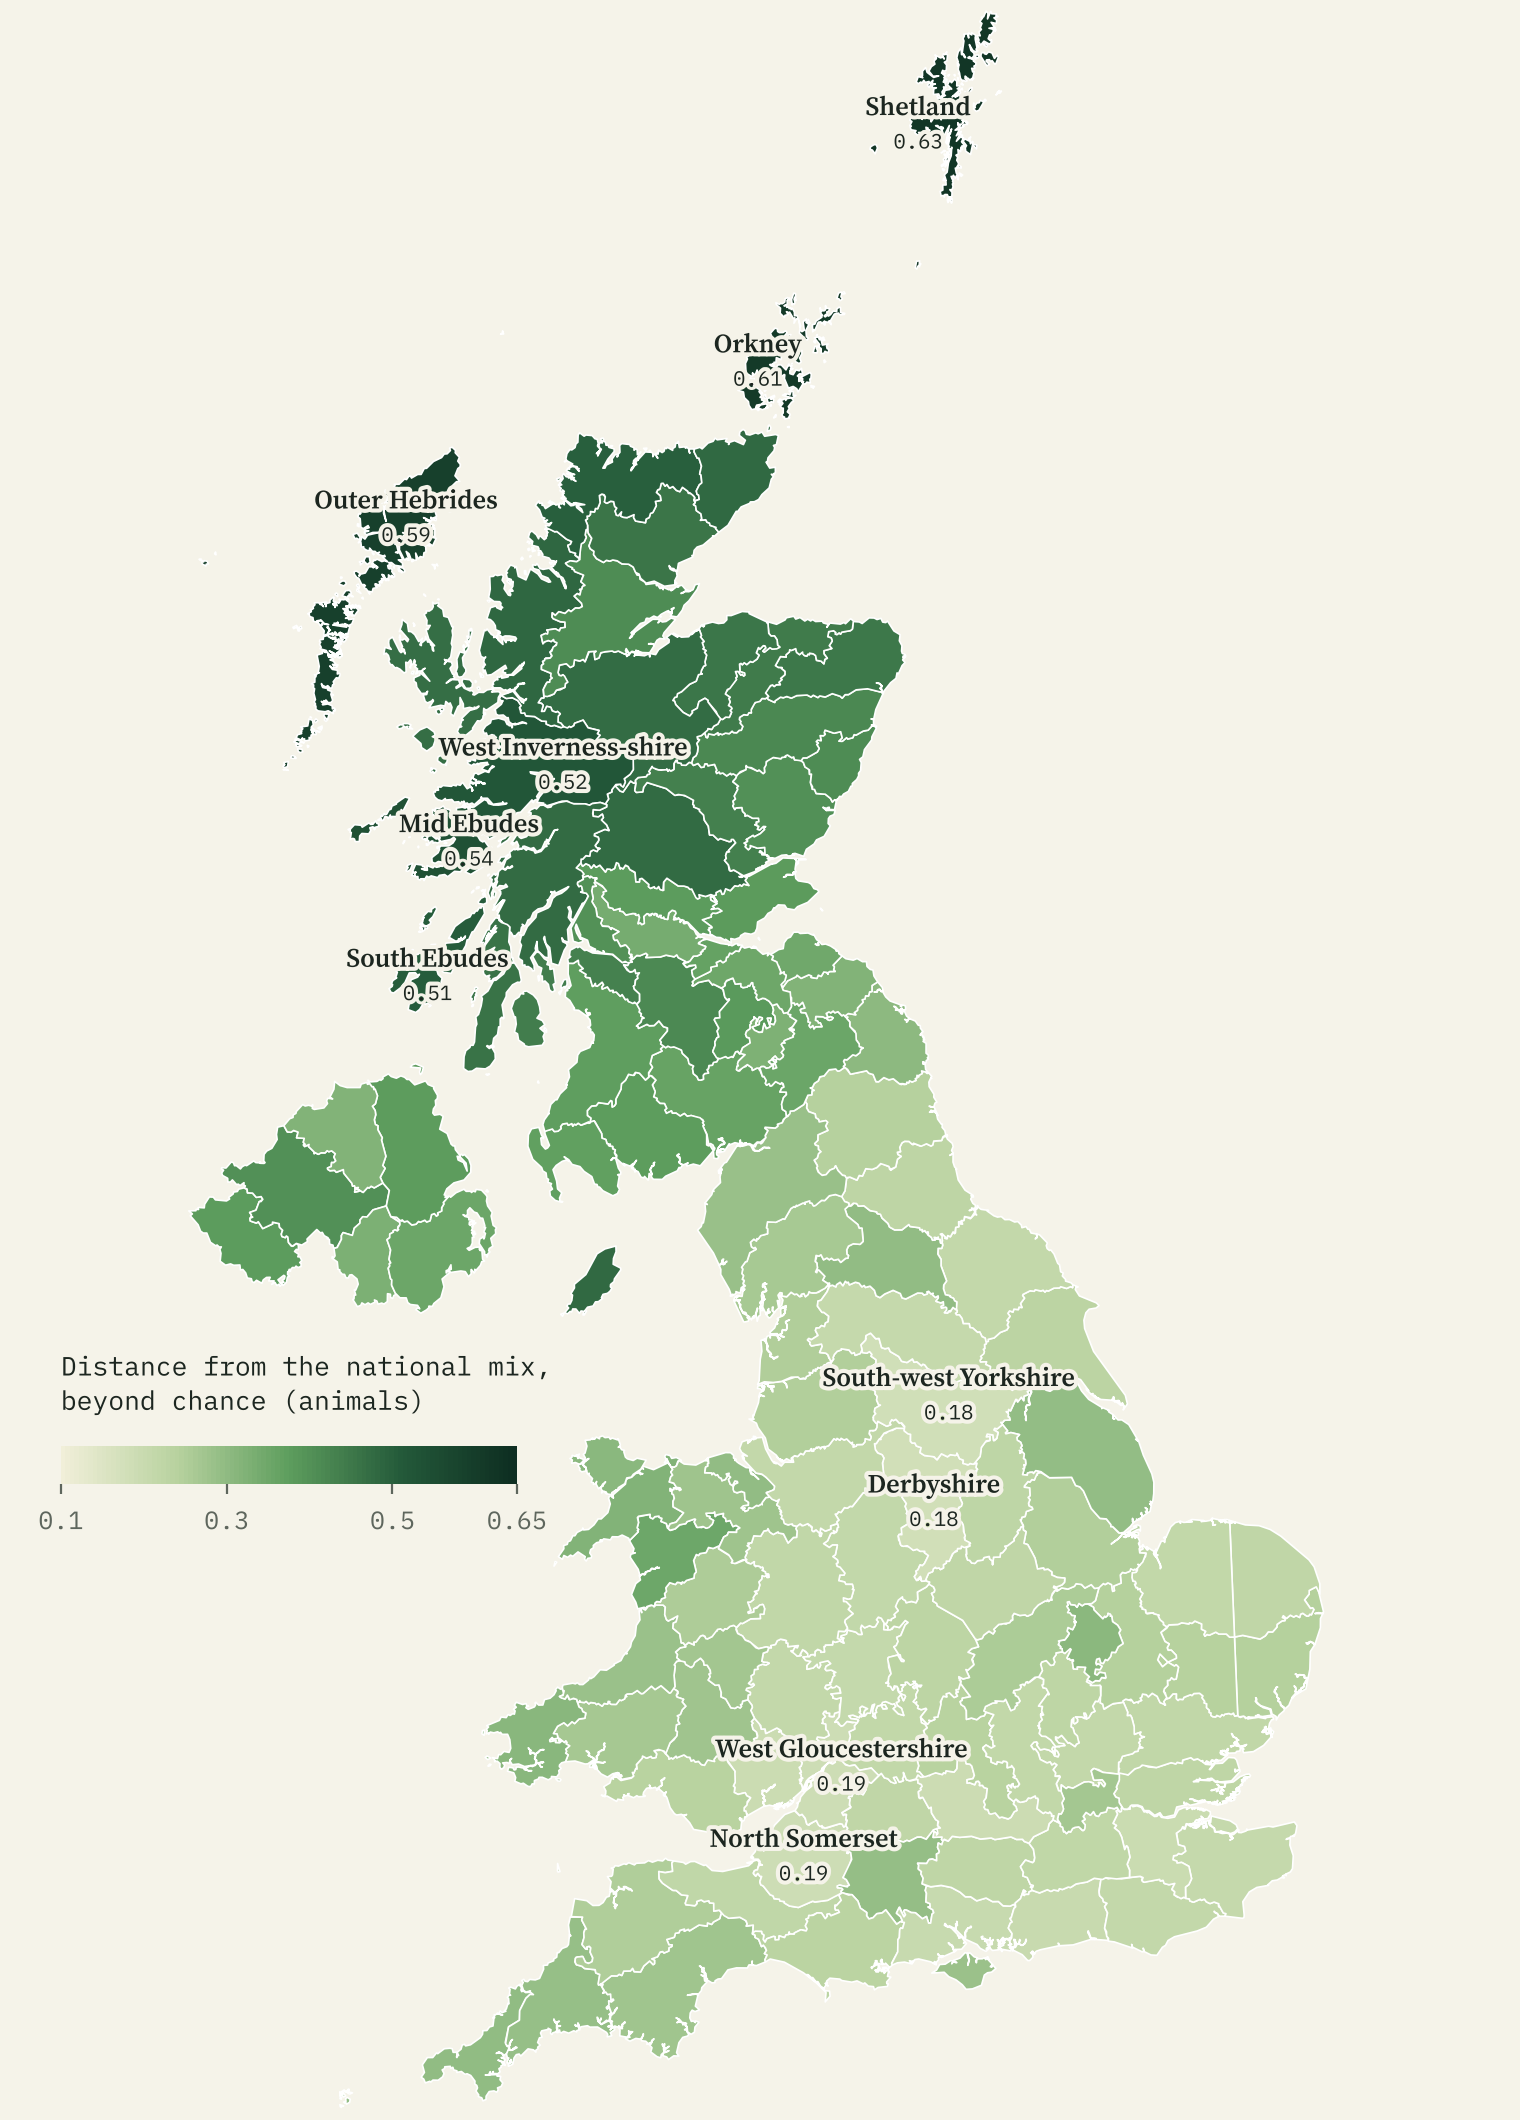
I also measured how different each county’s whole list is from the national mix, after taking away the difference a random sample of the same size would show by chance. Shetland, Orkney and the Outer Hebrides are the most distinctive; Derbyshire and South-west Yorkshire the most ordinary. On average Scotland’s counties score 0.44 on this measure and England’s 0.23.
Newcomers on the move
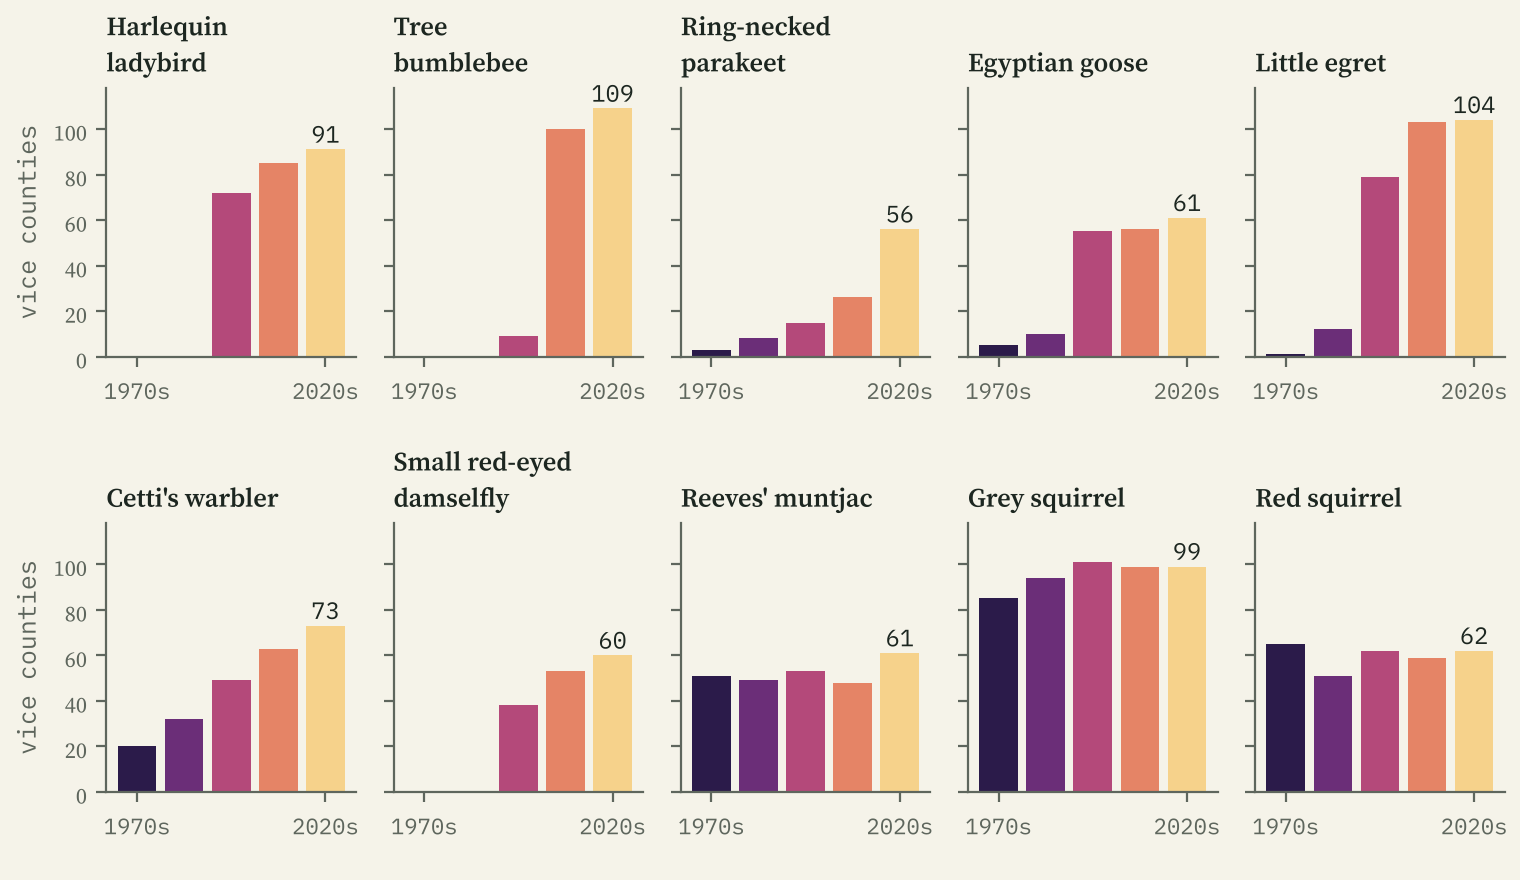
The same records catch species arriving. The harlequin ladybird, first found in Britain in 2004, had records in 72 vice counties in 2000 to 2009 and 91 since 2020. The tree bumblebee, which flew in from the continent on its own, went from 9 to 109. The little egret, a rarity before the 1990s, now turns up in 104, and the ring-necked parakeet has spread from 15 counties to 56.
Records are not wildlife
Every record is a moment when someone looked, saw and wrote it down, so a map of records is partly a map of recorders. The busiest counties are around London; the quietest are in the north west Highlands and Northern Ireland, a 25-fold difference per square kilometre.
The quotients cancel out the overall level of effort, but not a big survey of one species, a rare bird that drew a crowd, or a scheme that keeps its data under a non-commercial licence. Treat a signature as “recorded unusually often here”, not as a census. The interactive map lets you check: tap a county to see its top species in each group, the datasets behind it, and the species recorded nowhere else.
How I did this
I queried the NBN Atlas web service for counts only, never individual records, so nothing here pinpoints a sensitive species. I kept records under CC0, CC BY and the Open Government Licence (65,088,580 in all) and left out CC BY NC data. A species needed at least 20 records in a county and 200 nationally to be ranked, a group needed 1,000 records in a county (150 for mammals, amphibians and reptiles, and dragonflies), and I ranked by a cautious version of the quotient that discounts small counts. Vice county boundaries come from the Biological Records Centre and, for Northern Ireland, OpenStreetMap.
Notes and sources
- Records: NBN Atlas, occurrence web services, retrieved 29 October 2026; only records licensed CC0, CC BY 4.0 or OGL v3, with thanks to all data providers.
- Boundaries: Biological Records Centre, Watsonian vice counties (GPL 3.0); Irish vice counties from OpenStreetMap contributors (ODbL).
- Place names on the map: GeoNames (CC BY 4.0).
- Paper, data and code: Zenodo and GitHub.
- I wrote the text, with drafting and editing assistance from Claude (Anthropic), which also helped prepare the analysis code. I reviewed and checked all text and results.

