
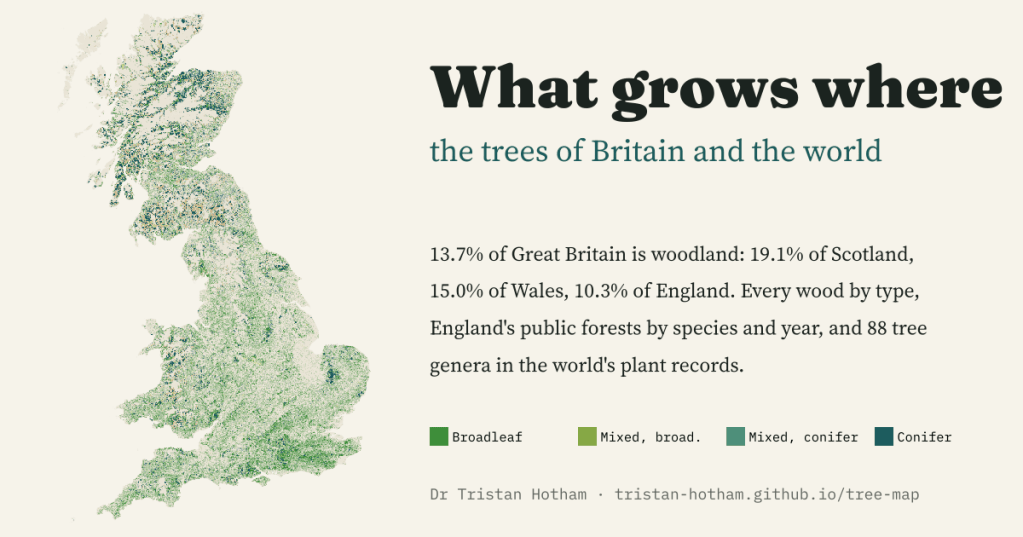
Is there a map of tree types across Britain, and the world, that you can simply explore? Not easily, so I made one: every wood in Great Britain by type, England’s public forests by species and planting year, and 88 tree genera in the world’s plant records.
Someone asked me a simple question: is there a map of which trees grow where in the UK, and in the world, that you can just look at? The pieces exist, but they are scattered. The Forestry Commission maps every wood of half a hectare or more in Great Britain, the National Forest Inventory. Forestry England publishes the species and planting year of every compartment in England’s public forests. GBIF, the global archive of biodiversity records, will tell you where any tree has been recorded. None of them, on its own, answers the question.
So I put them on one map, with two views, Great Britain and the world, and a set of layers so you can always see where you are. Here is what it shows.
One seventh of Britain is woodland
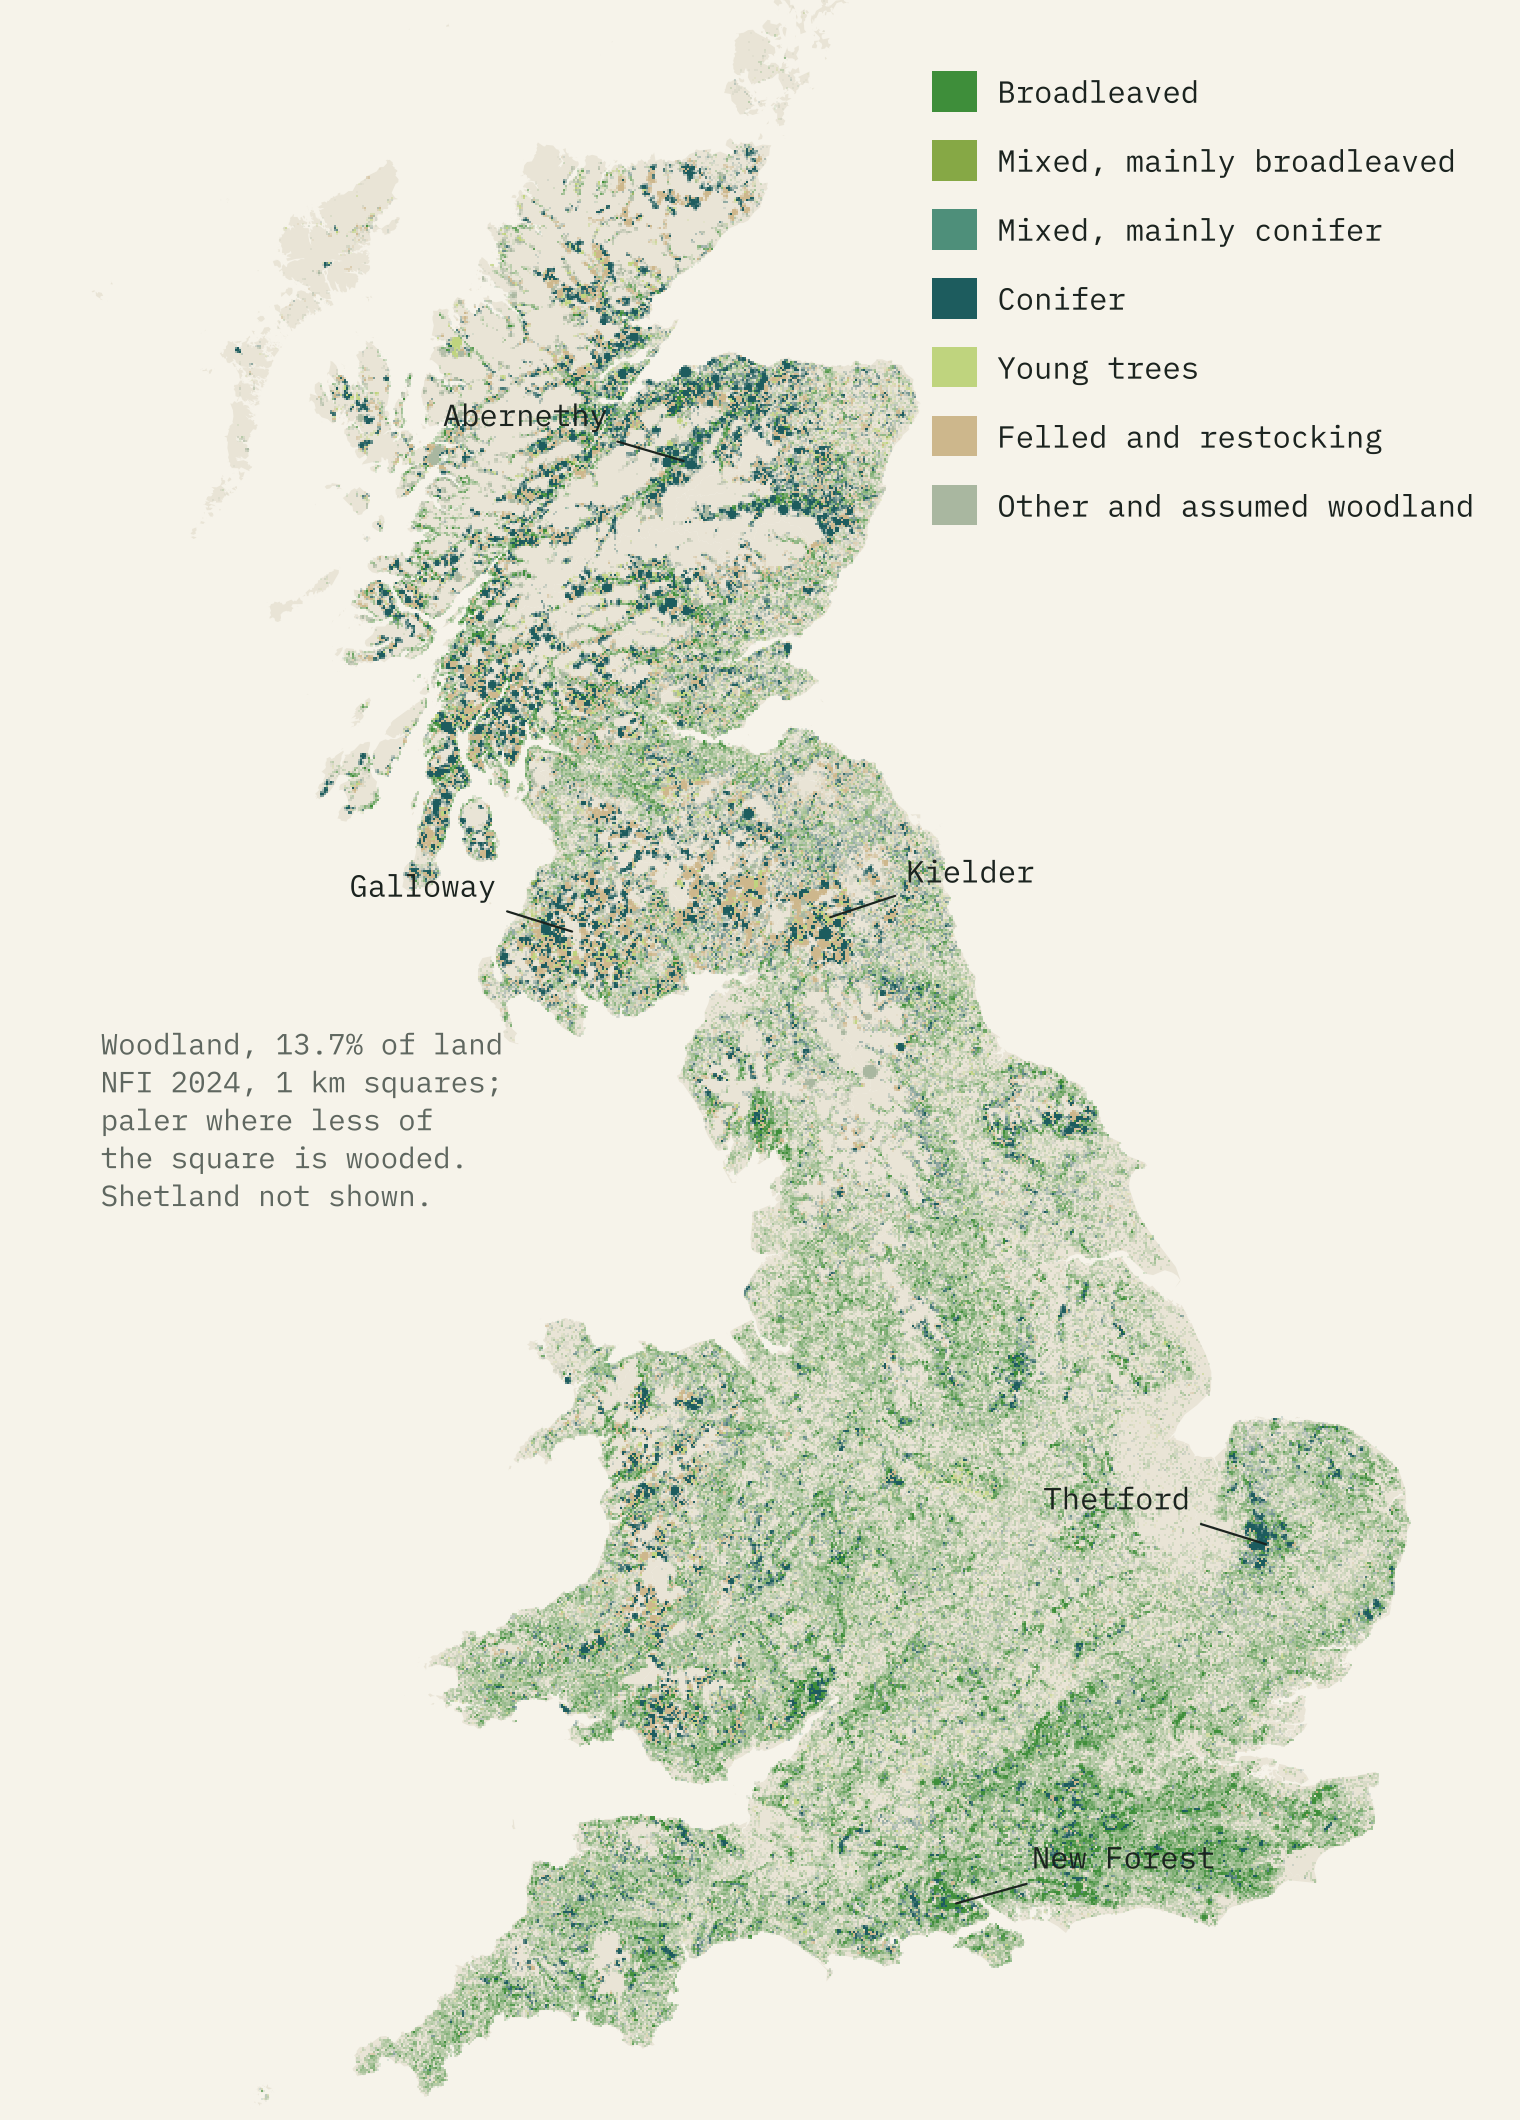
The 2024 National Forest Inventory map has 641,642 polygons. The woodland ones cover 3,153 thousand hectares, 13.7% of Great Britain’s land. That average hides three very different countries: 19.1% of Scotland is woodland, 15.0% of Wales and 10.3% of England.
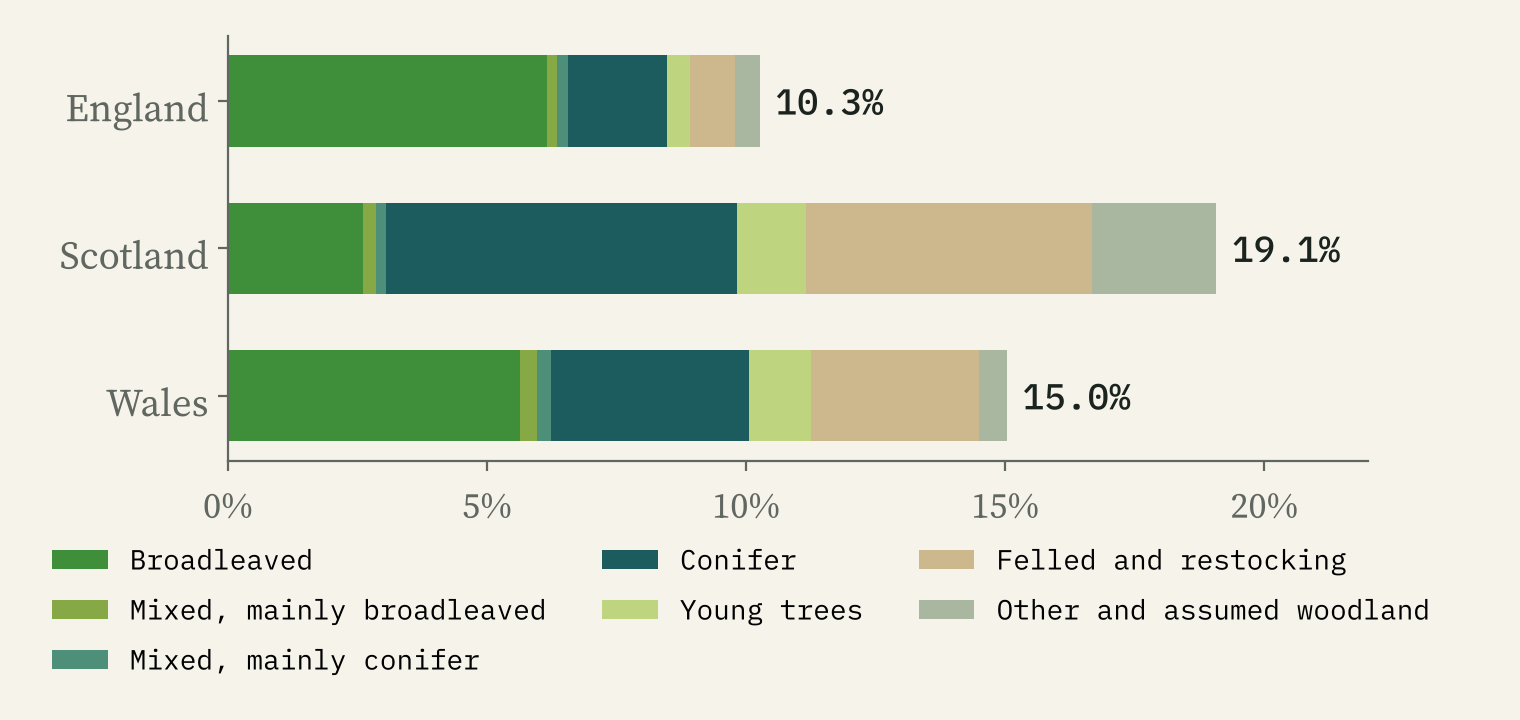
The mix differs even more than the amount. Of Scotland’s broadleaf and conifer woodland, 71% is conifer. In England it is 25%, and in Wales 41%. About a fifth of all the woodland, 19%, was mapped as felled or being prepared for replanting, most of it in Scotland. That is the plantation cycle: conifers are clear-felled and replanted, and young trees take a few years to show from the air.
Moray, Kielder and the bare islands
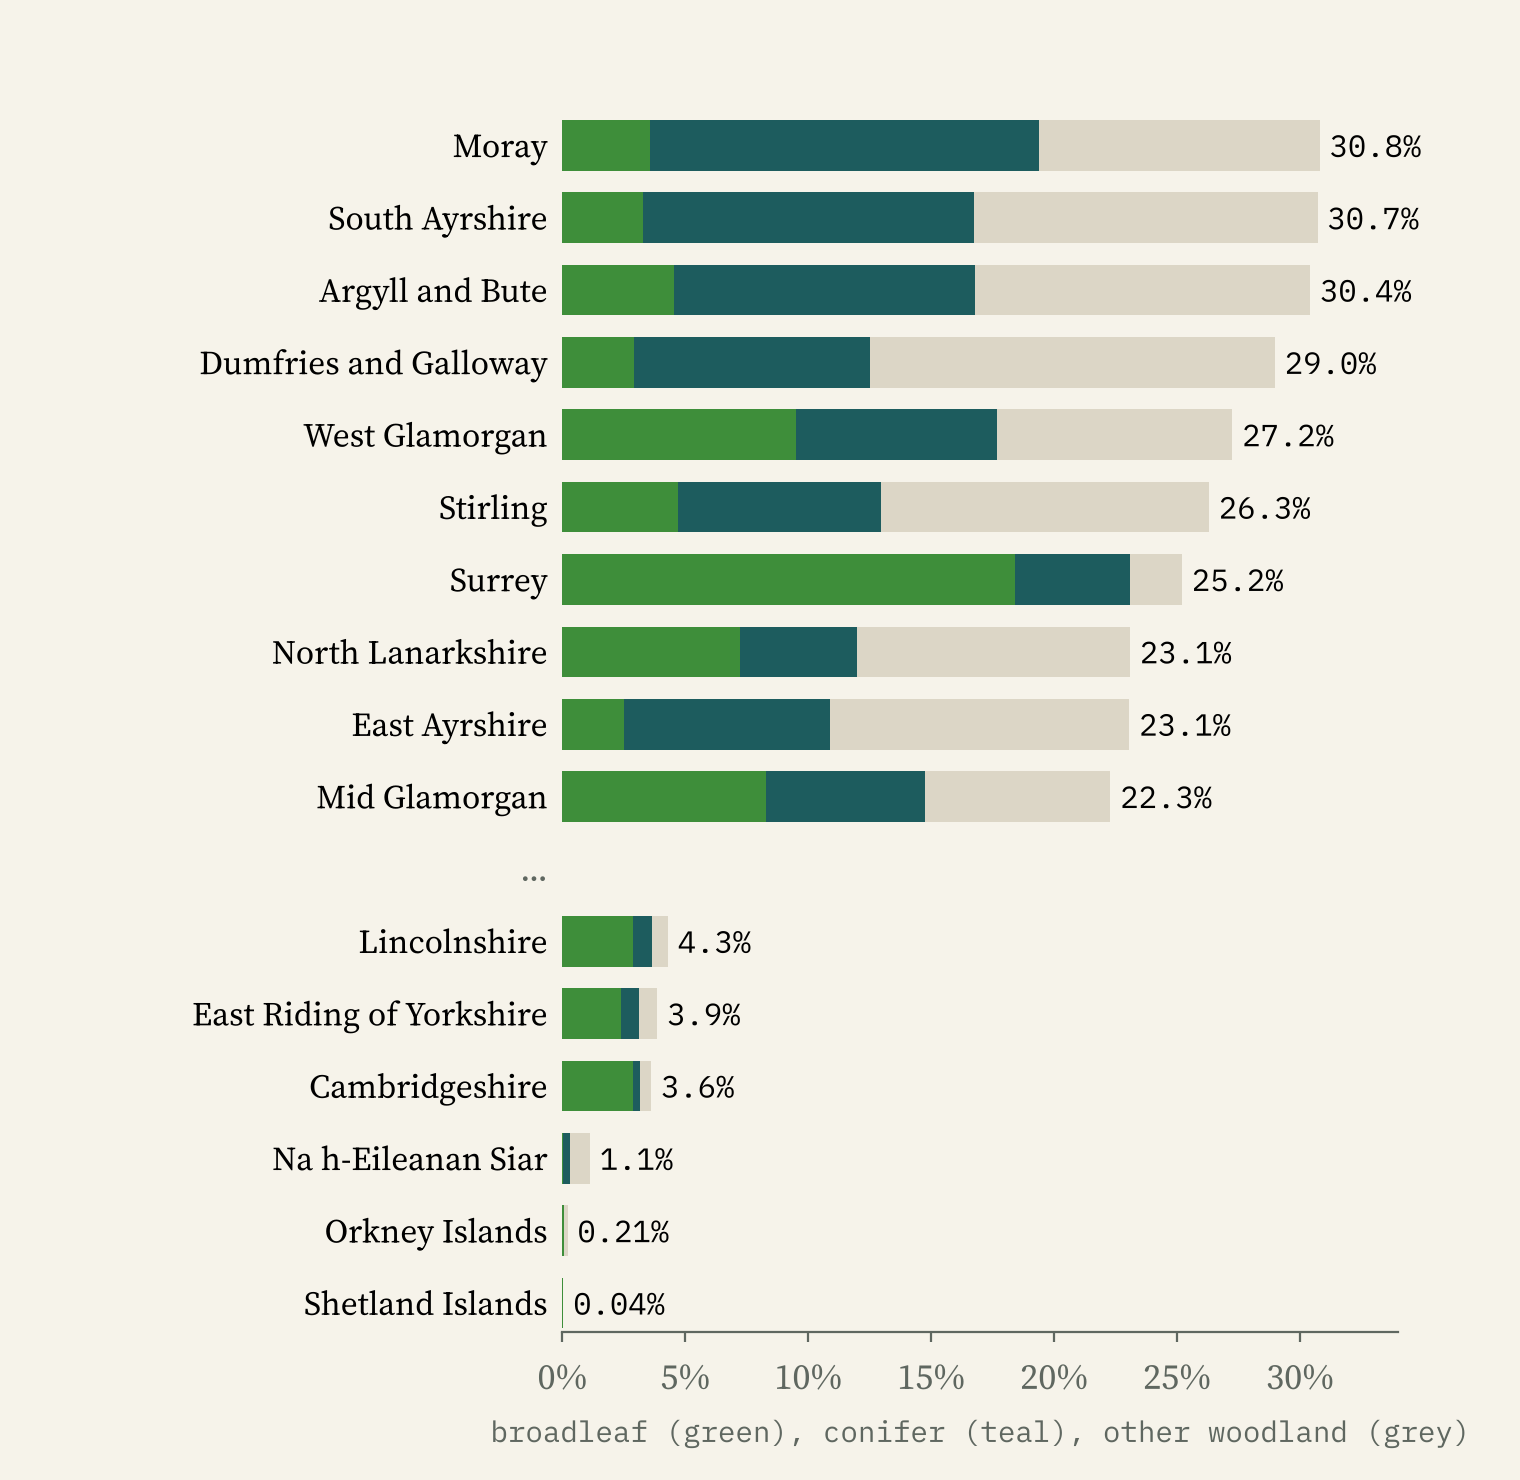
Moray is the most wooded county or council area in Britain, at 30.8%, with South Ayrshire, Argyll and Bute, and Dumfries and Galloway close behind. All four are mostly conifer. England’s most wooded county is Surrey, at 25.2%, and its woods are mainly broadleaved. At the bottom are the islands: Shetland has 0.04% woodland and Orkney 0.21%. In England, Cambridgeshire is barest at 3.6%.
The great plantations jump out of the map. The single most wooded 10 km square in Britain is NY68, in Kielder Forest: 81% woodland, 98% of it conifer. Within 10 km of the heart of Kielder, 63% of the land is woodland. Galloway around Glentrool and the Breckland around Thetford have the other two biggest blocks of conifer.
What the records say: pine by the Spey
The Forest Inventory says what kind of wood is where, but not which trees. For that I used GBIF, which gathers records of plants from herbarium sheets, surveys and phone apps. Counting records would just map where botanists live, so I map each tree as a share of all plant records in each cell, and fade cells with few records.
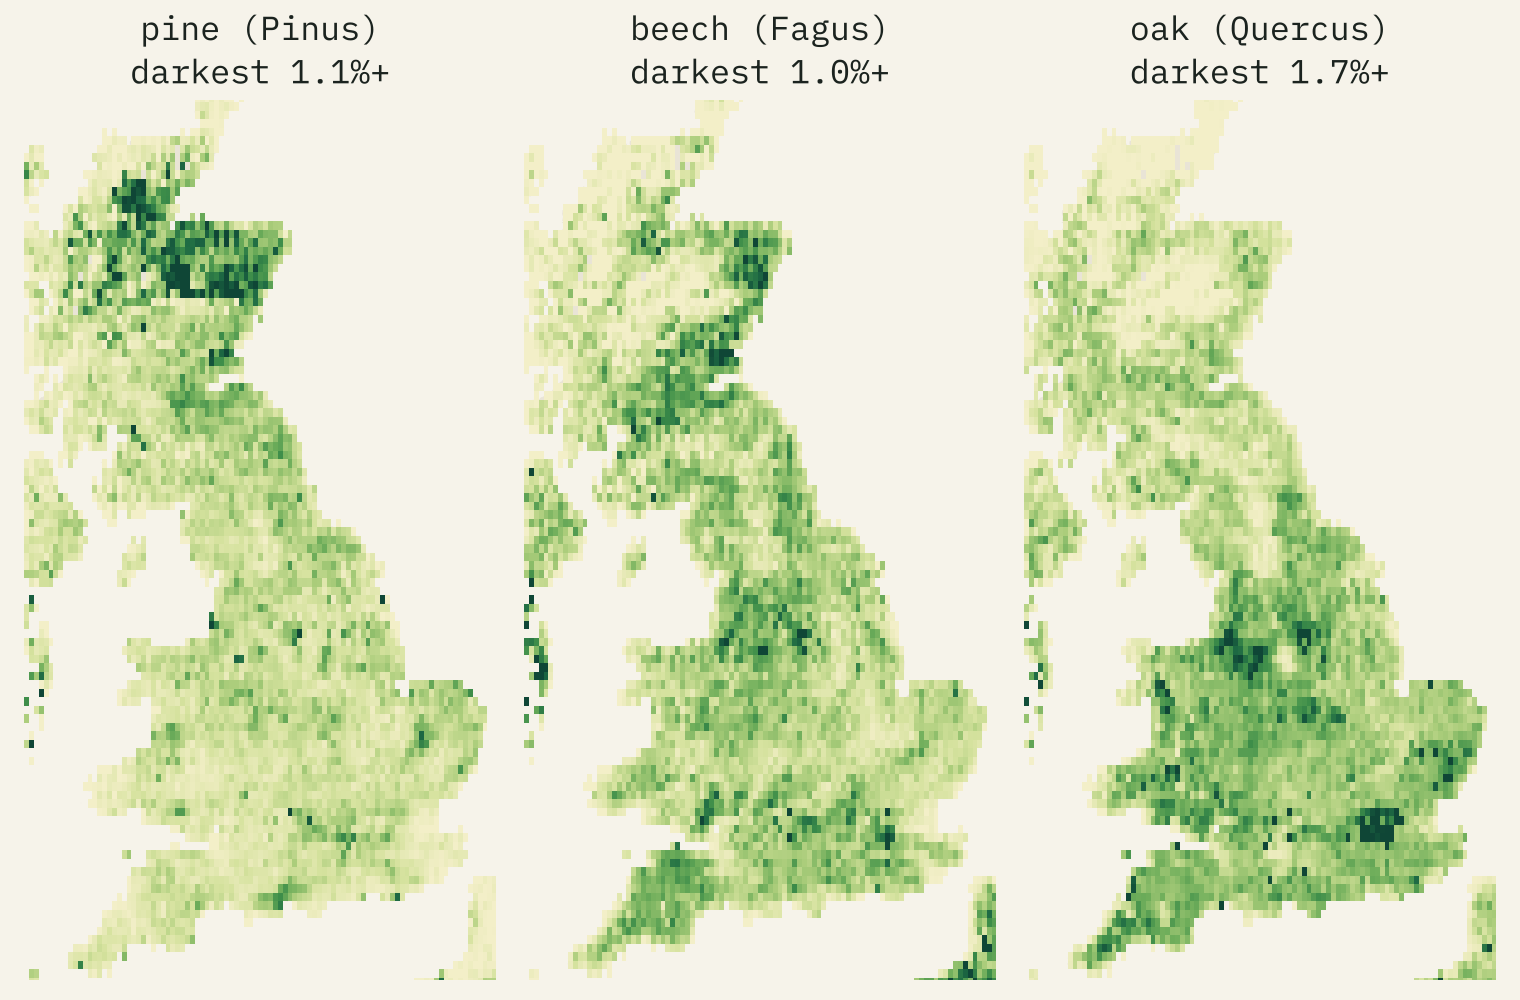
The patterns are ones a naturalist would recognise. Pines take their biggest share of records in Strathspey and the northern Cairngorms, 7.5% of all plant records in one cell: the country of Abernethy and Rothiemurchus, the largest remnants of the native Caledonian pinewood. Juniper, a pinewood shrub, peaks in the next cell. Beech peaks beside Savernake Forest in Wiltshire.
But records are not trees. Willows are the most recorded tree genus in 2,863 of 4,089 well recorded British cells, because there are many willow species and botanists record them carefully. Near Bala, spruce makes up 28% of all plant records, which looks like one big survey rather than a forest unlike any other.
What was planted when
Forestry England’s 73,109 compartments give the species and the year the current trees were planted. Of the area with a species, 67% is conifer. Sitka spruce alone is 26%, then Corsican pine and Scots pine; oak is the biggest broadleaf, at 9%.
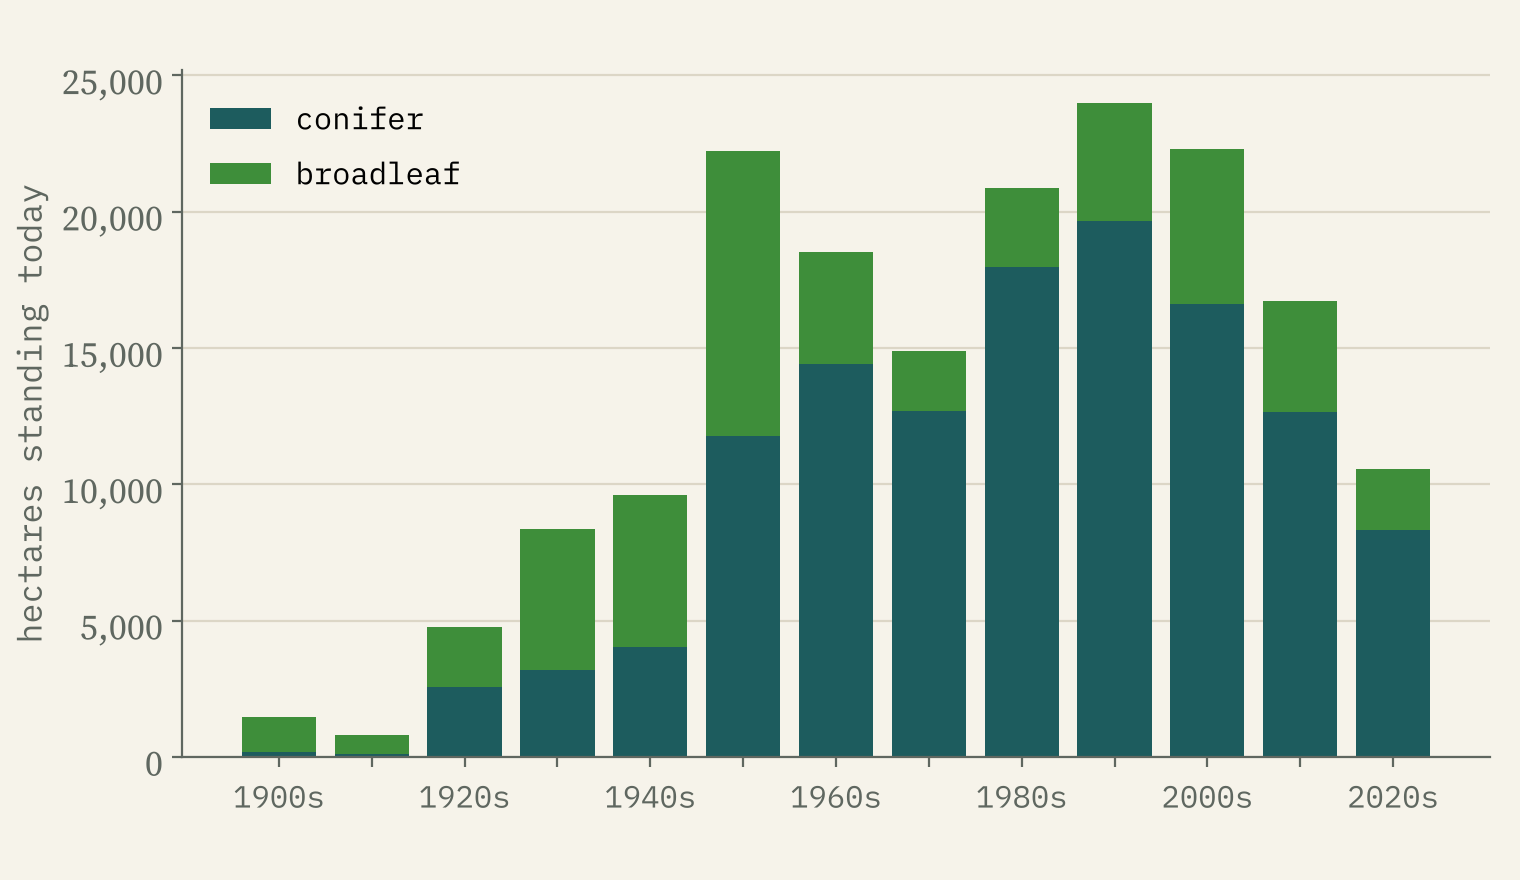
This is not the history of planting, because a compartment that is felled and replanted takes the new date. So the trees standing today were mostly planted after 1950, and conifer planting peaks in the 1990s, the second rotation of the post-war plantations. What does show is a change in choice: broadleaves are 47% of the surviving 1950s planting, 18% of the 1990s and 26% of the 2000s.
The world: acacias, figs and eucalypts
For the world I fetched GBIF’s grids for 88 tree genera, from oaks and pines to baobabs and mangroves. Ask which genus is most recorded in each place and a few big ones win almost everywhere: figs, willows and oaks. So the map asks a fairer question: which genus is most typical of each place, recorded far more often there than across the world as a whole?
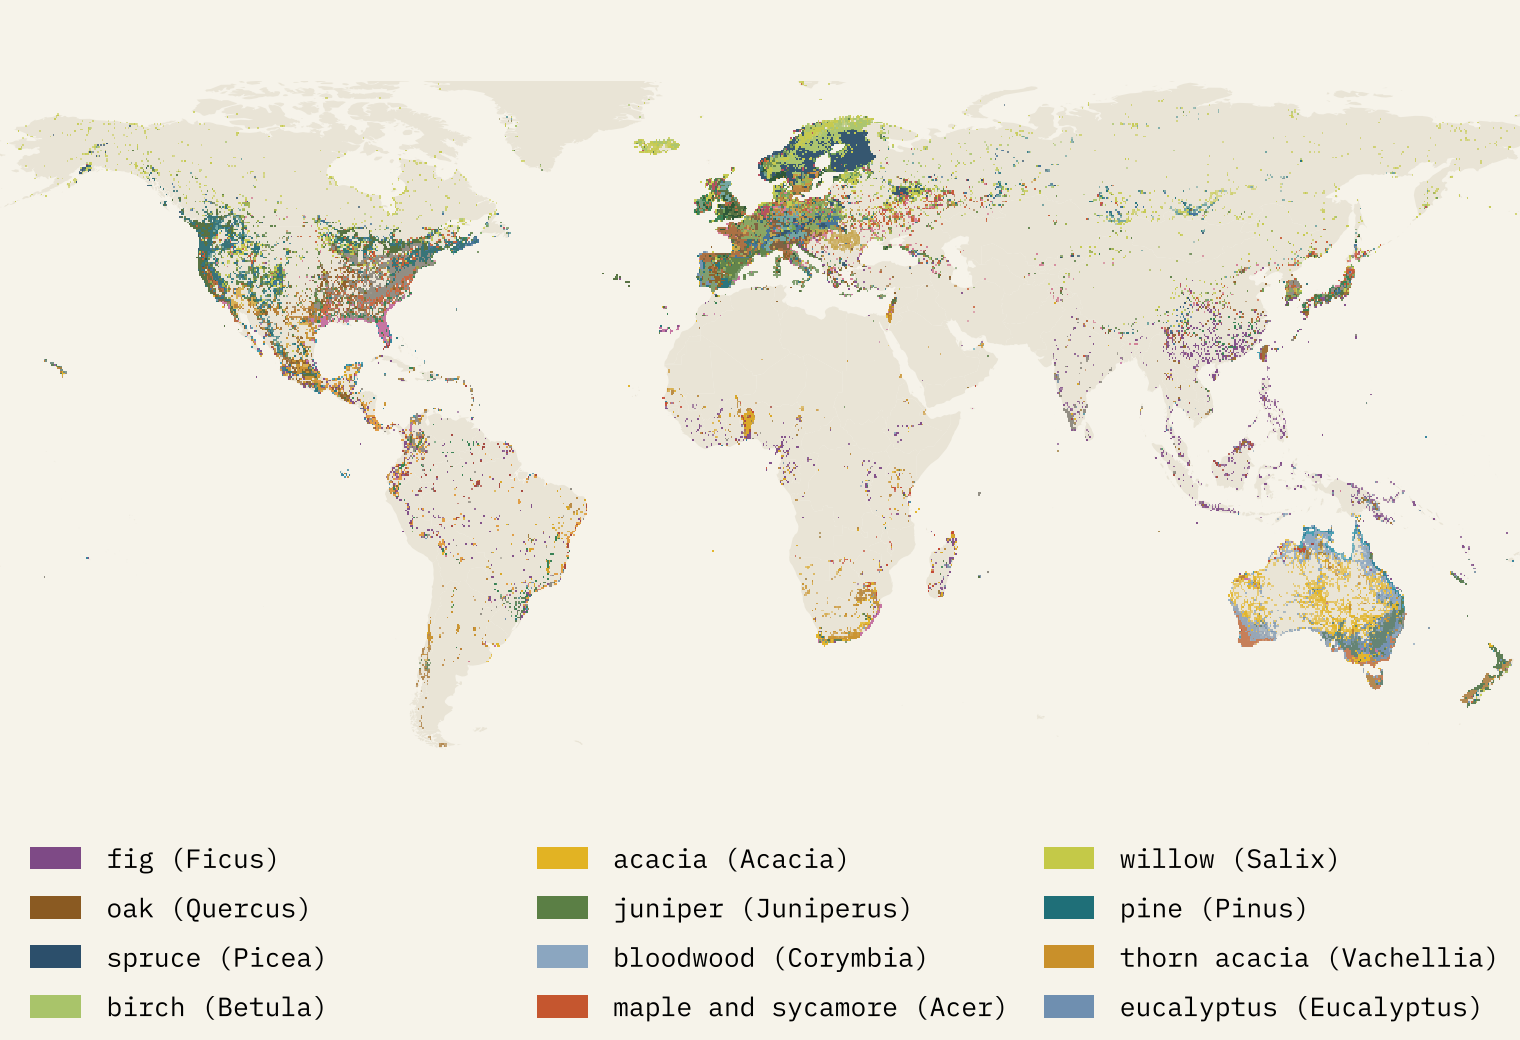
Then the continents come alive. Oceania is acacias, bloodwoods and eucalypts; Africa figs, thorn acacias and bushwillows; South America the ice-cream bean trees of the genus Inga; Europe willows, spruces and birches; North America oaks, willows, pines and junipers. Eucalypts are the most recorded of these genera in 38% of Australia, and oaks in 62% of Spain.
The world map is as much a map of botanists as of trees.
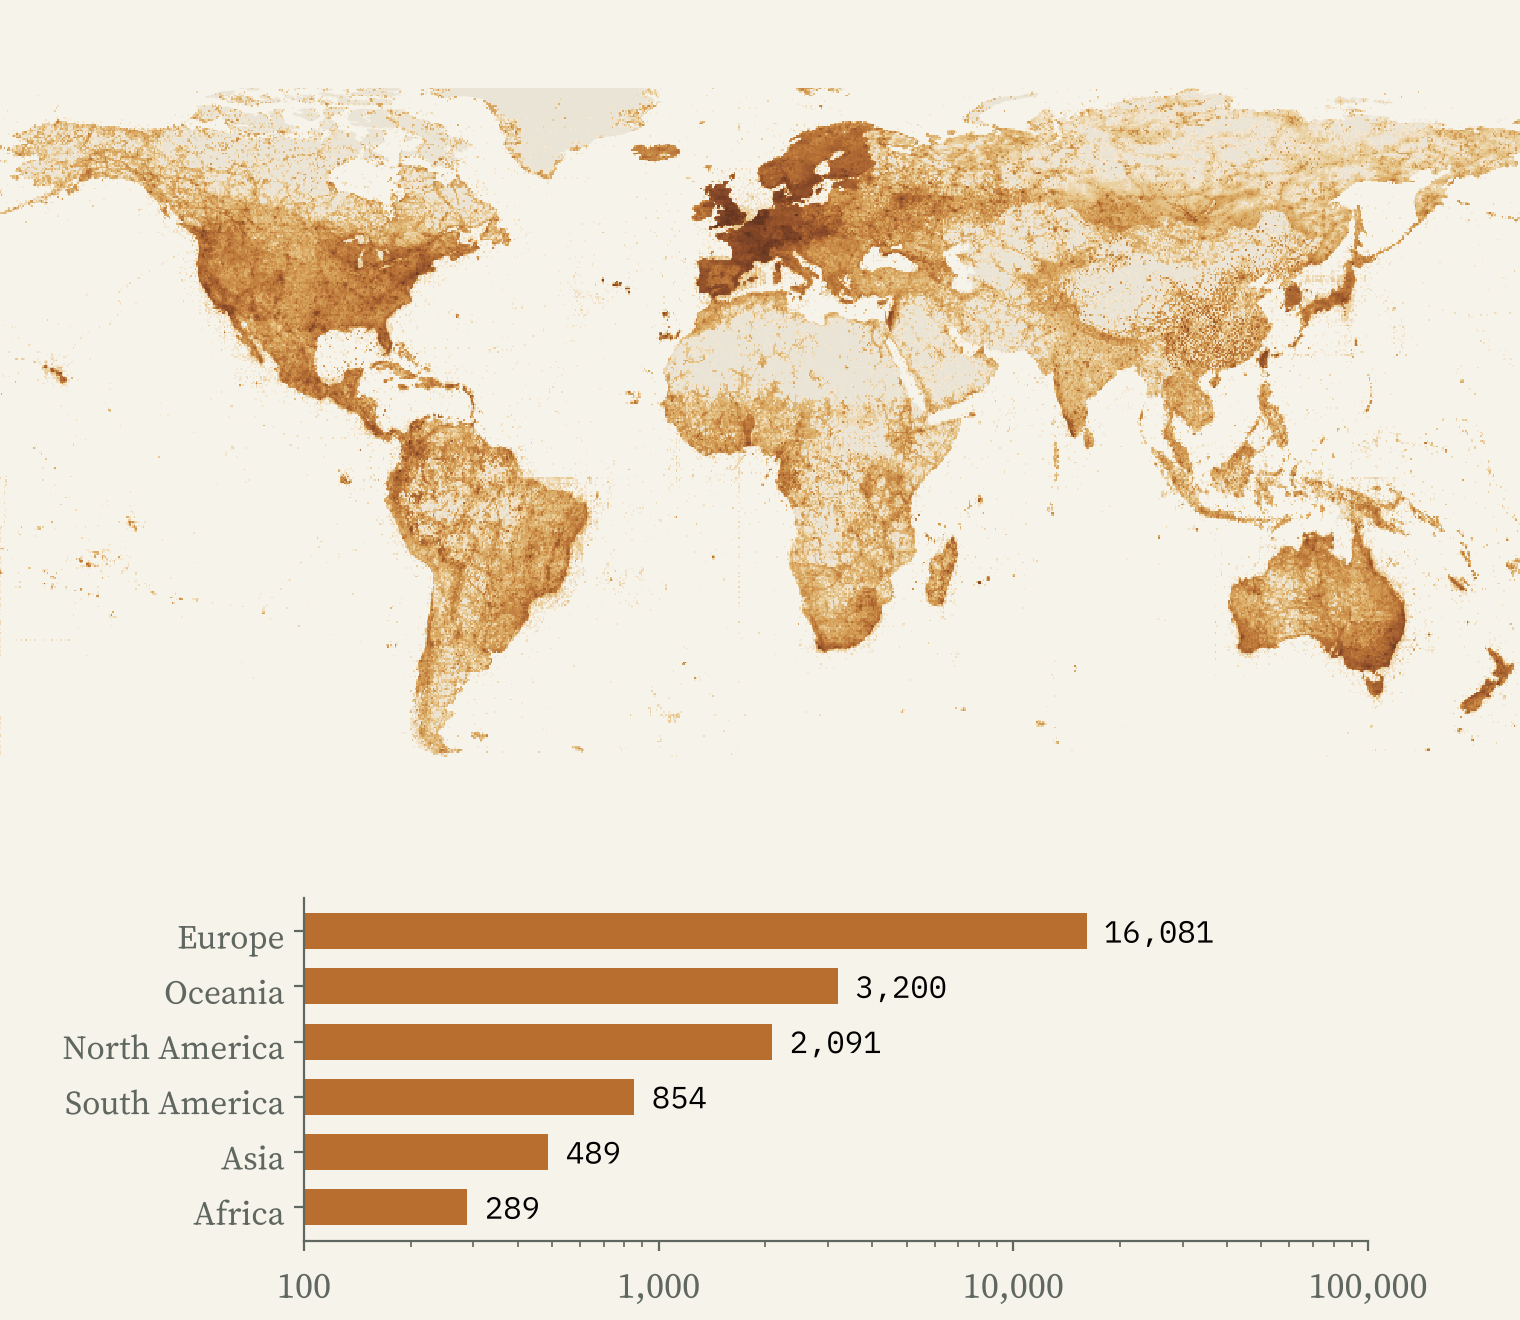
Europe and North America hold 86% of the world’s plant records on land, but only 32% of the land. The tropics are 34% of the land and hold 6.6% of the records. In the heart of the Congo basin only 10% of cells have enough records to show at all. The most forested places on Earth are the emptiest on this map.
How I did this
I used the National Forest Inventory GB 2024 woodland map as polygon centroids with type and area, drawing each polygon as a disc of its own area on a 100 m grid; county and country totals use the exact areas. Forestry England’s subcompartments give species and planting years for the public estate in England. GBIF occurrence density grids at about 0.09 degrees give records of 88 tree genera and of all vascular plants; I map shares of plant records, not counts. The limits matter: the Inventory misses woods under half a hectare and covers Great Britain only, Forestry England is only the public estate, and GBIF counts records, not trees. The paper sets out every step.
Notes and sources
- Woodland: National Forest Inventory Woodland GB 2024 and Forestry England Subcompartments, © Forestry Commission copyright, contains Ordnance Survey data © Crown copyright and database right 2025, Open Government Licence v3.
- Records: GBIF.org (28 October 2026) GBIF occurrence density maps; records from many publishers under CC0, CC BY 4.0 and CC BY-NC 4.0; derived grids shared under CC BY 4.0.
- Boundaries: Office for National Statistics (Open Government Licence v3). Places: OS Open Names and GeoNames (CC BY 4.0). Countries: Natural Earth.
- An earlier project on Britain’s oldest trees: Ancient trees.
- I wrote the text, with drafting and editing assistance from Claude (Anthropic), which also helped prepare the analysis code. I reviewed and checked all text and results.

