
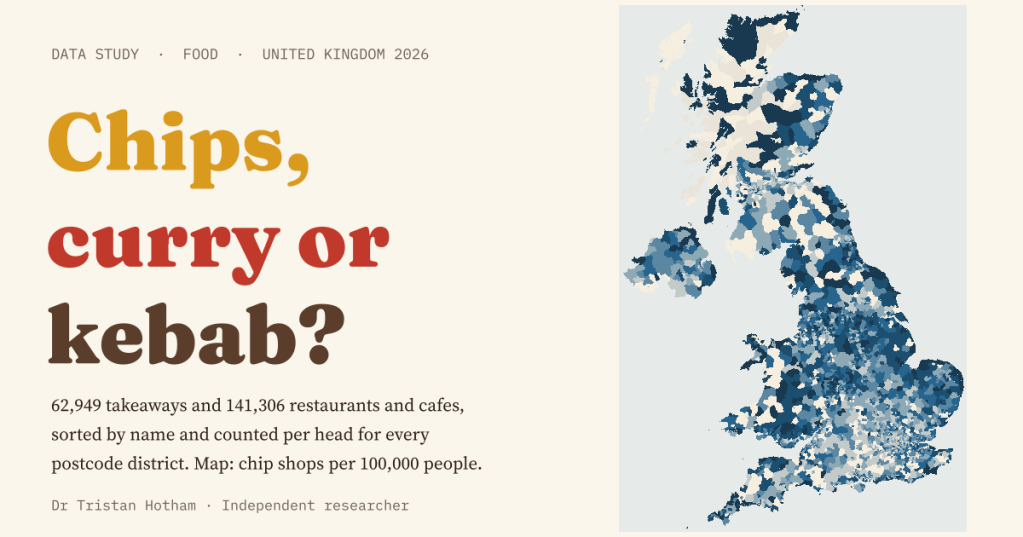
Where is Britain’s chip shop capital? Its curry capital? I sorted every takeaway and restaurant on the UK’s food hygiene register by what its name says it sells, and counted them against the people who live nearby.
Every place in the UK that serves food to the public, from the chippy to the school canteen, is inspected by its council and given a food hygiene rating. The Food Standards Agency publishes the whole register as open data: 614,680 food businesses, each with a name, a kind of business, a postcode and, for most, a point on the map. Among them are 62,949 takeaways and sandwich shops and 141,306 restaurants, cafes and canteens.
The register tells you a place is a takeaway. It does not tell you what it sells. But the names usually do: Jubilee Fish Bar, Simla Tandoori, Happy Garden, Bosphorus Istanbul. So I wrote a set of simple, open rules that read each name and sort it into one of sixteen kinds of food, tested the rules on samples of individually labelled names, and put the results on a map of every postcode district.
Six maps of Britain’s takeaways
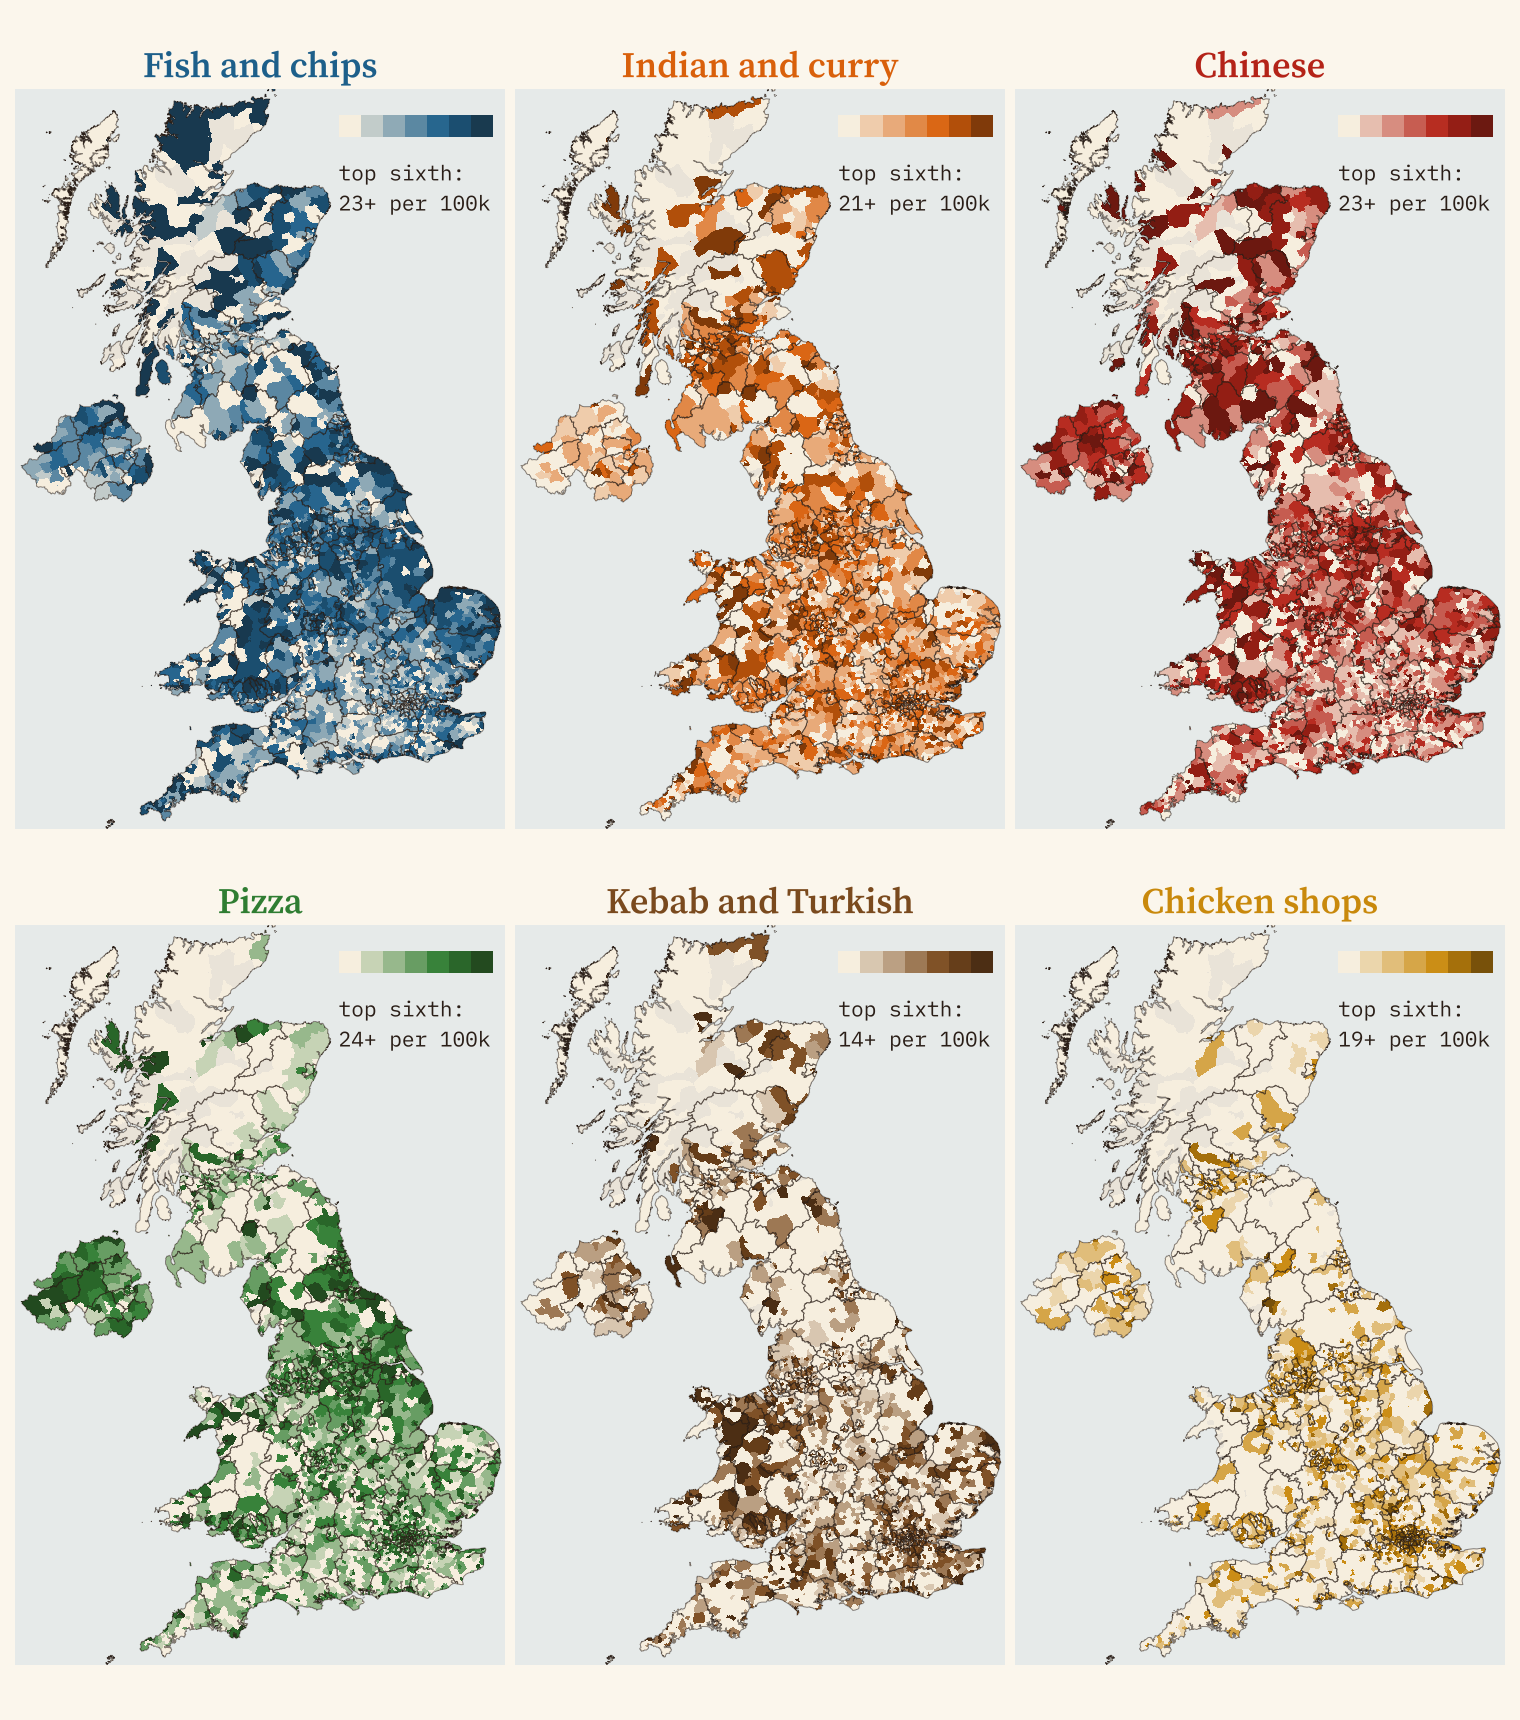
Fish and chips is still the commonest takeaway with a name that says what it sells: 7,358 of them, just ahead of pizza (7,055) and Chinese (6,908). It is the most common named takeaway in 83 of the UK’s 218 counties and unitary authorities. But the six maps are strikingly different. Chinese takeaways are everywhere, and thickest in Scotland, Wales and the north. Kebabs and chicken shops are city foods, and above all London foods.
The chip shop capital is the seaside
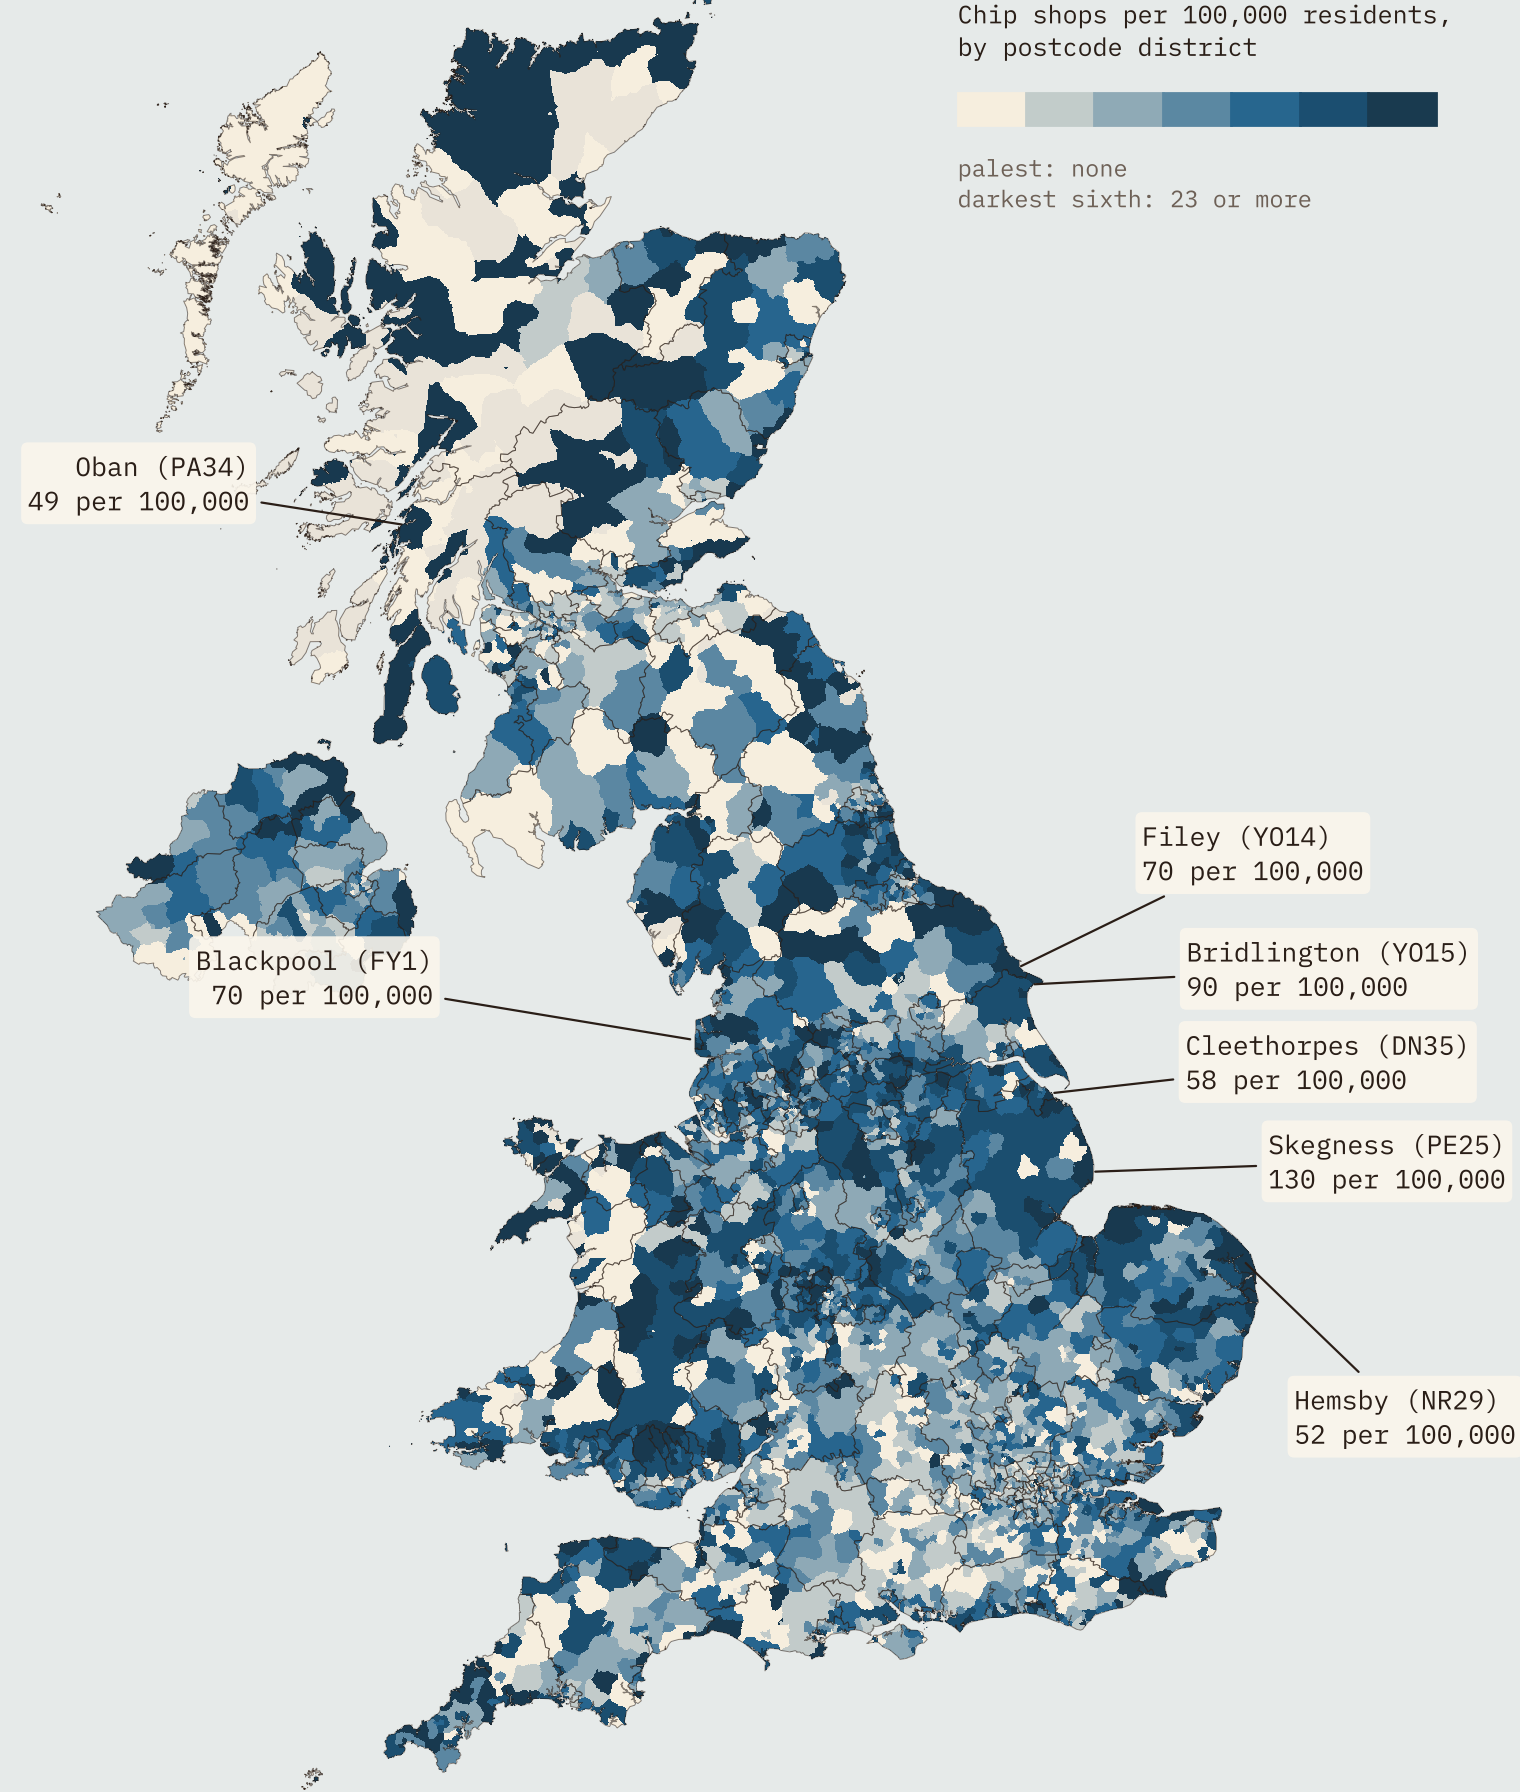
The postcode district with the most chip shops per resident is Skegness, with 129.6 for every 100,000 people, then Bridlington (90.4) and Filey (69.7). These are resorts, and their chippies are feeding visitors as much as locals. Among council areas of 100,000 people or more, Blackpool wins with 34.1 per 100,000, ahead of North East Lincolnshire and Walsall. By nation, Wales has the most chip shops per head.
Curry in Hounslow, Chinatowns still on the map
The curry capital is Hounslow. By postcode it is TW3, in the middle of Hounslow, with 91.9 Indian, Bangladeshi, Pakistani and Nepalese places per 100,000 residents, and Southall’s UB1 (72.9) is close behind. The Chinese map is the most even of the big foods, because Chinese takeaways spread to almost every town after the war. But its peaks are where they always were: Birmingham’s Chinese Quarter (B5), Manchester’s Chinatown (M1) and Liverpool’s (L1) are the three postcode districts with most Chinese places per head.
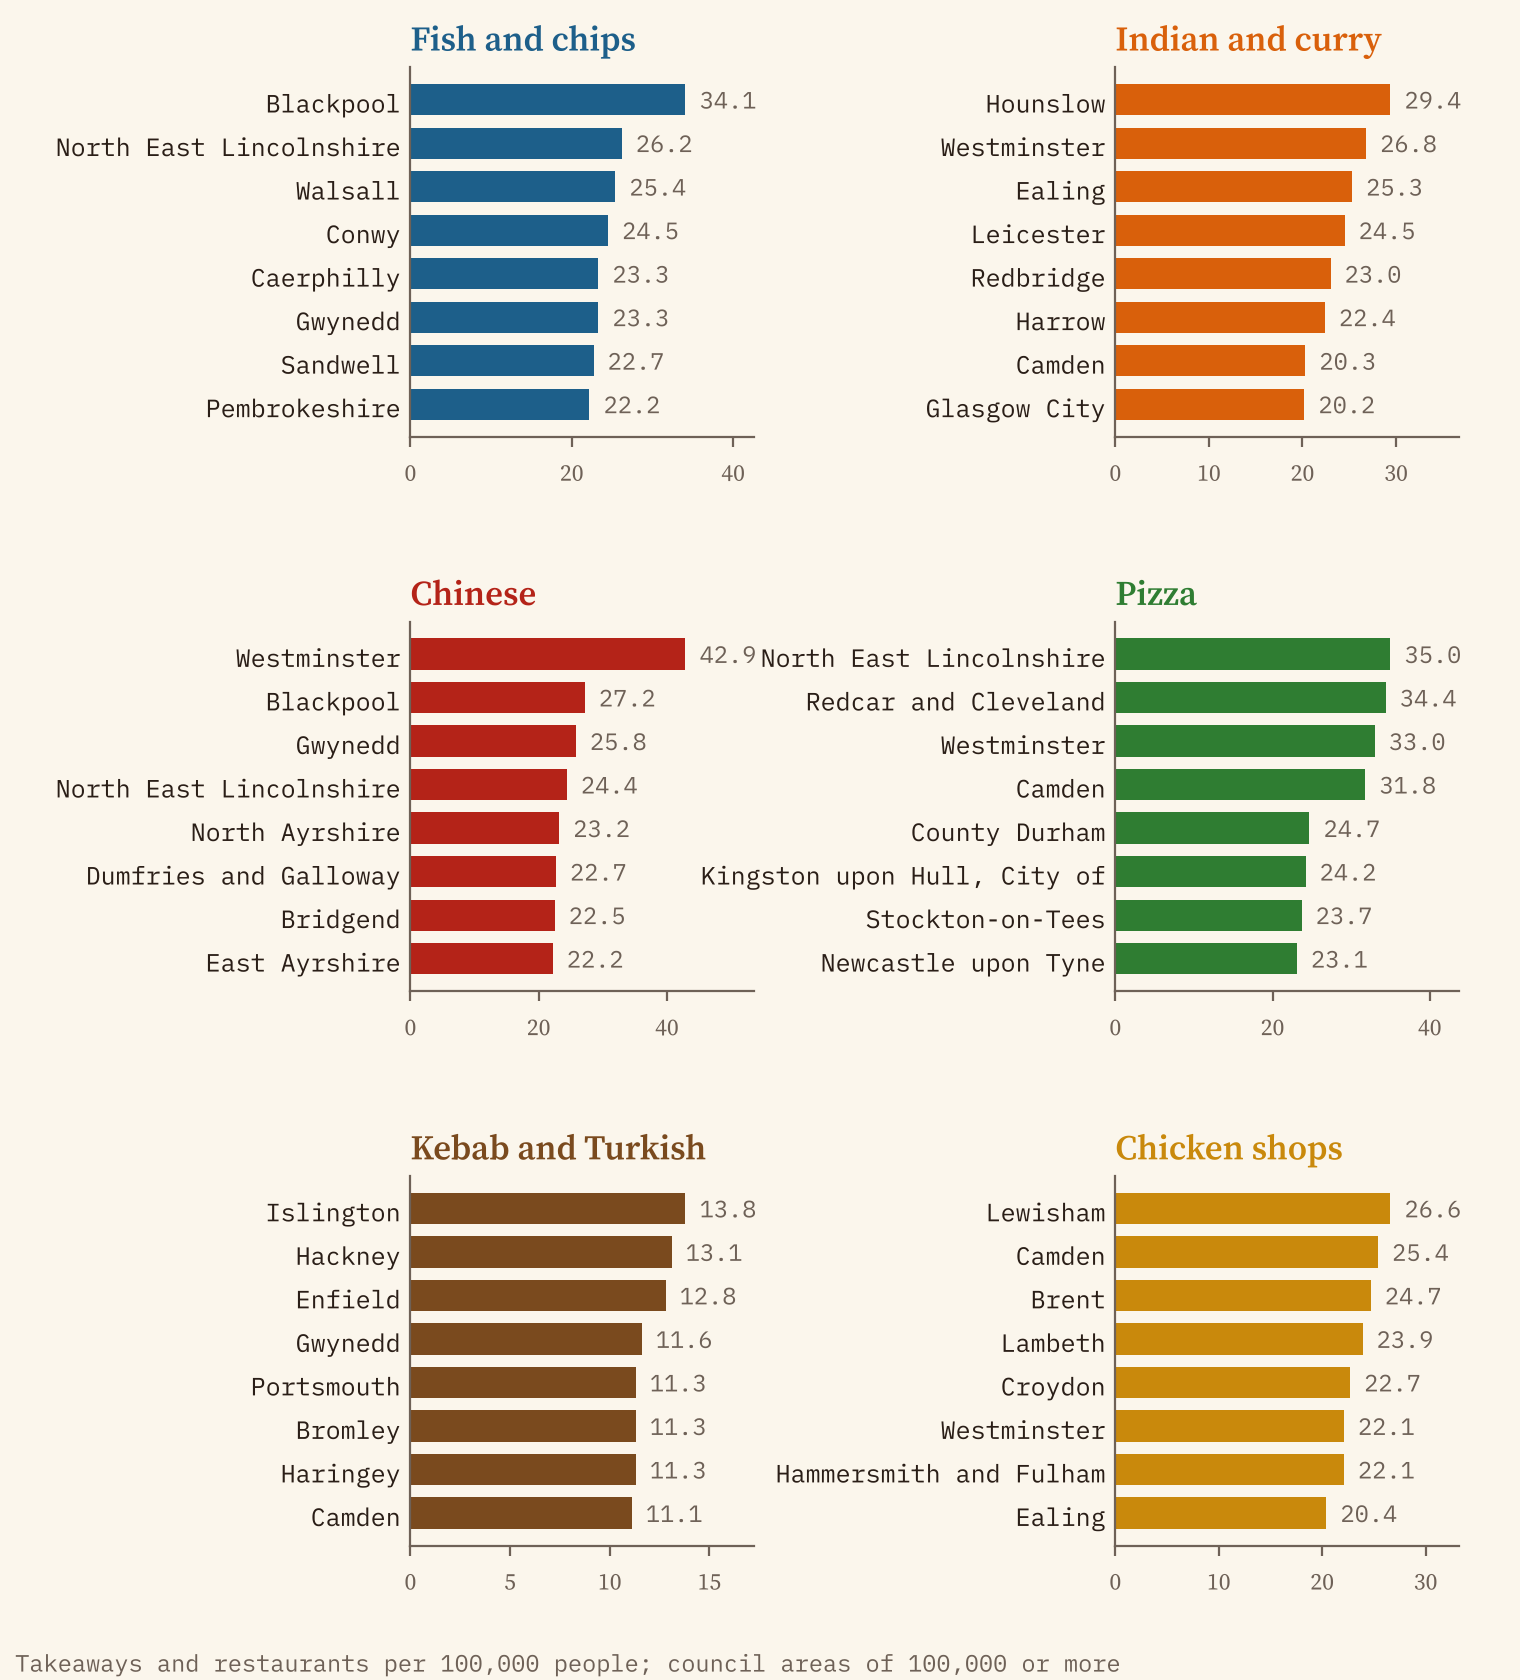
Kebabs are a north London speciality: Islington, Hackney and Enfield top the list, the boroughs of north London’s Turkish and Kurdish high streets. Every one of the top ten council areas for chicken shops is a London borough, led by Lewisham. Pizza is the odd one: it peaks around the Humber and Teesside, in North East Lincolnshire and Redcar and Cleveland.
Four nations, four tastes
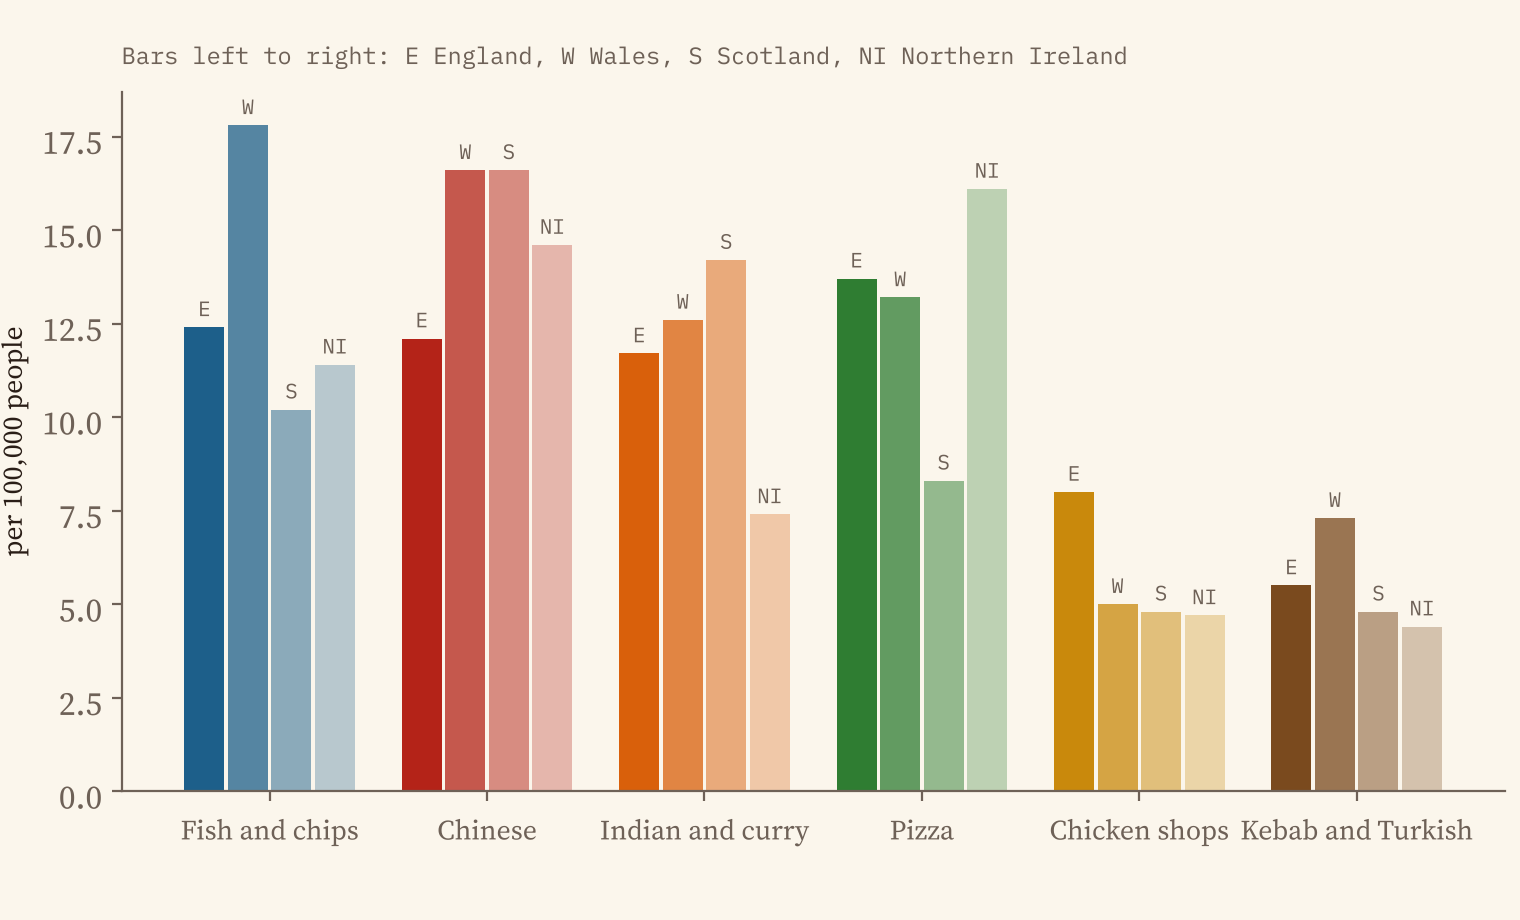
Scotland has the most takeaways per head of the four nations, 112.4 per 100,000 against 88.0 in England, and the most curry houses. Wales leads on chip shops and kebabs. Northern Ireland, which I did not expect, has the most pizza places per head (16.1 per 100,000). England has by far the most chicken shops.
Where takeaways outnumber restaurants
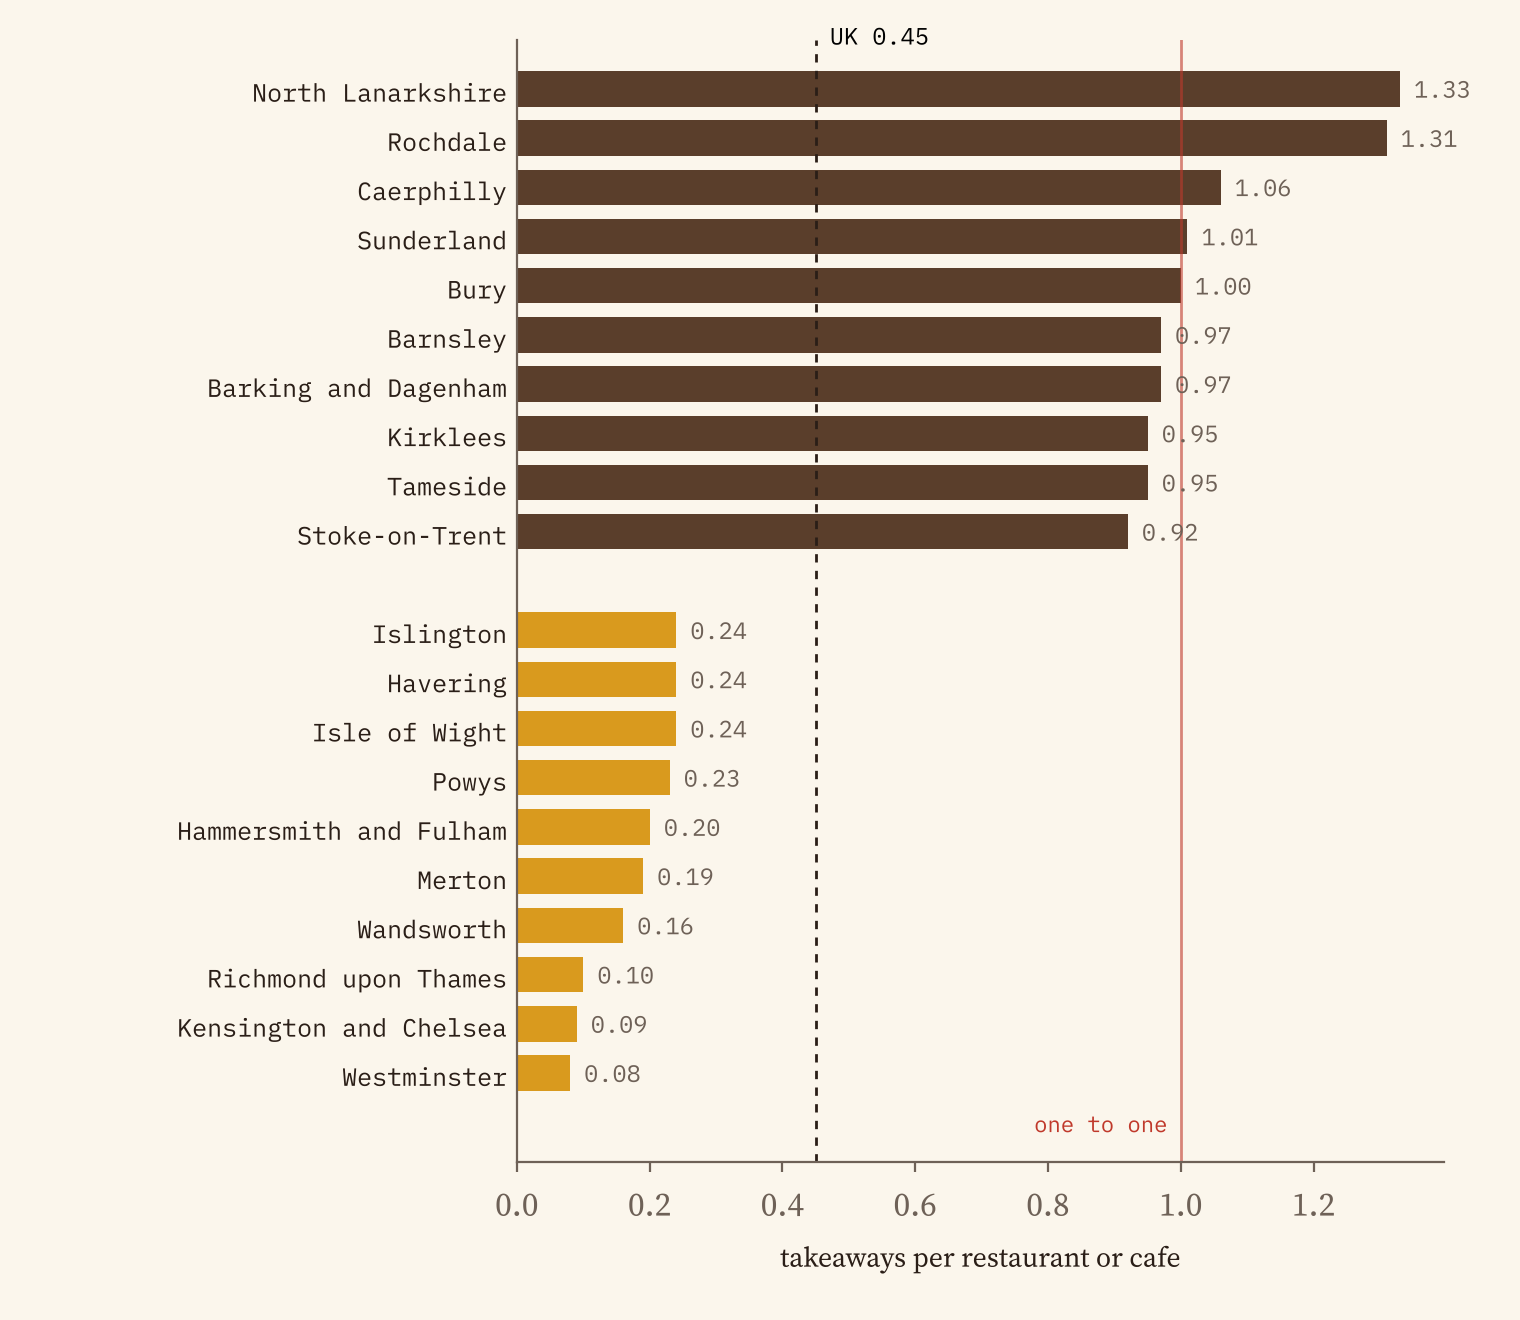
Across the UK there are 0.45 takeaways for every restaurant or cafe on the register. In only 4 council areas of 100,000 people or more are there more takeaways than restaurants: North Lanarkshire, Rochdale, Caerphilly and Sunderland. At the other end, Westminster has 0.08 takeaways per restaurant. One caution: councils decide which places count as takeaways, and they do not all decide alike.
Chains and clean kitchens
Chip shops are the great independent trade: only 48 of 8,651 carry a chain name I could recognise. Burgers are the opposite, with McDonald’s alone 40.4% of burger places.
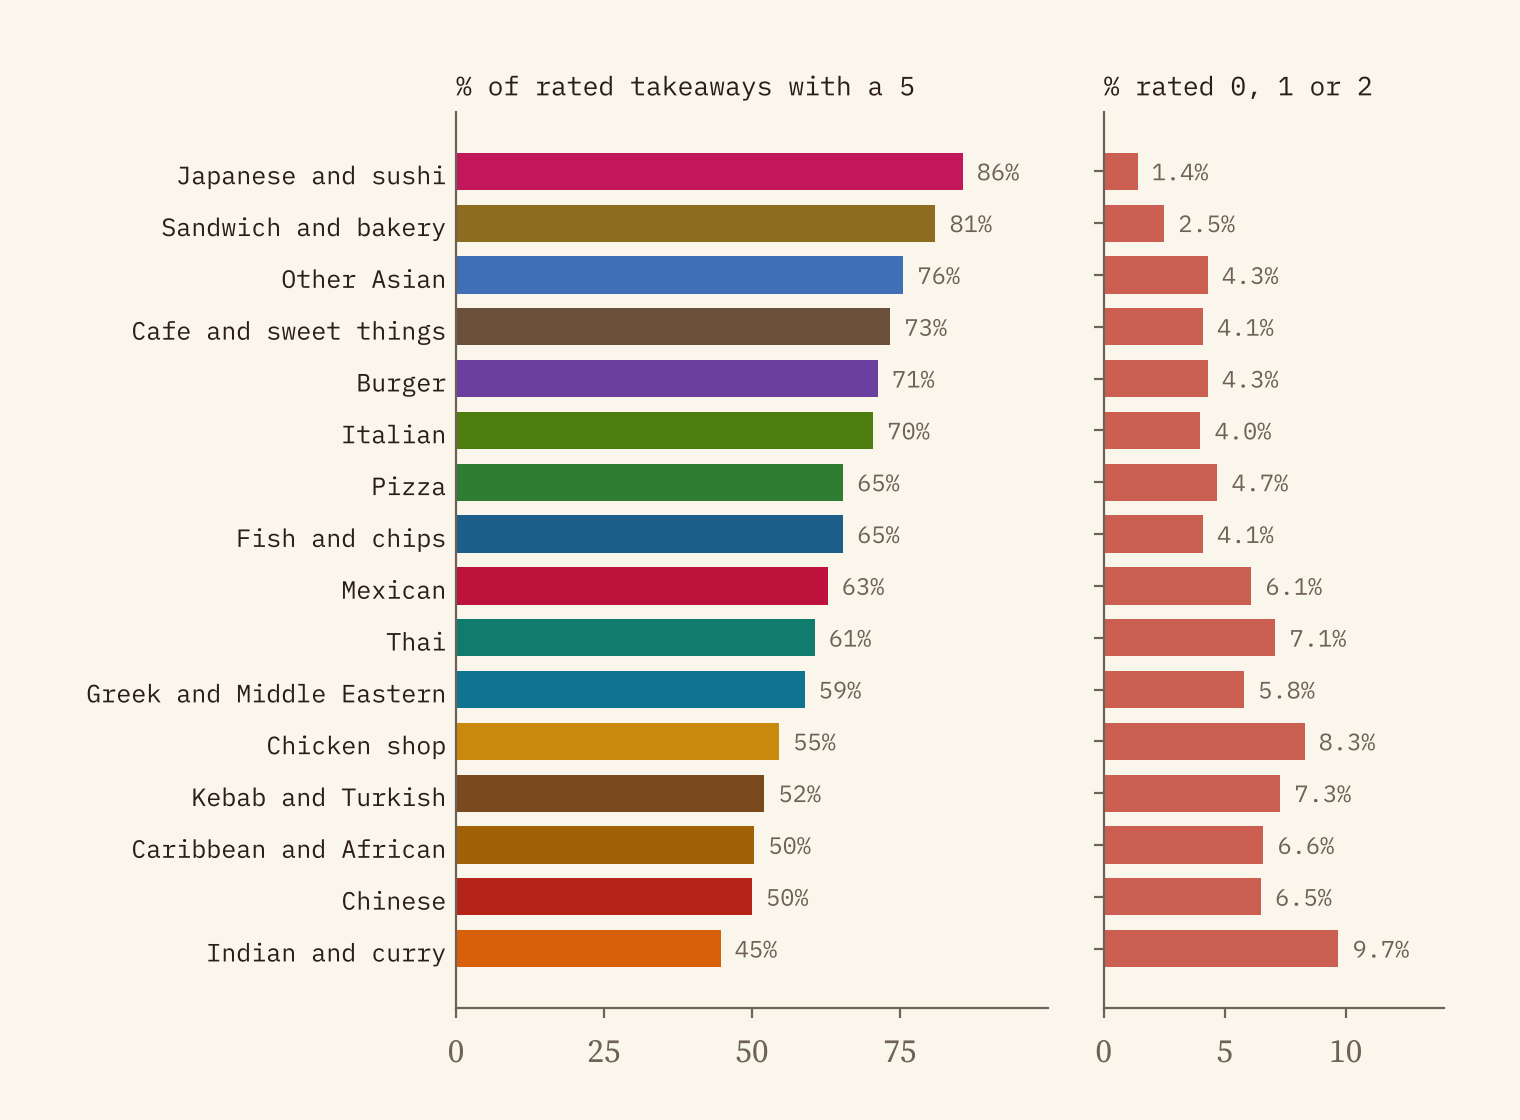
Takeaways rate lower for hygiene than restaurants: 61.4% of rated takeaways have the top score of 5, against 75.6% of restaurants and cafes. Sushi places do best (85.6% with a 5) and Indian takeaways worst (44.7%). Chain takeaways score a 5 far more often than independents (84.4% against 58.4%).
A third of takeaways have names like Tasty Bite or Munchies. Every count here is a floor, not a census.
How I did this
I downloaded the whole register from the Food Standards Agency’s ratings service on 2026-10-28. The name rules look first for chains, then for strong words (fish bar, chippy, tandoori, kebab, pizza, chinese), and only then for weaker hints (dragon, golden, spice). They gave a kind of food to 65.0% of takeaways. To test them, I drew a fresh random sample of 300 names after the rules were finished, each labelled individually by reading the name, as part of the AI-assisted analysis, and reviewed by the author: 96.7% of the rules’ answers were right. OpenStreetMap, whose volunteers tag many takeaways with a cuisine, agreed with the rules 91.7% of the time across 21,351 matched places.
Populations come from the 2021 Census for England, Wales and Northern Ireland and the 2022 Census for Scotland, by postcode district, and from the ONS mid-2025 estimates for counties. There are no official postcode district boundaries, so the district shapes on the maps are my own approximation, drawn from where each district’s businesses are. A city centre or a resort has far more takeaways per head than its residents could eat, so on the interactive map you can also switch to the share of an area’s places that sell each kind of food.
Notes and sources
- Food businesses: Food Standards Agency, Food Hygiene Rating Scheme and Food Hygiene Information Scheme open data, Open Government Licence v3.0.
- Populations: ONS Census 2021 postcode district counts and mid-year estimates (Nomis); National Records of Scotland, Scotland’s Census 2022 postcode counts; NISRA Census 2021 postcode district counts. All Open Government Licence v3.0.
- Boundaries: ONS Open Geography Portal, Counties and Unitary Authorities (December 2023), Open Government Licence v3.0.
- Cuisine check: © OpenStreetMap contributors, Open Database Licence, via the Overpass API.
- I wrote the text, with drafting and editing assistance from Claude (Anthropic), which also helped prepare the analysis code. I reviewed and checked all text and results.

