
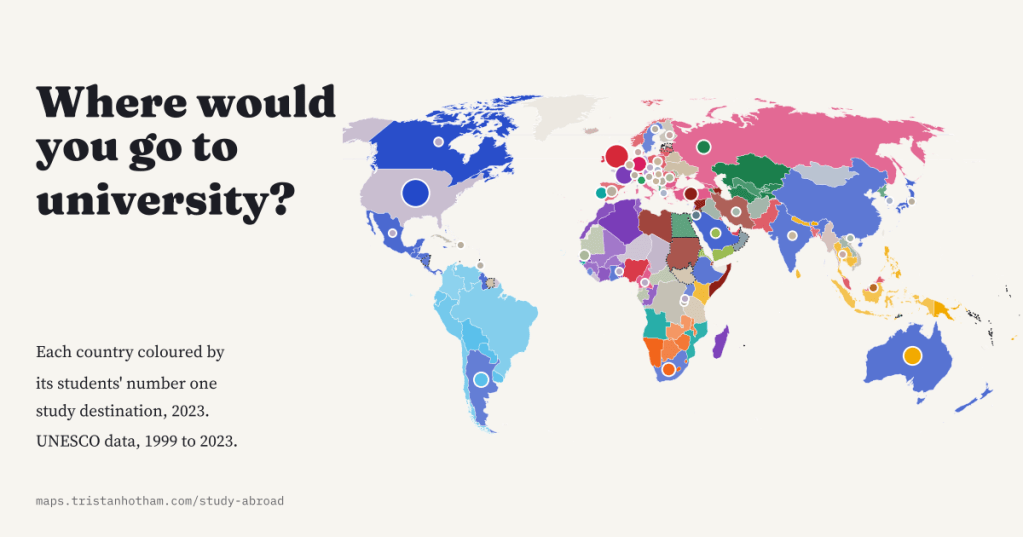
Most countries have one favourite place to send their students. I coloured every country by where its own students most often go to university abroad, every year from 1999 to 2023. Old empires still show through, Turkey has become a magnet, and India has overtaken China in Britain.
Where would you go to university if you left home? For a student in Lagos the answer is very likely Britain. In Almaty it is Russia, in Dakar it is France, in Hanoi it is now Japan. The reasons are old and familiar: a shared language, a shared history, an exam system built on the same model, and cousins who went before. Add them up across a whole country and you get a map with surprisingly sharp edges.
The UNESCO Institute for Statistics collects, from almost every country, the number of international students in its universities and where they come from. Turn that table round and it tells you where each country’s students go. In 2023 it counts 6,234,900 students abroad in 114 host countries. For every country and every year I picked the single most common destination, and coloured the map by it.
The map
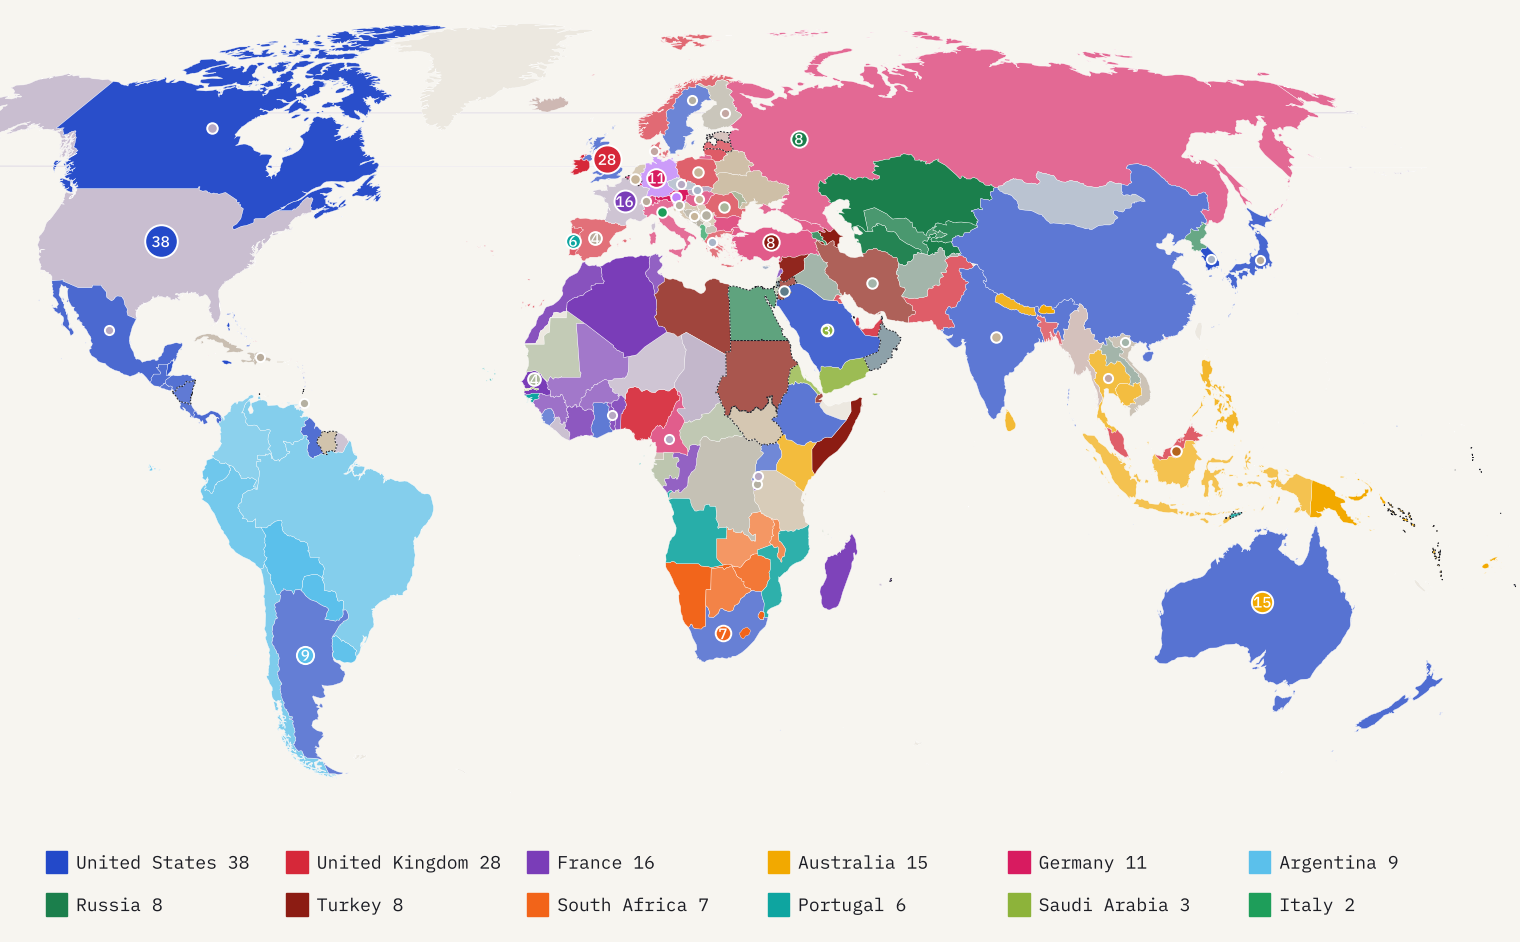
The United States is still the most common answer: it is number one for 38 countries in 2023. Then come the United Kingdom (28), France (16), Australia (15) and Germany (11). Below them is a list that tells you a lot about neighbours. Argentina is first for 9 countries, including Brazil, Peru and Colombia. South Africa is first for much of southern Africa. Germans go to Austria and Austrians go to Germany.
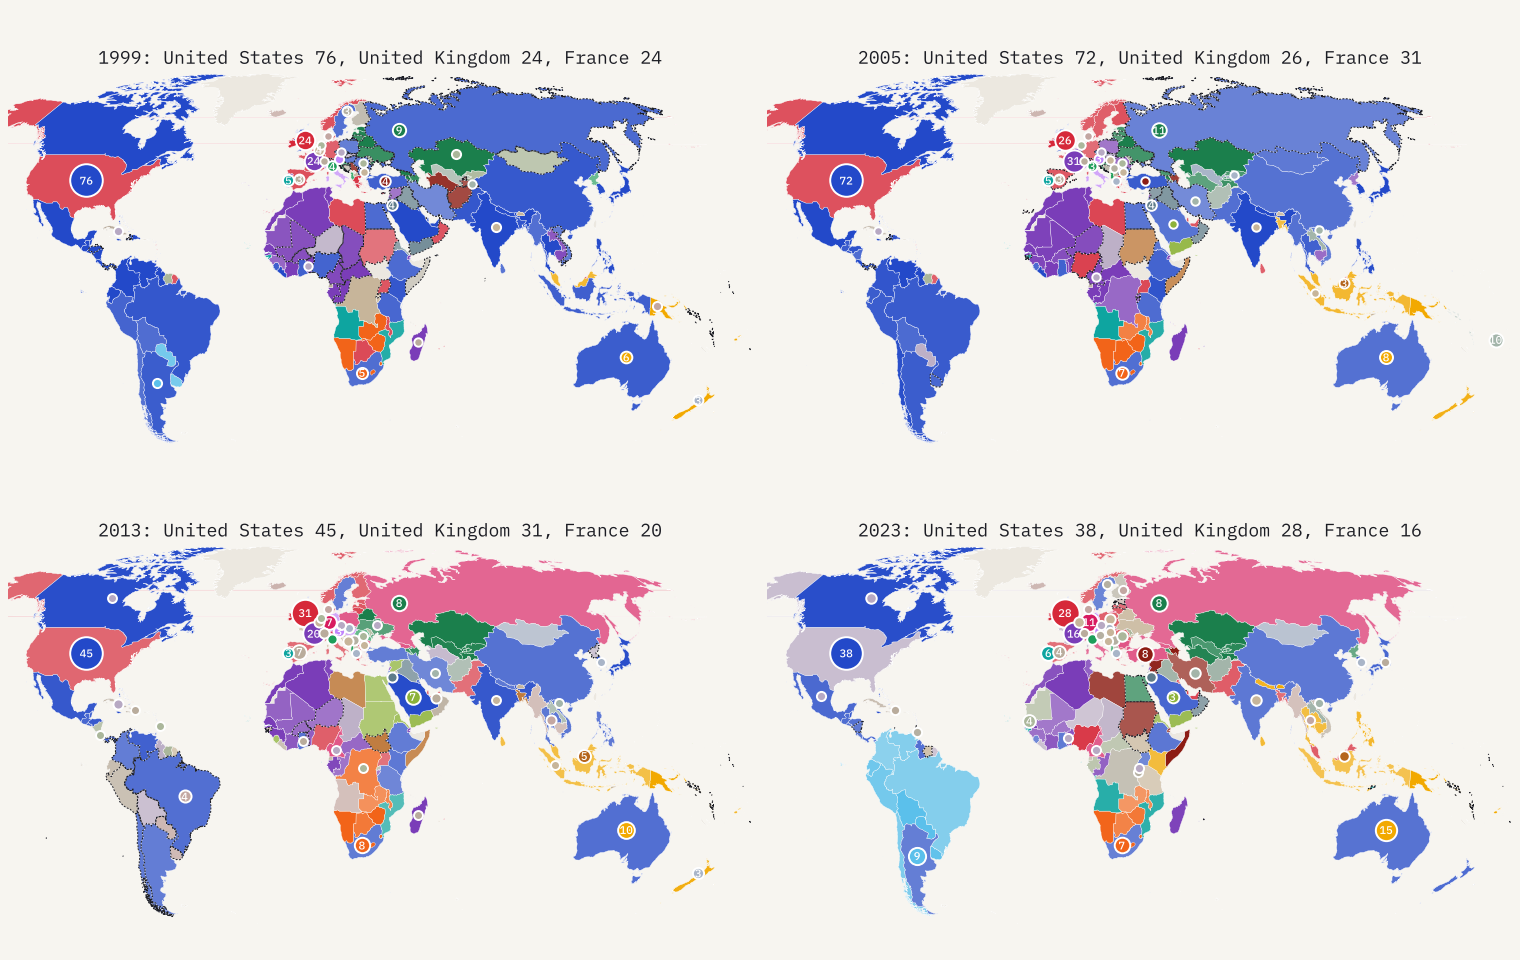
Press play on the interactive version and the map changes slowly. In 1999 the United States led 76 countries. Some of that fall is real and some is a quirk of the data, because Germany did not report where its students came from until 2013. Counting only countries measured cleanly in both years, the United States went from 39 to 33 between 2013 and 2023, with Australia the most common winner.
Empires and languages
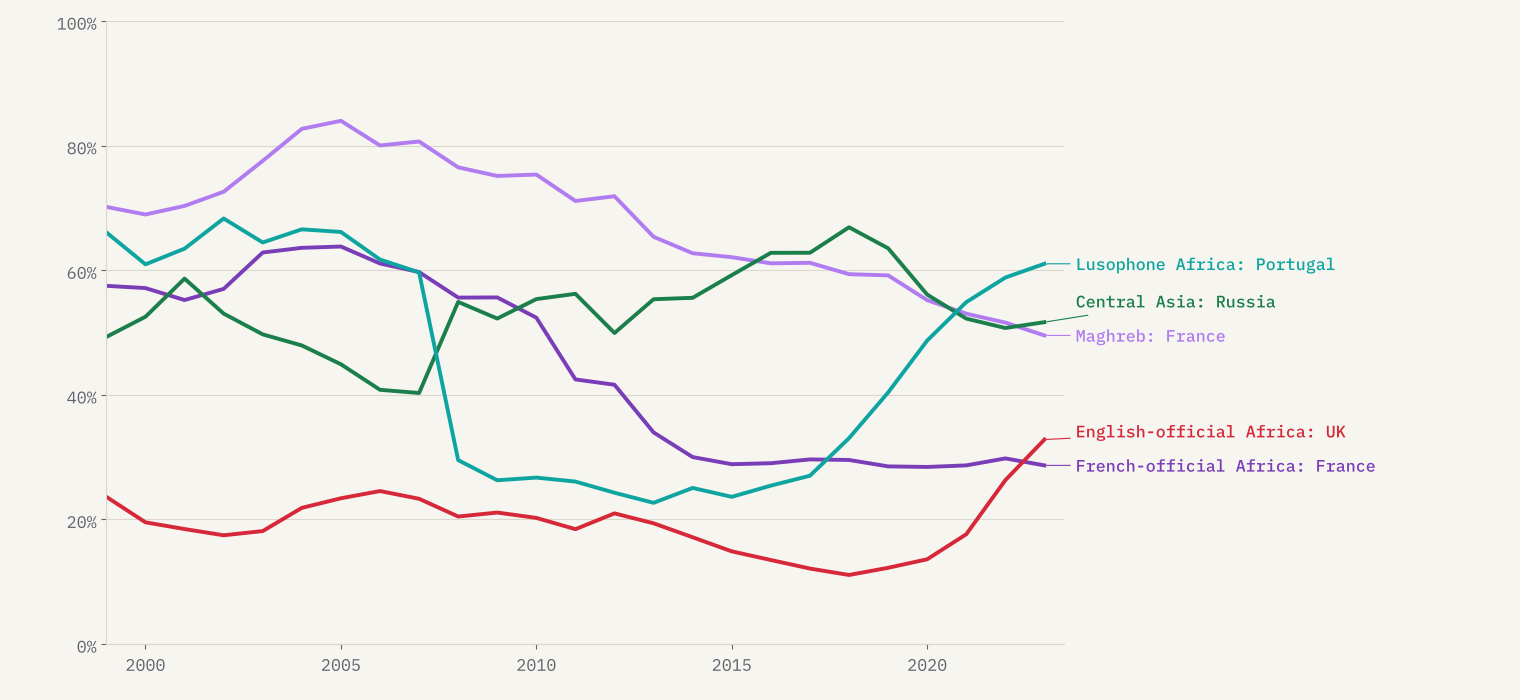
The strongest patterns are older than any student on the map. Russia is number one for all five Central Asian republics, and 52% of their students abroad are in Russia. Portugal takes 61% of students from Angola, Mozambique and the other Portuguese-speaking countries of Africa. France is first for most of French-speaking Africa.
But look at the shares and the old routes are loosening. In 1999, 57% of students abroad from French-speaking sub-Saharan Africa were in France. By 2023 it was 29%. Senegal and Morocco have become regional hubs, and Canada and Turkey have taken a share too. Senegal is now first for 3 of its neighbours. The exception runs the other way: Britain’s share of students from English-speaking Africa rose from 24% to 33%, almost all of it after 2020, as Nigerians poured into British universities.
The new magnets
The biggest surprise for me was Turkey. It had 18,166 international students in 2005 and 301,634 in 2023, a rise of 16.6 times. They come from its neighbours and its language family: Syria, Azerbaijan, Iran and Turkmenistan send the most, and Turkey is now the number one destination for Syria, Azerbaijan and Iran. South Korea grew 8.2 times, mostly with students from China and Vietnam, and is first for Mongolia. Malaysia grew 4.5 times. And Vietnam, whose top destination was the United States until 2016, now sends more students to Japan and to South Korea.
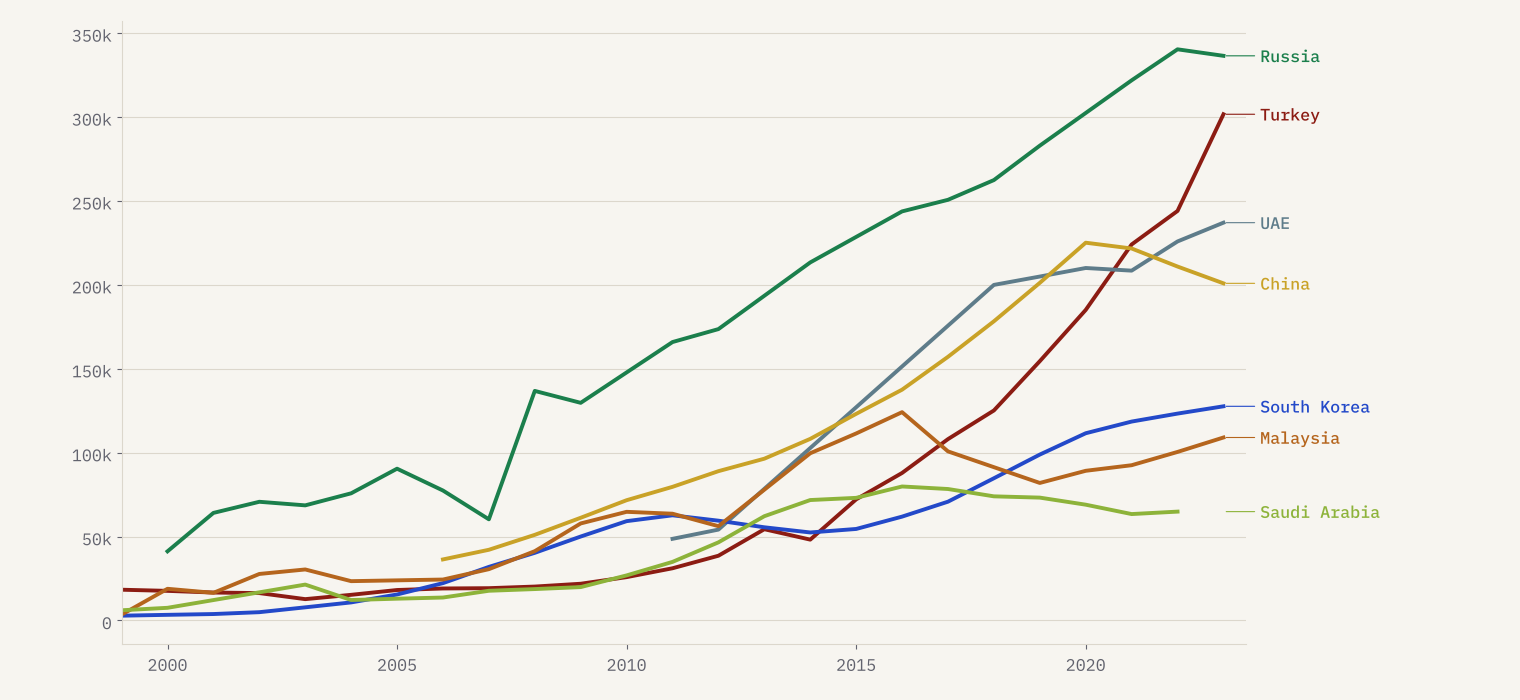
Two of the biggest magnets, China and the United Arab Emirates, do not say where their students come from.
That is the main hole in the map. The Emirates reported 237,034 international students in 2023 and China 200,892, but neither gives a breakdown, so neither can be anyone’s number one here. Where a missing host could plausibly be first, I draw the country with a dashed outline rather than pretend to know.
India, China and Britain
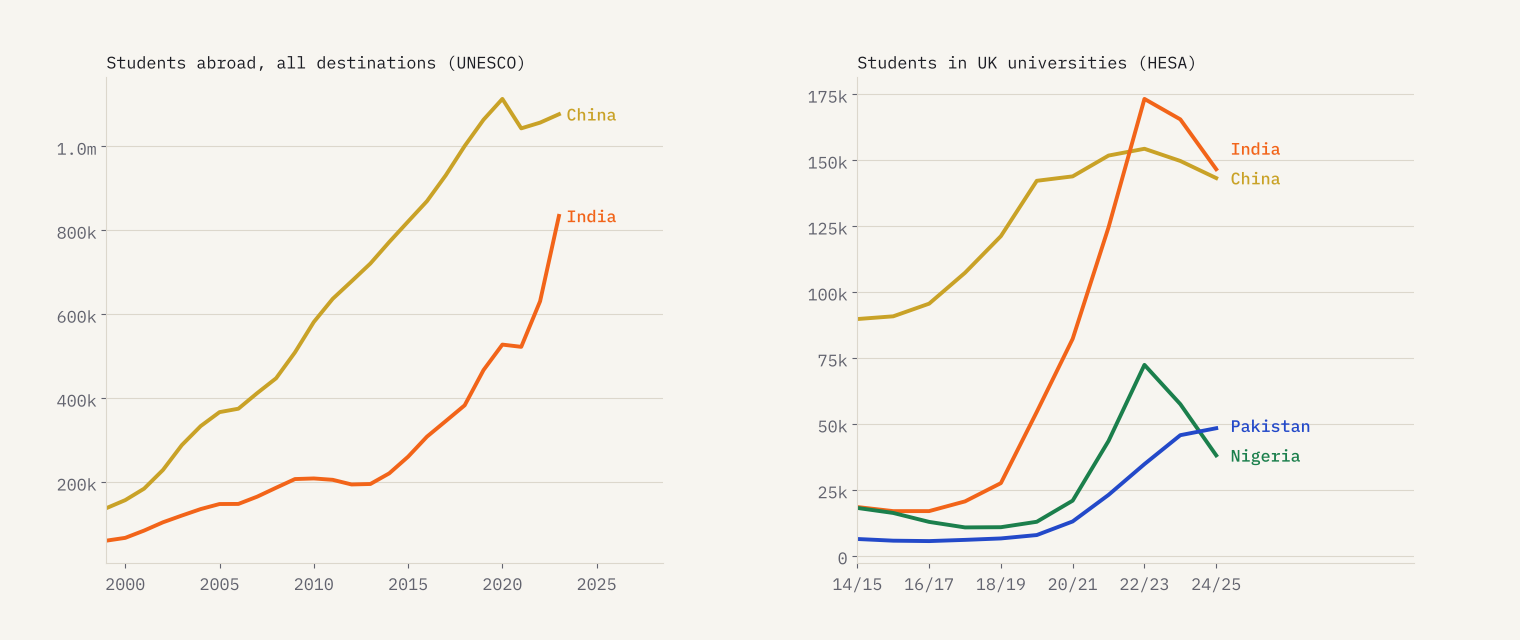
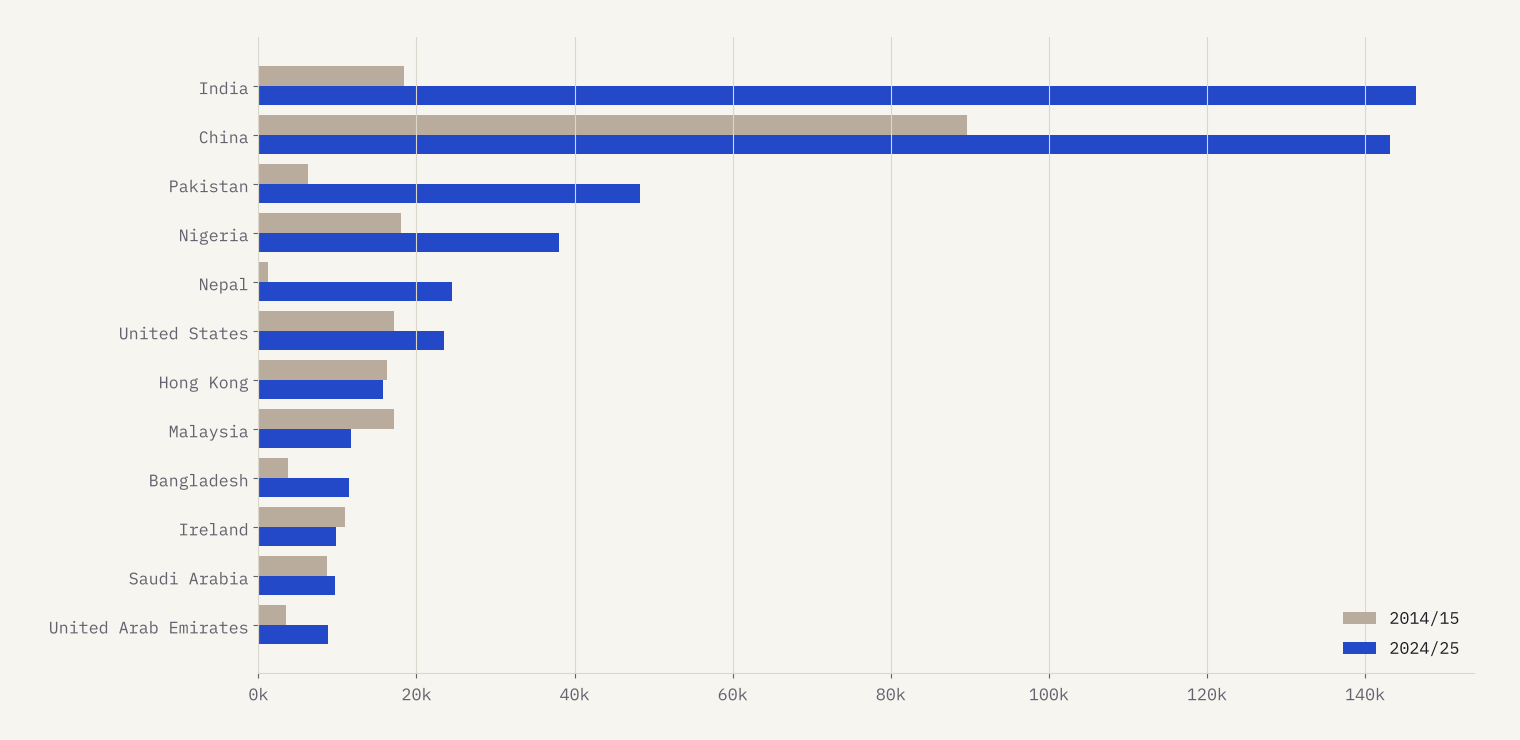
China is still the world’s biggest sender: 1,076,015 students abroad in 2023 on UNESCO’s estimate, against 833,835 from India. But India’s numbers jumped after 2019 while China’s flattened, and in Britain India has already overtaken China. HESA, which counts students at every UK university, shows India passing China in 2022/23. In 2024/25 there were 146,505 students from India and 143,145 from China; ten years earlier India sent just 18,420.
The interactive version has a map for every UK university. The change shows up there too: among universities and colleges with at least 500 international students, China was the biggest source at 77 in 2014/15 and India at 5. By 2024/25 it was 38 for China and 64 for India. Meanwhile students from France, Italy and Germany all fell after Brexit.
How I did this
The data are UNESCO’s counts of internationally mobile tertiary students by host country and country of origin, retrieved from the UIS data API. Many countries skip years, so I filled a gap only when there were reported years on both sides (by a straight line) or carried the nearest year over for at most two years. Of 213,434 rows used, 22,353 are interpolated and 12,087 carried. Countries with fewer than 50 students counted abroad are not ranked. Where a large host with no breakdown that year could be first, the country is flagged as uncertain (22 countries in 2023).
I checked the table two ways. The OECD’s shares of each country’s students by destination match the UNESCO-based shares to within one percentage point 84% of the time, and UNESCO’s total for the UK in 2022/23 is within 1.4% of HESA’s own count. The main limits: hosts that never report origins (China, Singapore, Lebanon) cannot be ranked, Japan reports only part of its students by origin from 2015, and definitions of “mobile” student differ a little between countries.
Notes and sources
- International student mobility: UNESCO Institute for Statistics, UIS data API, release 20260507-91260335, extracted 2026-10-28 (CC BY-SA 4.0).
- Check: OECD Education at a Glance database, share of mobile students by destination (CC BY 4.0).
- UK universities: HESA Table 28, non-UK students by provider and country of permanent address, 2014/15 to 2024/25 (CC BY 4.0). University locations: Wikidata (CC0).
- Countries: Natural Earth (public domain).
- Paper, data and code: Zenodo and GitHub. Text, figures and data CC BY-SA 4.0; code MIT.
- I wrote the text, with drafting and editing assistance from Claude (Anthropic), which also helped prepare the analysis code. I reviewed and checked all text and results.

