
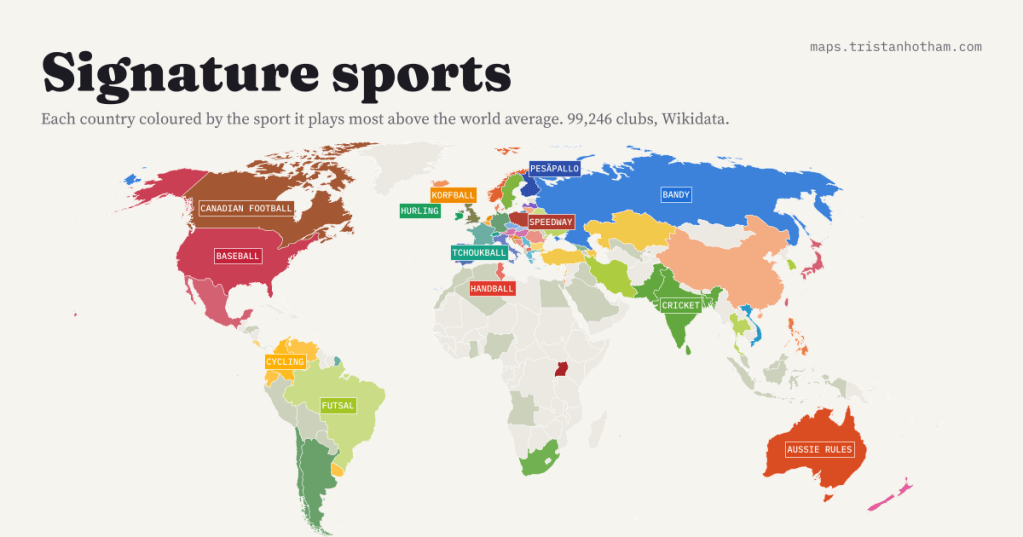
Every country plays football. But which sport does each country play far more than the rest of the world? I counted 99,246 sports clubs and coloured every country by its signature sport. Pesäpallo, tchoukball, hurling and speedway all have a country of their own.
Maps of “the most popular sport in each country” are nearly all one colour. Football wins almost everywhere, and in the data I used it is 51% of all the clubs in the world. That map is true and tells you nothing about what makes Finland different from Spain.
So I asked a different question: which sport does each country have more of than you would expect? If a sport is 1% of the world’s clubs but 10% of one country’s, that country plays it ten times as much as the world average. Geographers call this a location quotient. It has a lovely property for messy open data: because it compares each country with itself, it does not matter that Germany has 9,328 clubs recorded and Nigeria 150.
A map of national quirks
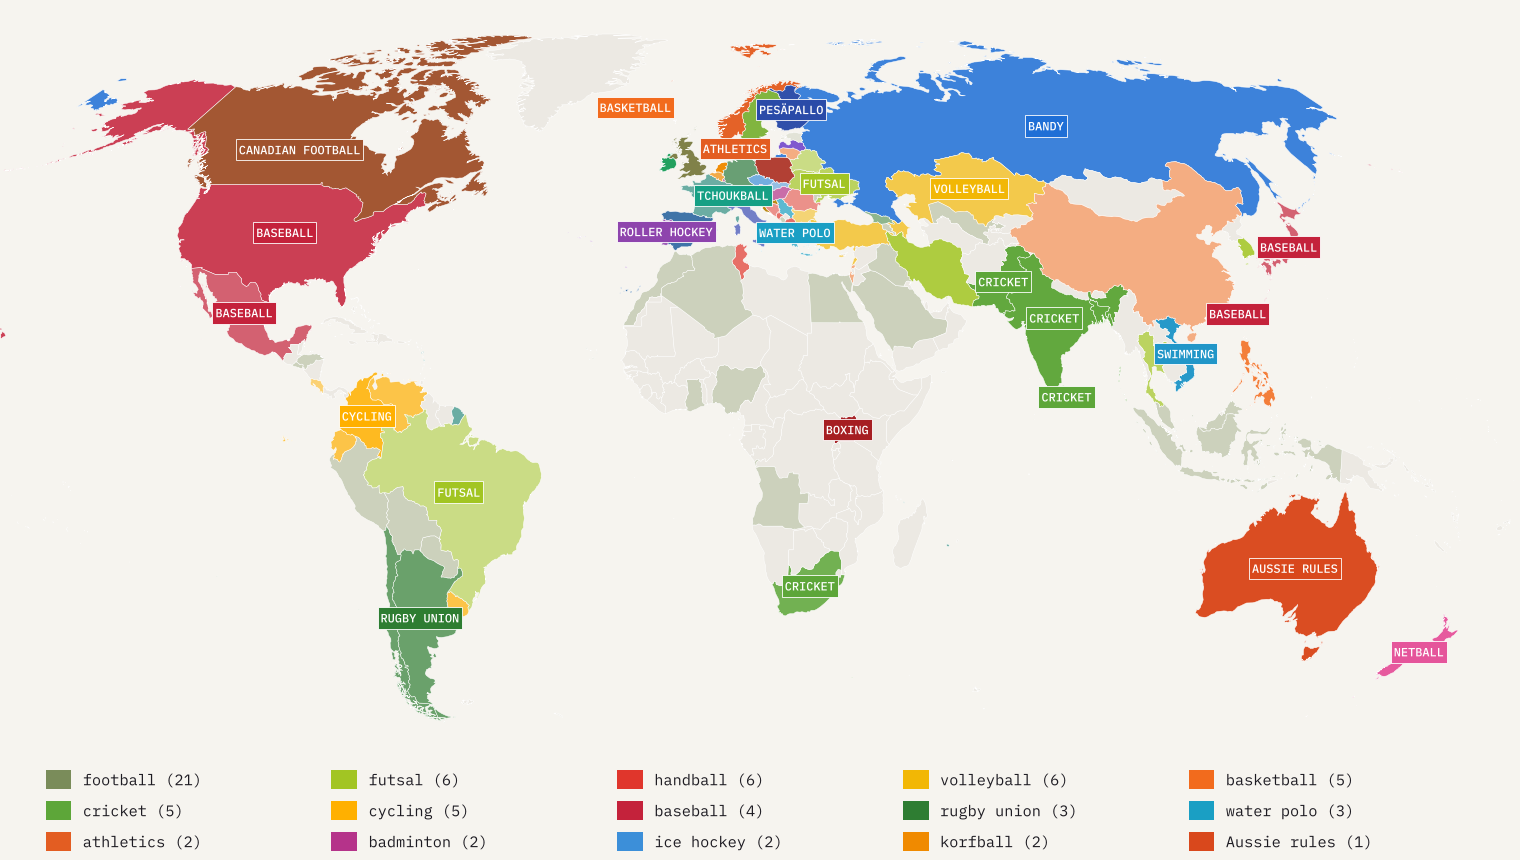
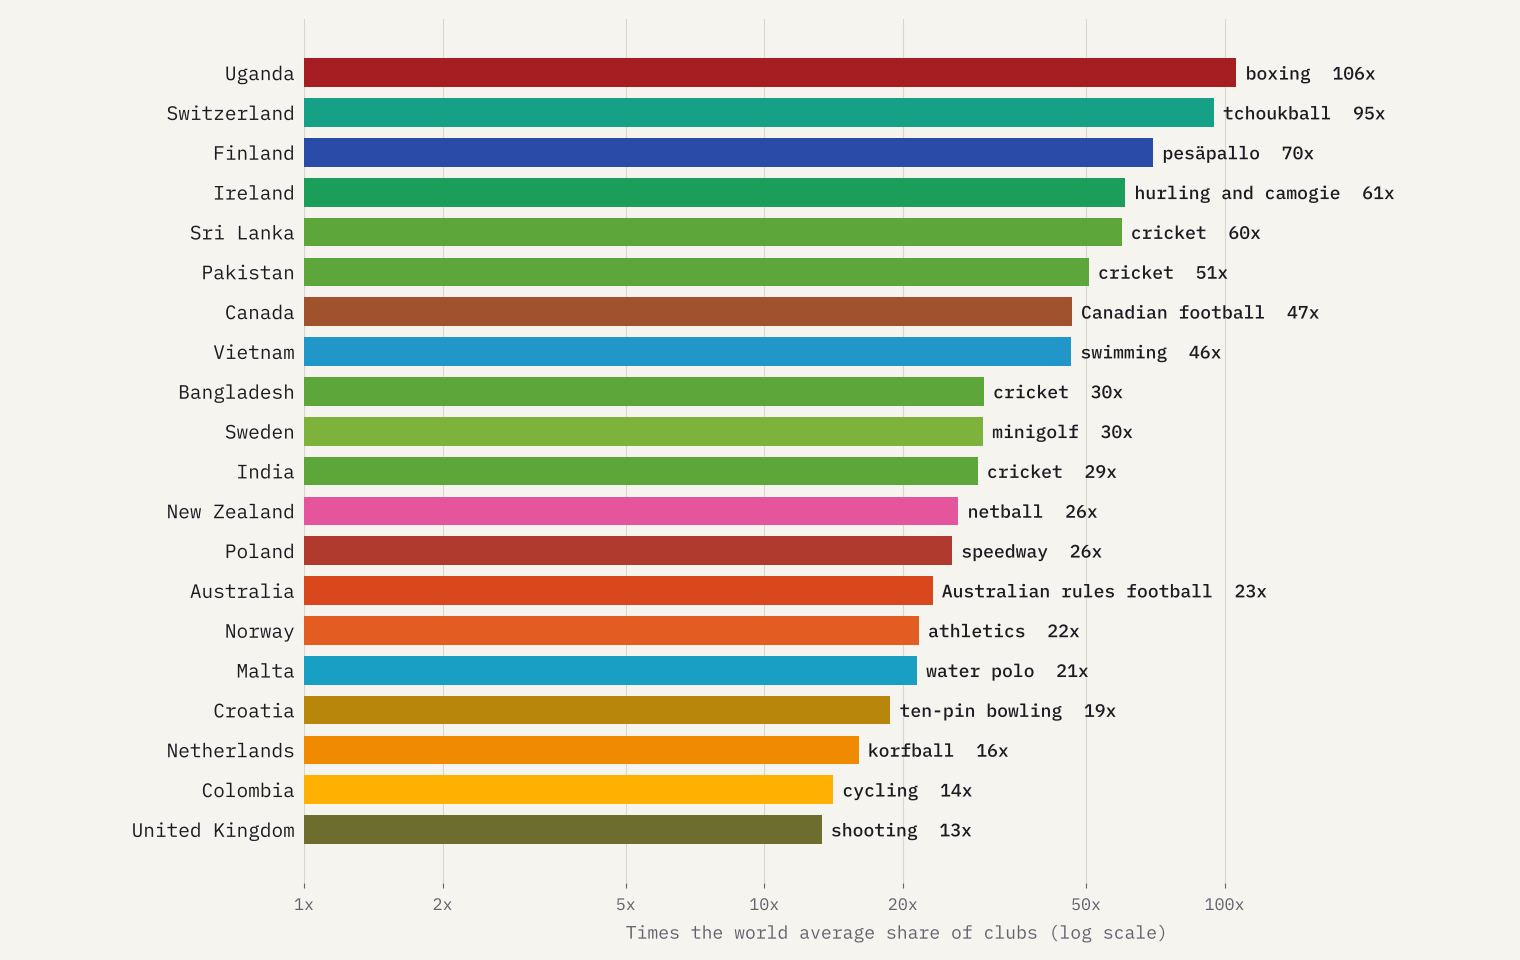
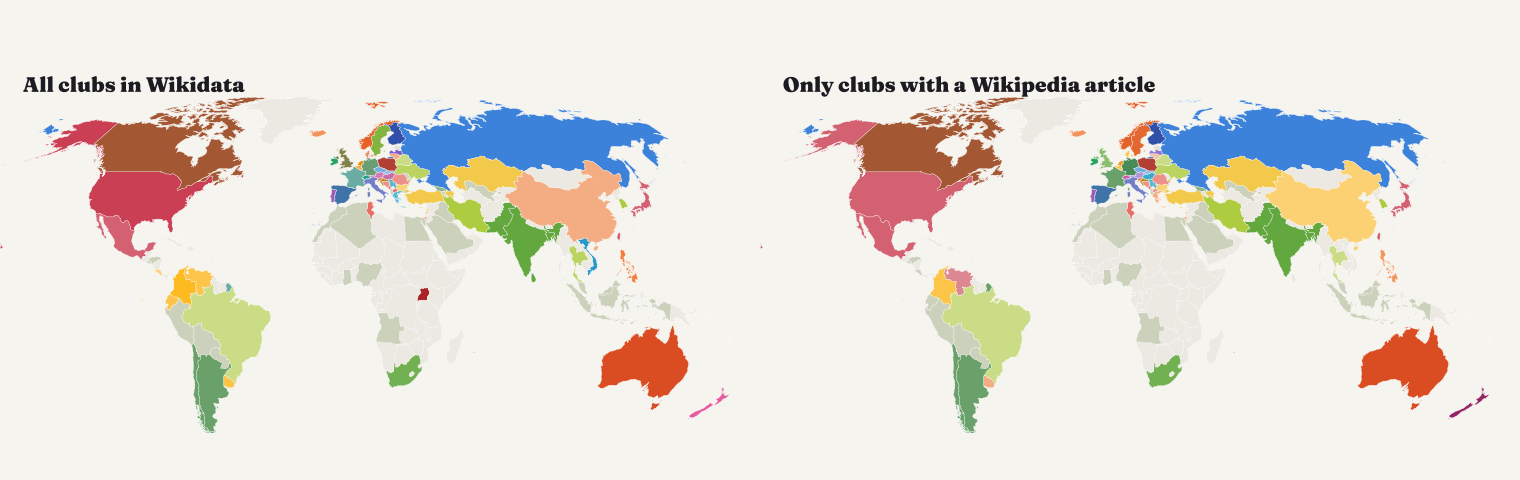
Of the 92 countries with at least 100 clubs in Wikidata, 92 have a clear signature sport, and 34 different sports win somewhere. Some are exactly what you would guess: cricket in Sri Lanka, Pakistan, India and Bangladesh, Australian rules football in Australia (23x the world average), Canadian football in Canada (47x), hurling in Ireland (61x).
Others were news to me. Finland’s signature is pesäpallo, its own fast, zig-zagging version of baseball, at 70x the world average; every pesäpallo club in the data is Finnish. Switzerland’s is tchoukball, a no-contact game played by bouncing a ball off a small rebound frame, devised in Switzerland around 1970. Poland’s is speedway, motorbikes with no brakes sliding round shale ovals (26x). The Netherlands’ is korfball (16x), the mixed team game first played in Amsterdam in 1902.
Zoom out and blocks appear. Handball is the signature in a band from Tunisia through Romania to the former Yugoslavia. Volleyball rules from Turkey to Kazakhstan. Futsal is the signature in Brazil, Iran, South Korea and Ukraine. Cycling takes the Andes: Colombia, Ecuador and Venezuela.
Small numbers, big ratios
There is a trap in ratios like these. One croquet club in a small country can make it look like the croquet capital of the world. So I set three rules. A country needs at least 100 clubs to be mapped at all. A sport needs at least 10 clubs in a country before that country can be its heartland. And the winner is picked with a cautious version of the ratio, which pretends each count is a bit smaller than it is: the lower end of a 90% range for it. Ten clubs count as about 5.4; a hundred count as about 84.1. A small sport has to lead by a mile to win.
Pick a sport
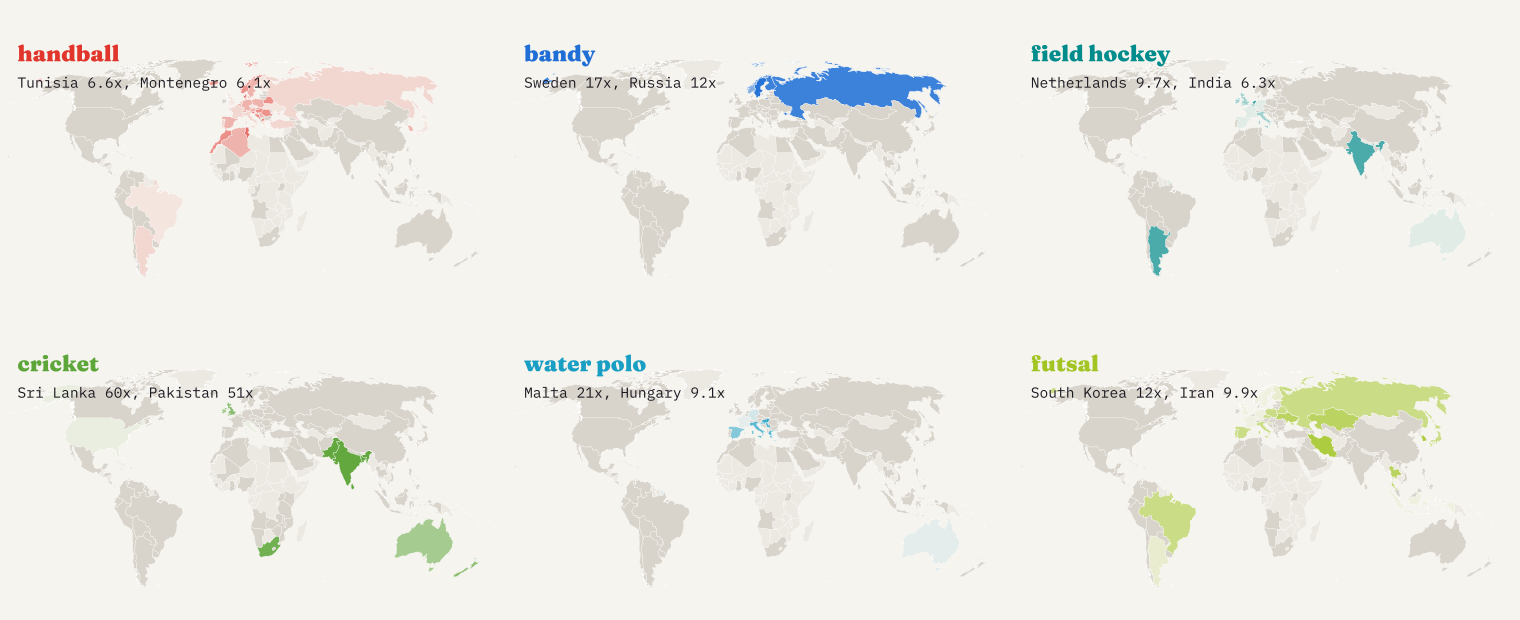
The interactive map lets you choose any of 59 sports and see where it glows. Bandy, hockey with a ball on an ice rink the size of a football pitch, belongs to Sweden (17x), Russia and Finland. Field hockey’s heartland is the Netherlands (9.7x), then India and Argentina. Water polo’s is Malta, Hungary and Italy. Where clubs have coordinates you can go inside countries too: rowing is Spain’s signature sport, and it turns out to be a Basque affair, with Gipuzkoa at 59x the world average, home of the trainera boat races. Hurling peaks in Tipperary (61x).
Where the data fools you
Wikidata is built by volunteers, and sometimes by bulk imports of whole registries. The location quotient cancels out how much of a country is recorded, but not which sports. The United Kingdom’s signature comes out as target shooting, because someone added 851 British target shooting clubs with near-identical descriptions. Sweden’s comes out as minigolf for the same reason.
So the page has a switch that counts only the 82,378 clubs with a Wikipedia article. That removes most imports, though it has its own bias towards famous clubs. 71 of 87 countries keep the same signature either way. The UK becomes cricket, Sweden orienteering, Hungary water polo, France rugby union. The heartlands that survive both versions, pesäpallo, hurling, speedway, korfball, bandy and cricket, are the ones I would bet on.
Finnish Wikipedia reads about pesäpallo 20x as much as the average language. Polish Wikipedia reads about speedway 10x as much.
Do medals agree?
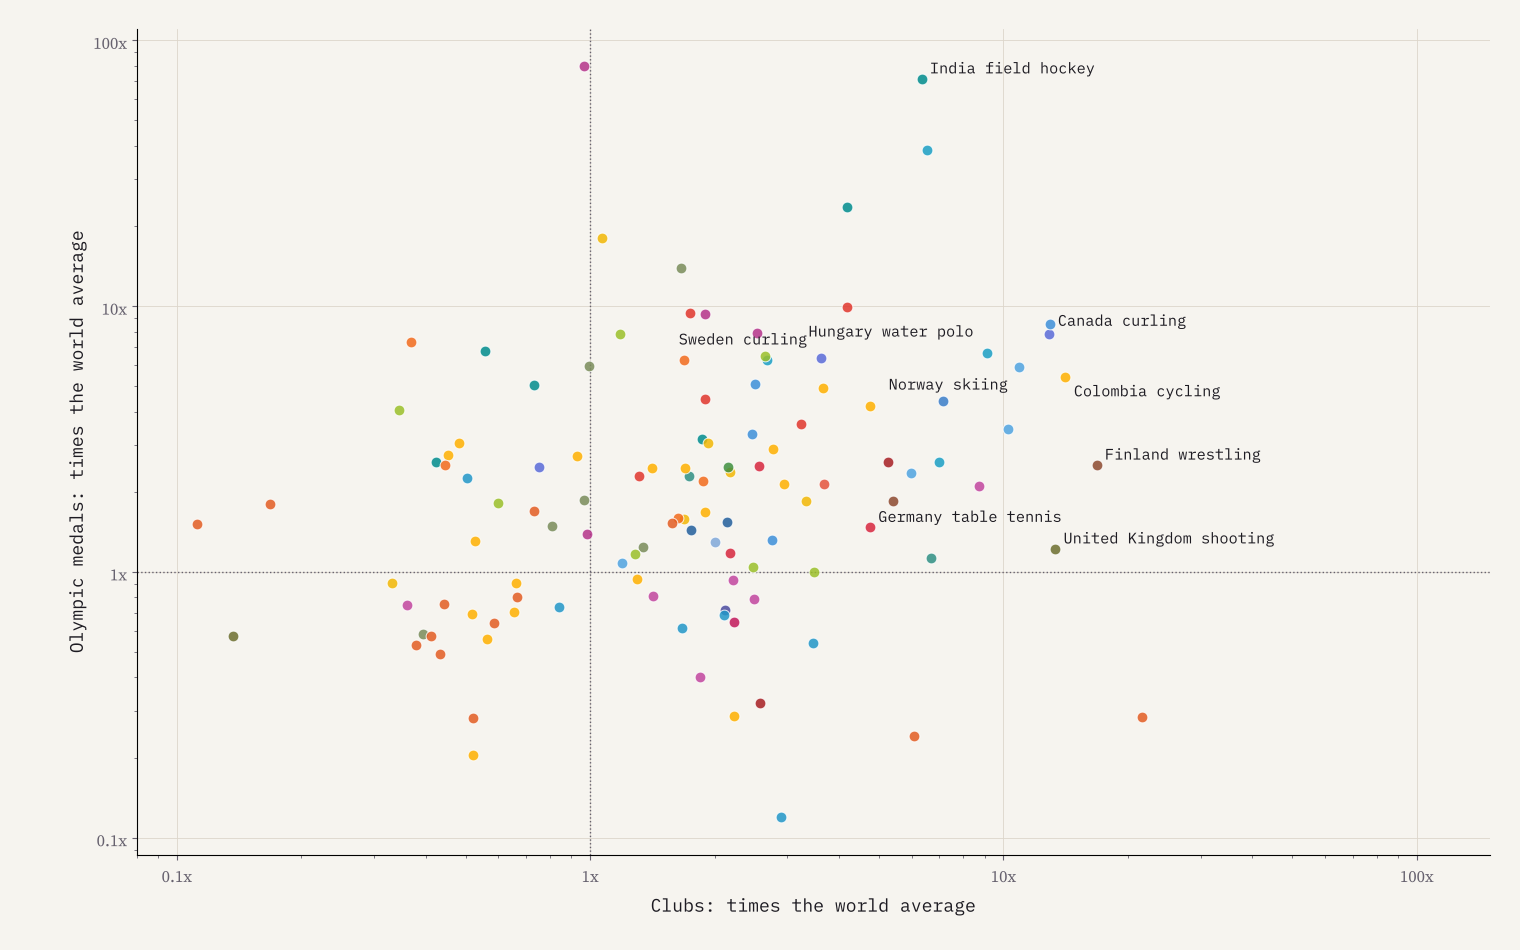
Only loosely. I compared the club figures with all-time Olympic medal tables for 50 sports. Across 117 country and sport pairs the rank correlation is 0.28: medals reward a few elite athletes, clubs measure everyday play. The pairs that are high on both are the real heartlands: Finland in wrestling, Canada in curling, Norway in skiing, Hungary in water polo and Colombia in cycling. Hungary has more Olympic water polo medals than any other country, and water polo is its signature sport once the imports are filtered out.
The UK, county by county
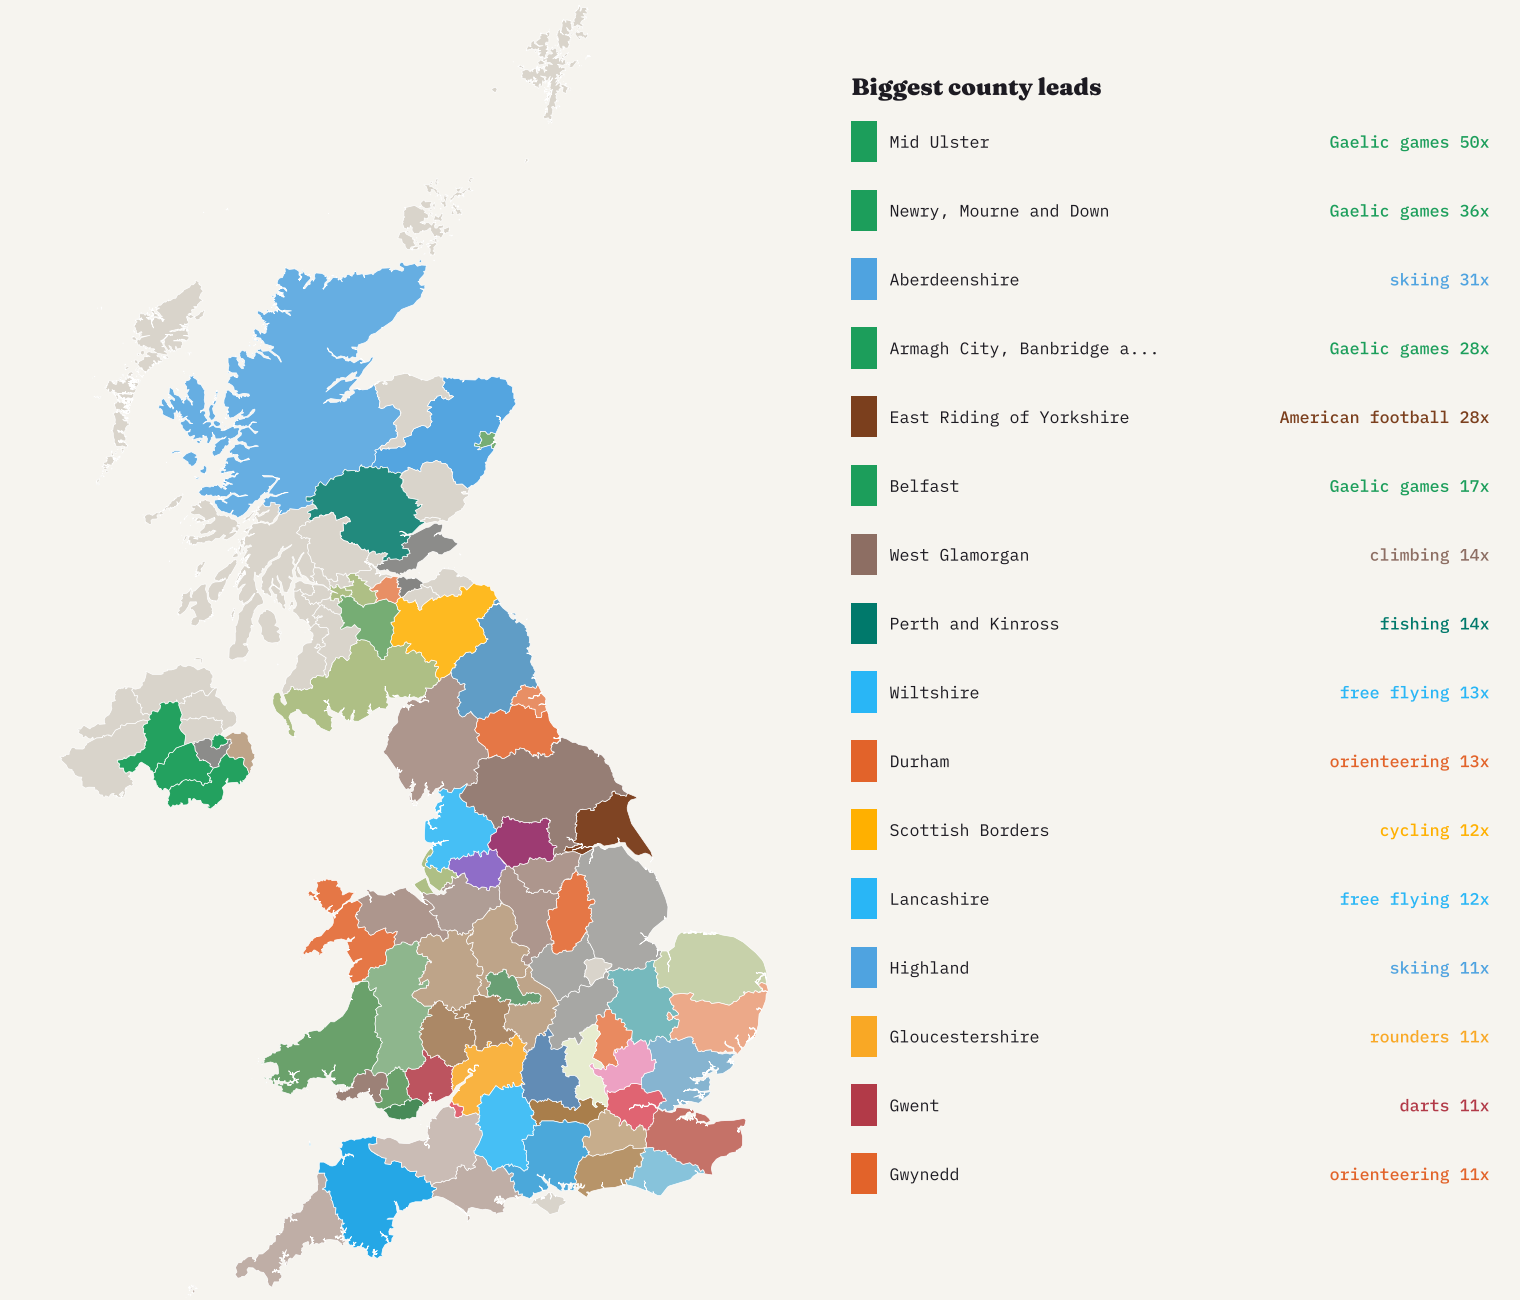
Wikidata is too thin to go inside the UK for small sports, so for the last map I switched to OpenStreetMap, where volunteers have tagged 147,269 pitches, courts, greens, clubs and sports centres with a sport. I merged features of one sport within about 200 metres of each other, so the four pitches on one field count once, which leaves 114,148 places to play.
Some county leads are what you would expect and some are not. The biggest is Gaelic games in Mid Ulster (50x the UK average), then Gaelic games in Newry, Mourne and Down (36x). Among the small traditional games, shinty, the Highland stick game, peaks in Highland (178x); croquet in Devon (4.7x); lacrosse in Greater Manchester (11x); curling in Aberdeenshire (29x); Gaelic games in Mid Ulster (50x).
How I did this
I took every Wikidata item that is a sports club or team with a sport and a country (144,811 items), removed national sides, Olympic delegations, team seasons and school and college teams, merged variants of each sport and split clubs listed under several sports so each counts once. That left 99,246 clubs. For each sport and country I divided the sport’s share of the country’s clubs by its share of the world’s, and picked each country’s signature sport with the cautious ratio described above. Regions use clubs with coordinates (44% of them). The UK map does the same with OpenStreetMap places to play against the UK mix. These are counts of organised clubs as recorded, not of players, and every number is in the data files linked below.
Notes and sources
- Wikidata: sports clubs and teams, queried through the QLever endpoint, 2026-10-28 (CC0).
- English Wikipedia, “Sport at the Summer Olympics” and “at the Winter Olympics” articles, all-time medal tables (CC BY-SA 4.0).
- Wikimedia pageviews API, user views in 2025.
- OpenStreetMap contributors, features tagged sport, via the Overpass API (ODbL 1.0).
- Boundaries: Natural Earth (public domain); UK counties from Office for National Statistics boundaries via onsvisual/uk-topojson (Open Government Licence v3).
- I wrote the text, with drafting and editing assistance from Claude (Anthropic), which also helped prepare the analysis code. I reviewed and checked all text and results.

