
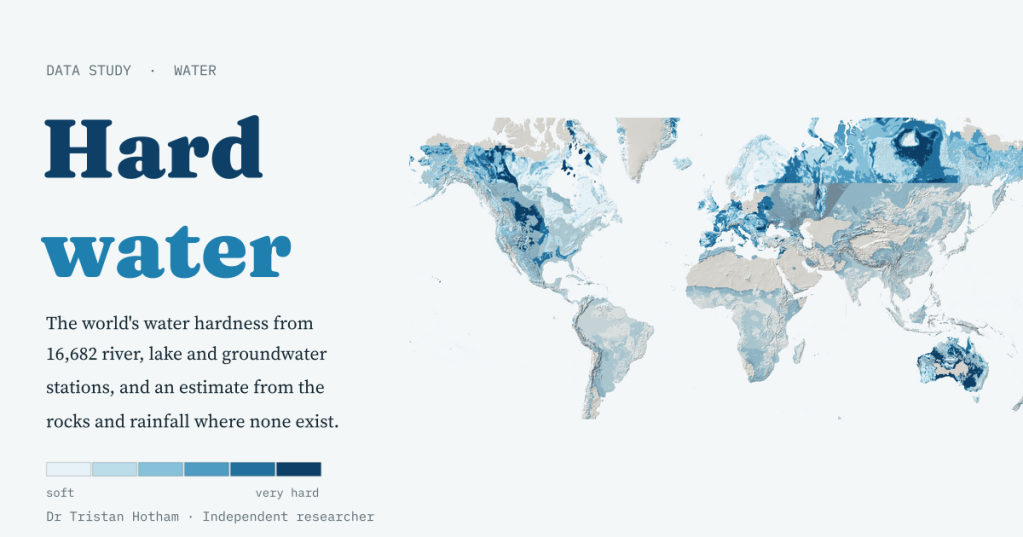
Why does a kettle in Cambridge fur up and one in Aberdeen stay clean? Because of the rocks the water has passed through. I mapped the hardness of 16,682 rivers, lakes and wells around the world, then tested how well the rocks alone can guess it.
Anyone who has moved house in England knows the map, even if they have never seen it. Water in Wales, Cornwall, the Lakes and the Pennines is soft: soap lathers, kettles stay clean. Water across the south and east is hard, and the limescale builds up on everything. Water companies publish hardness maps by supply zone, and they show that pattern beautifully. I wanted the world version.
Hardness is mostly calcium and magnesium, and it comes from the ground. Rain is a very weak acid: it picks up carbon dioxide from the air and the soil, and that carbonic acid dissolves limestone, chalk and dolomite readily. Granite, gneiss and most sandstones barely give anything up. So a map of hard water ought to be, more or less, a map of soluble rock.
What the measurements say
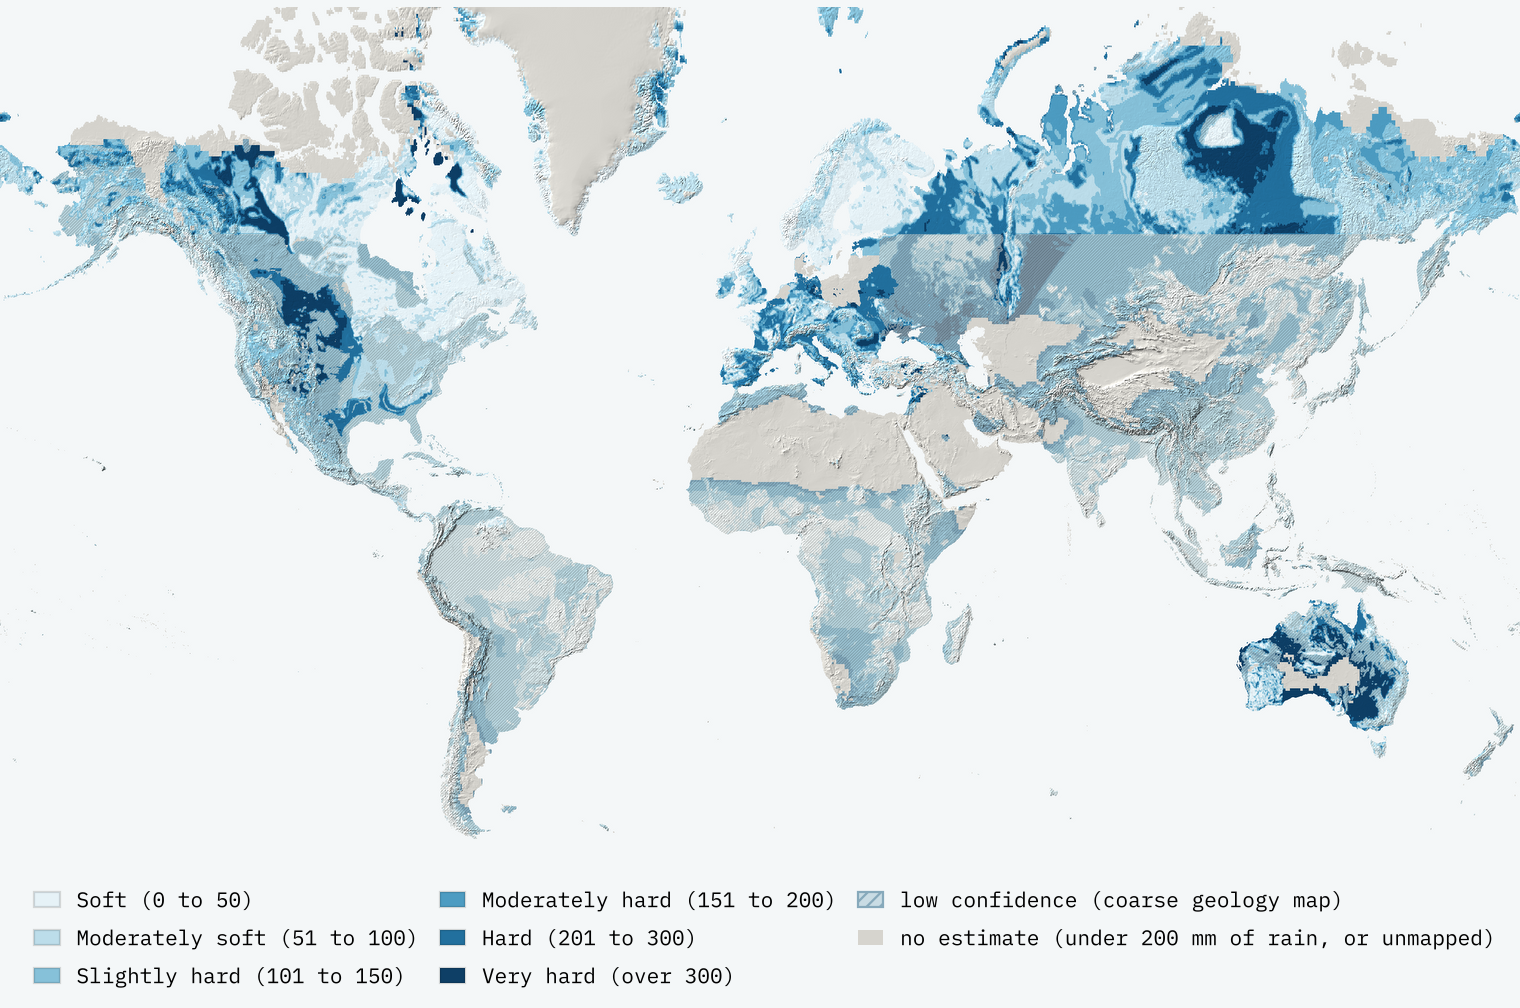
There is no open world map of tap water, so I used the next best thing: the UN’s GEMS/Water archive of river, lake and groundwater monitoring. Its open release has 611,858 usable samples of hardness, or of the calcium and magnesium that make it, from 16,682 stations in 34 countries. I took each station’s median, in milligrams per litre of calcium carbonate (the same as parts per million), and coloured it in the same six classes as the England and Wales maps.
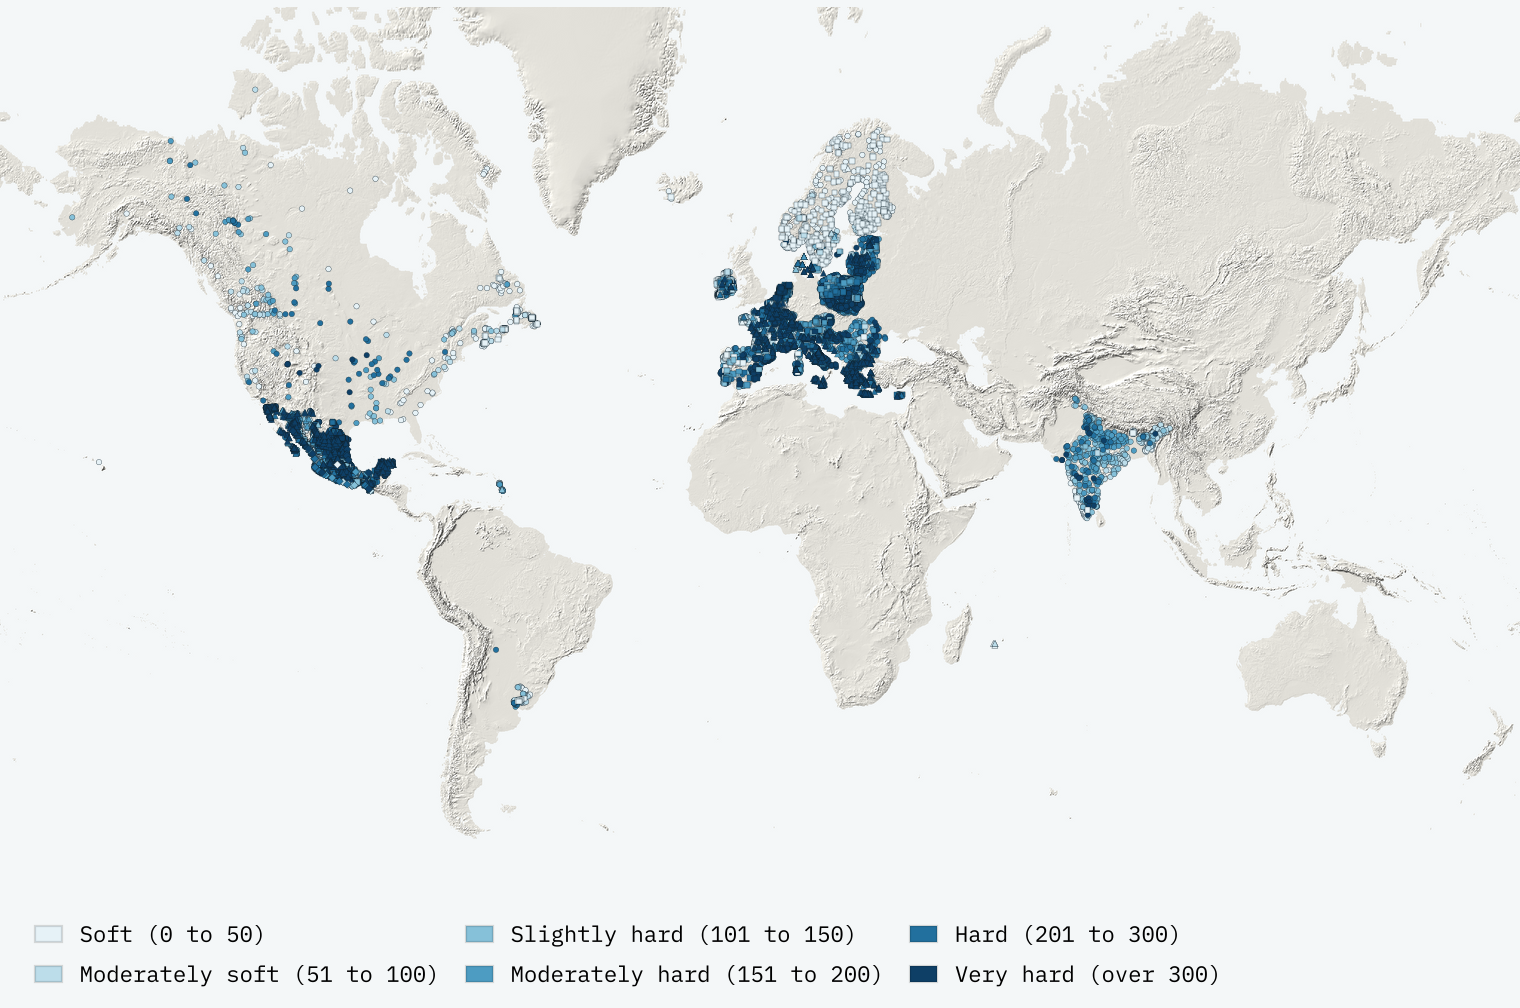
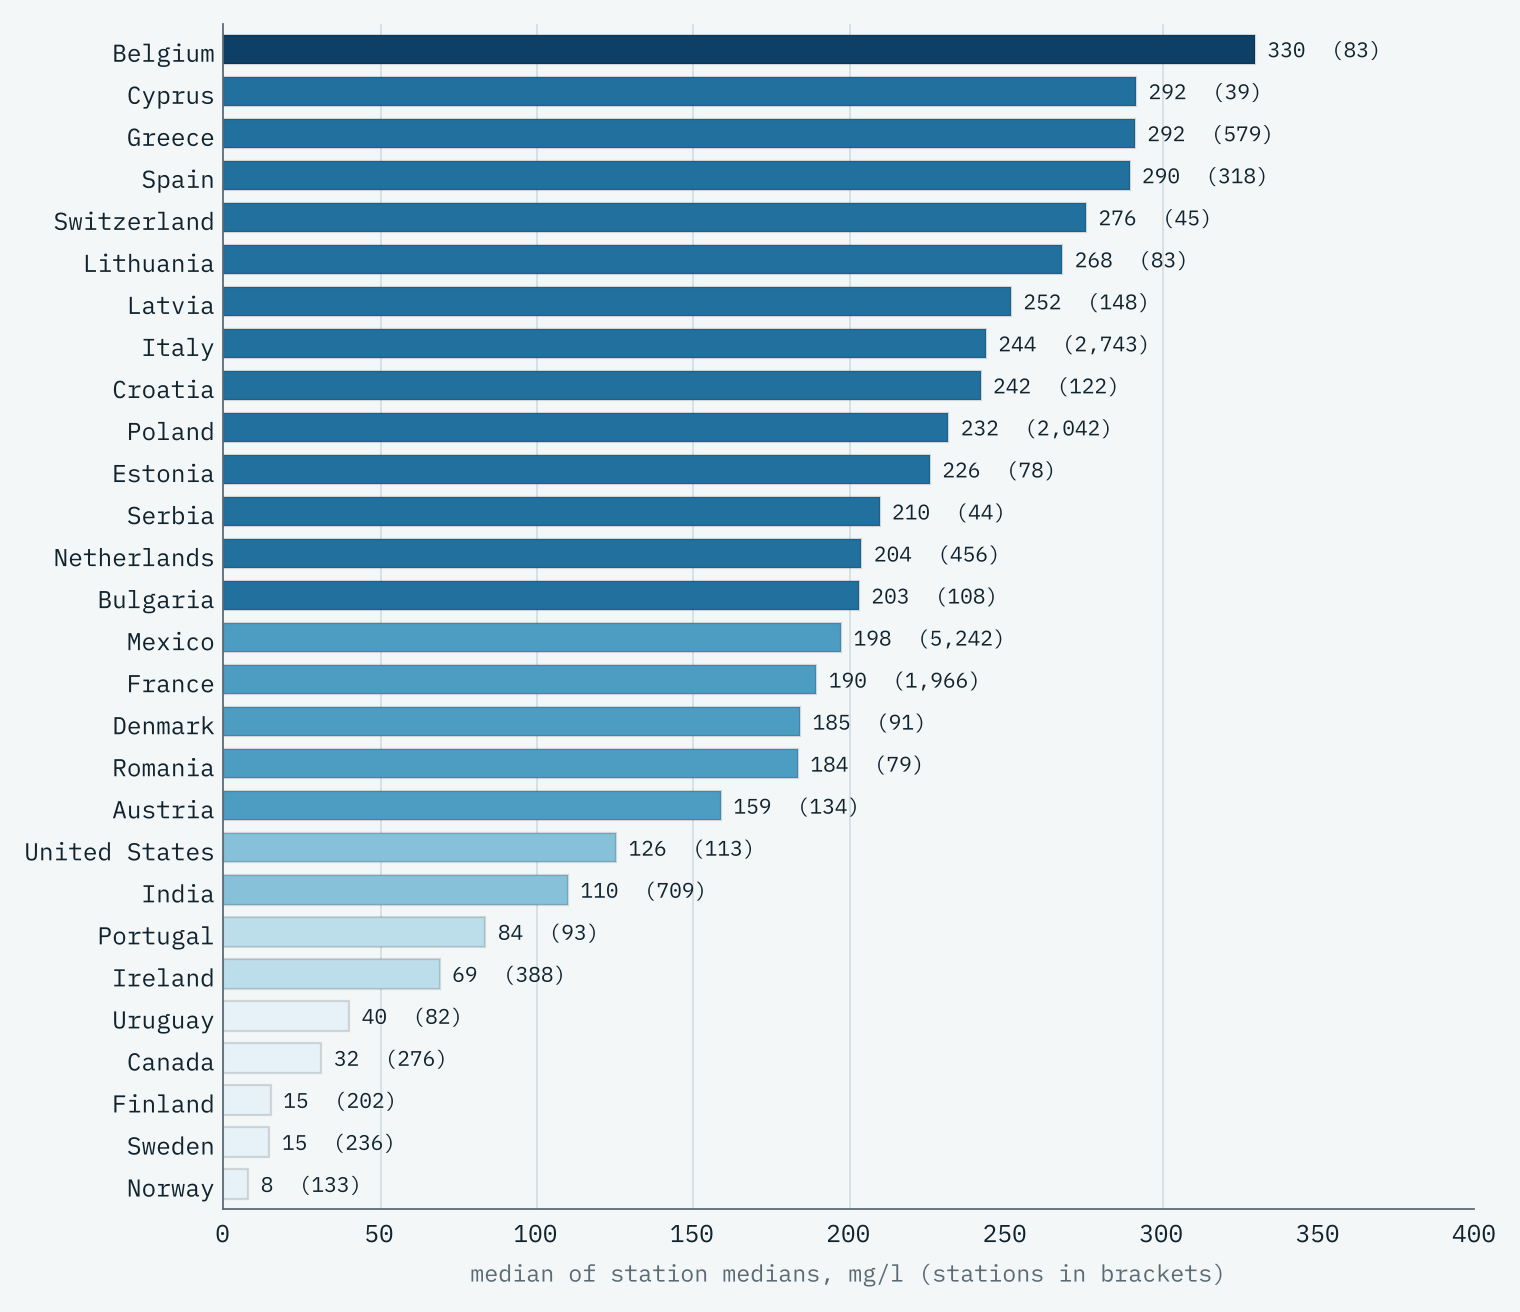
The median station is 202 mg/l, “moderately hard”, and a quarter of them are very hard, over 300 mg/l. Groundwater is the hardest (median 276 mg/l), because it sits in the rock for months or years. Rivers come next at 199 mg/l, and lakes are softest at 139 mg/l. The contrasts between places are enormous. The 571 stations in Norway, Sweden and Finland have a median of just 14 mg/l; on the limestone of Mexico’s Yucatán Peninsula, 187 stations have a median of 514 mg/l.
The rocks behind it
To link water to rock I used Macrostrat’s world geological map and split every map unit into seven rock groups by its description, so “limestone and shale” counts as half carbonate and half mudstone. Then, for each station, I measured how much of the land within 10 km is each kind of rock.
The strongest signal turned out not to be limestone but its opposite. Where granite, gneiss and other crystalline rocks cover more than four fifths of the ground, the median station has just 34 mg/l. Where they cover less than a fifth, it is 220 mg/l. Hard rock makes soft water.
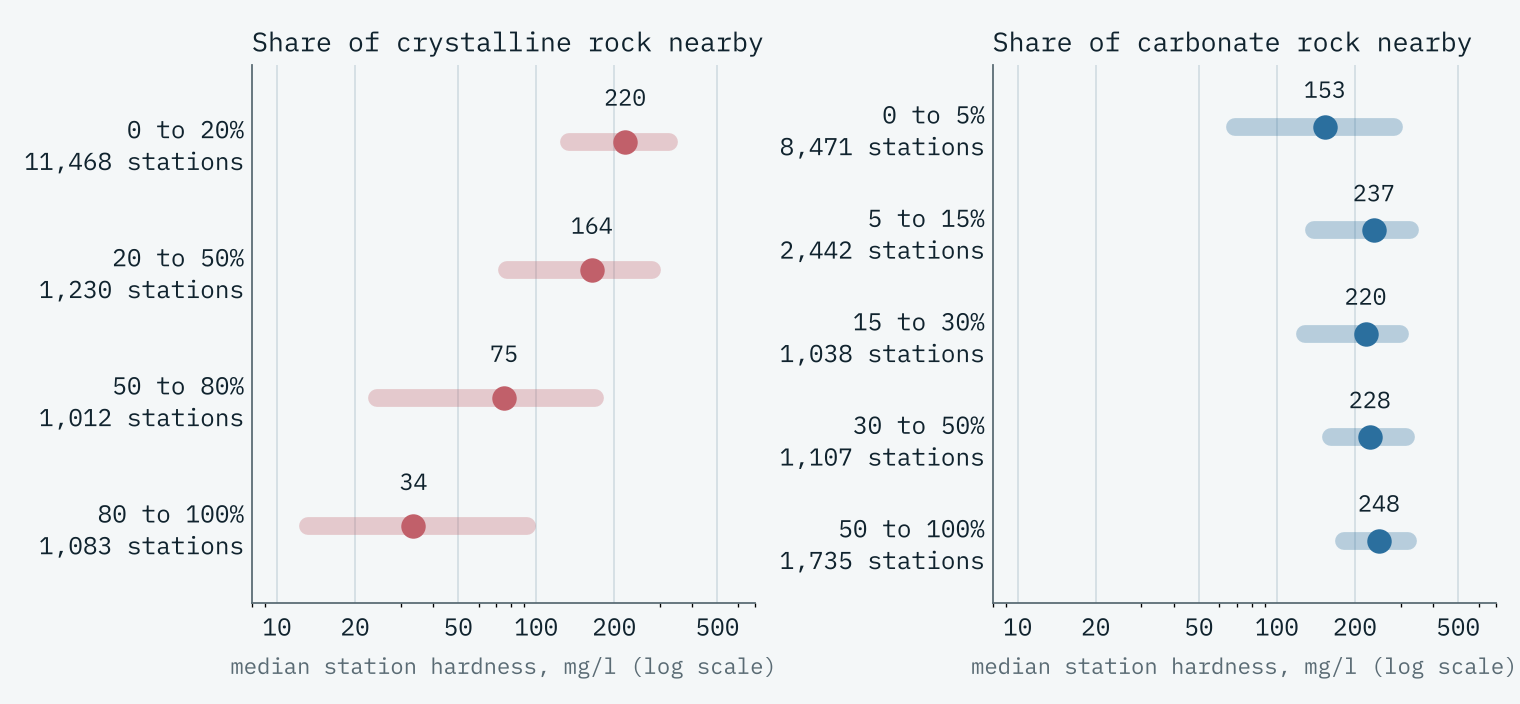
I then fitted a deliberately simple model: water from each rock group has a typical hardness, the groups mix in proportion to their share, wetter places are softer, and groundwater and lakes are allowed to differ from rivers. It says a river draining only granite and gneiss would carry about 22 mg/l, one draining only limestone and chalk about 211 mg/l, and every doubling of rainfall makes water about 21% softer.
How good is the guess?
Models are good at fooling their makers, so I tested this one the hard way. I cut the world into 5 by 5 degree squares, hid whole squares, and predicted every hidden station only from the others. On that test the model puts 29% of stations in exactly the right class and 64% within one class, against 38% for simply guessing the global median. It is typically out by a factor of 1.8. That is useful, not precise.
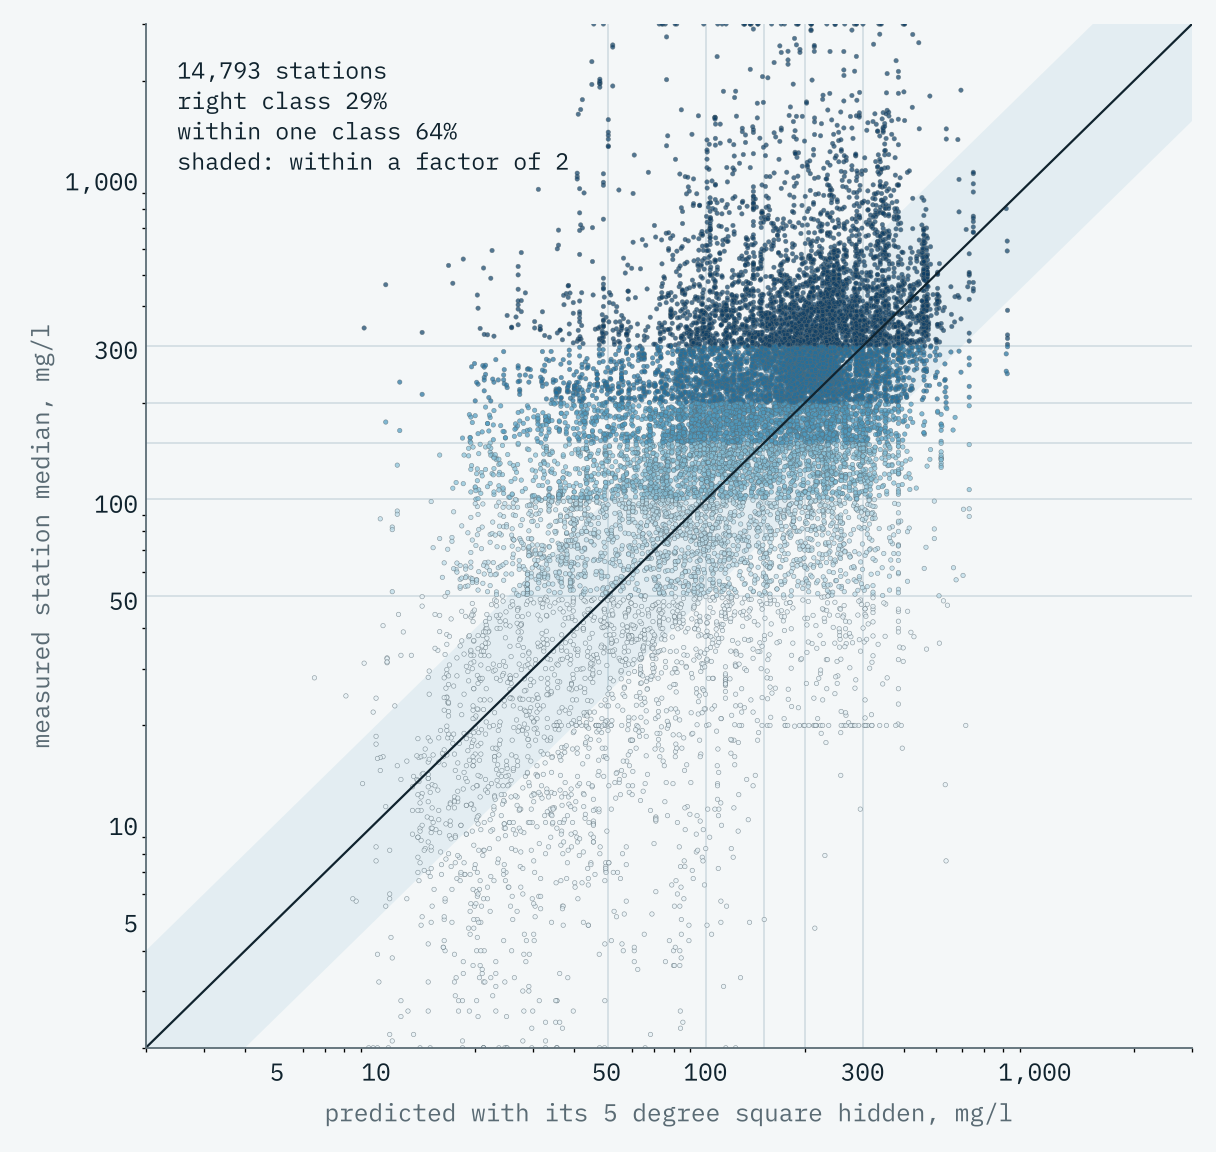
The best lesson is in the misses. On the Yucatán, where almost every well is very hard, the model guesses about 117 mg/l, because the world map I used describes that great slab of limestone only as “Eocene sedimentary”. About half of the world’s mapped land is described that vaguely, and in places the world map is stitched together from very coarse compilations whose straight edges show on the result. So I measured how much detailed geology sits behind each estimate: where it is mostly detailed, the model gets 68% of stations within one class; where it is mostly coarse, 56%. The map fades and hatches those low-confidence areas, 71% of the modelled land. A model is only as good as its map.
Hard rock makes soft water. And a model is only as good as its map.
A sharper look at home
Here is an awkward fact: the open archive has 388 stations in Ireland and not one in Great Britain. So for both islands I swapped the coarse world map for the British Geological Survey’s and Geological Survey Ireland’s detailed bedrock maps, at about 1 km, and calibrated the model on the Irish stations. It does far better there: 82% of Irish stations within one class, again tested on places it never saw.
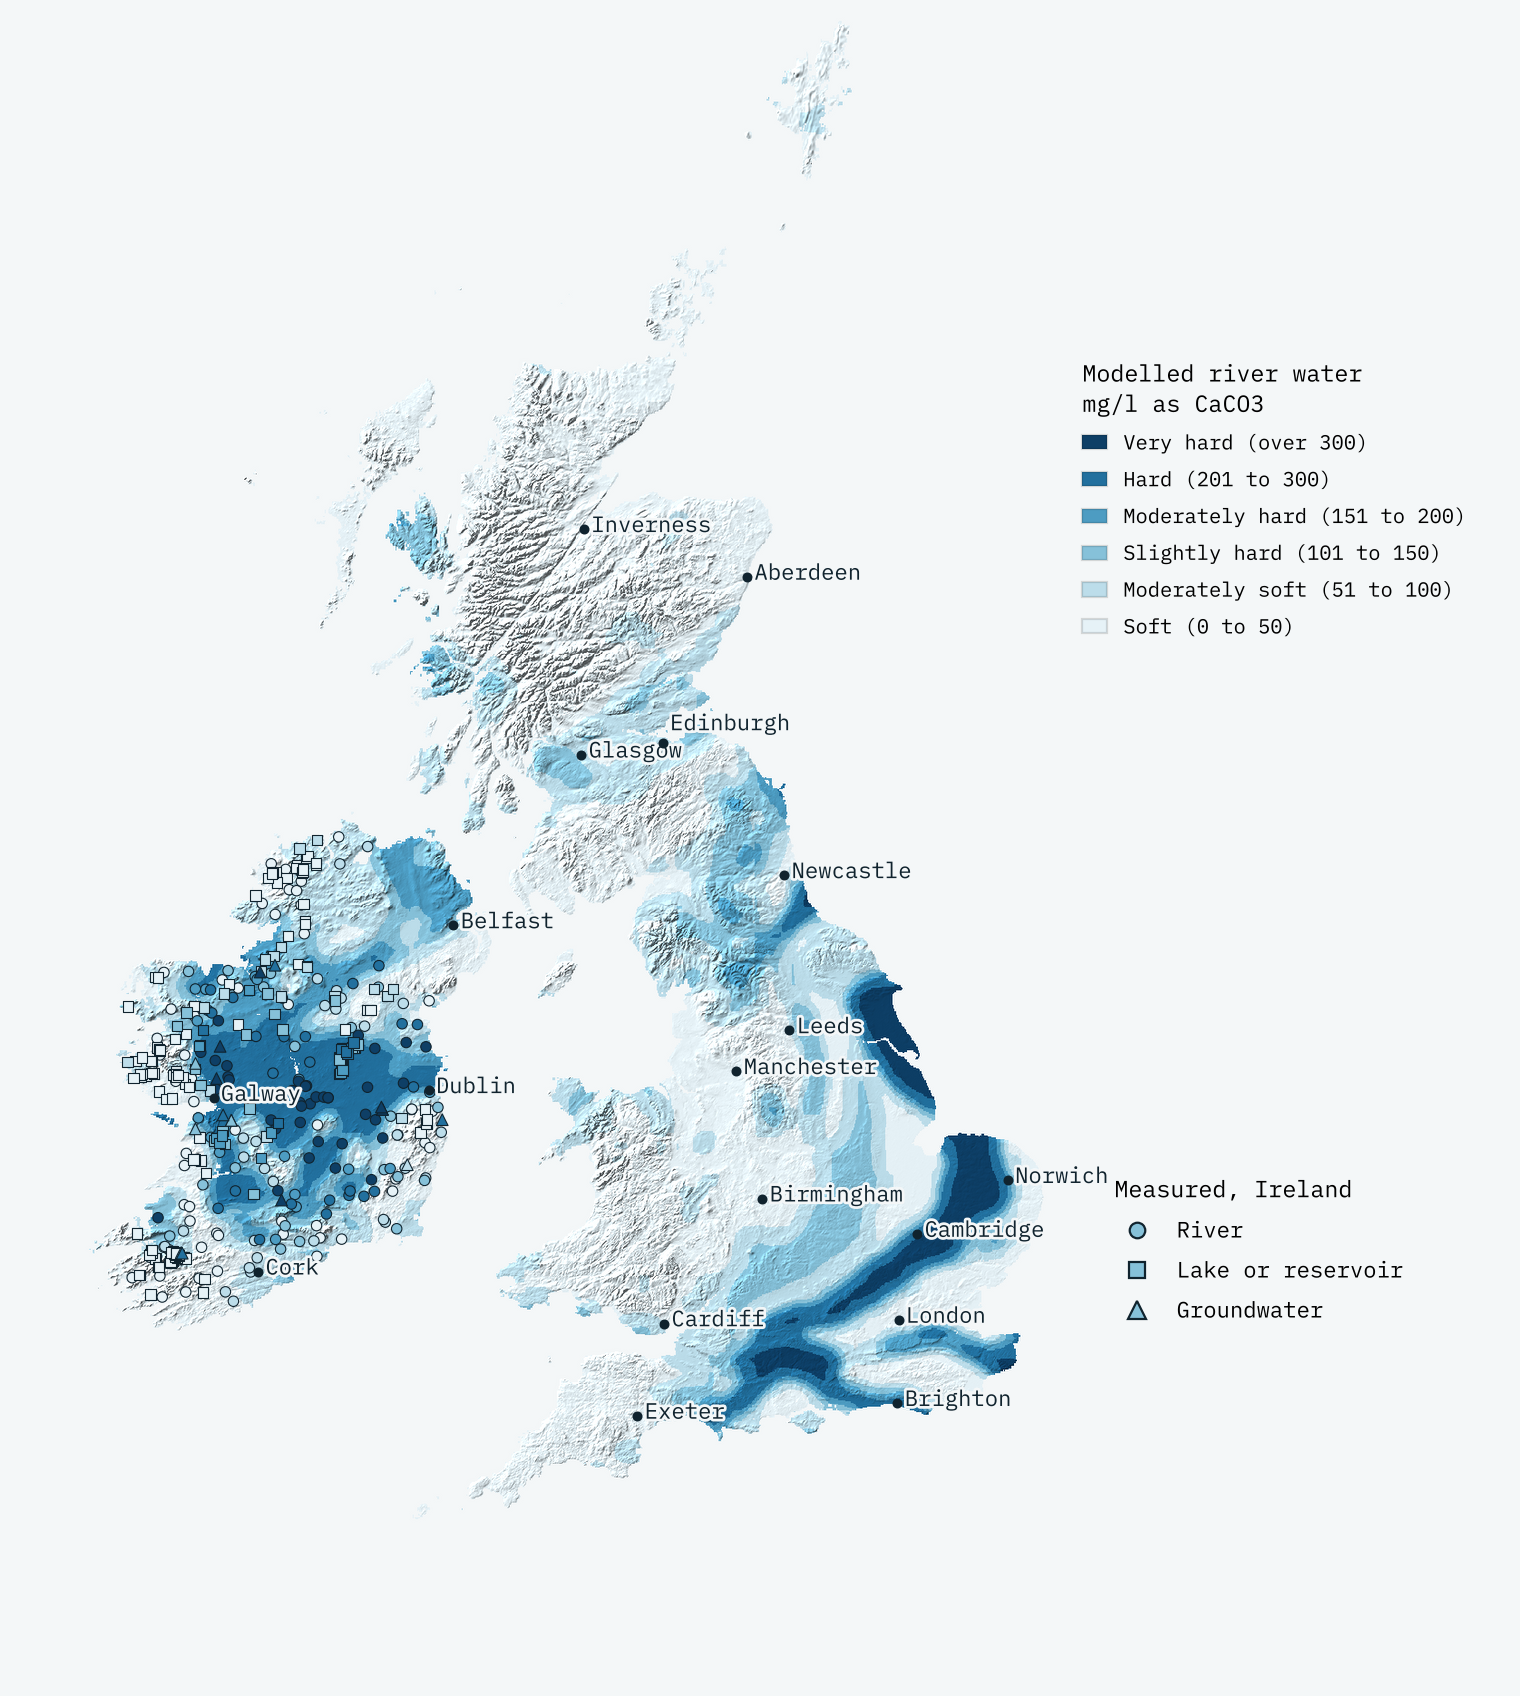
From rocks alone, the familiar map appears. South and east of a line from the Tees to the Exe the modelled median is 92 mg/l; north and west of it, 35 mg/l. The chalk lights up: East Riding of Yorkshire (330 mg/l), Hertfordshire and Norfolk come out hardest, and the Highlands and Islands softest, at about 20 mg/l. In Ireland the saucer shows: stations on mostly limestone have a median of 192 mg/l, those on almost none 17 mg/l.
But it also gets London wrong, at 40 mg/l. London sits on clay; its water comes from the chalk beneath it and from the Thames and the Lea, which gather hard water far upstream. Much of the Midlands sits on Mercia Mudstone, which hides gypsum my rock groups cannot see. Water travels; rocks do not. That is why this is not a tap water map, and why your water company’s postcode lookup is the one to trust. Surprisingly, there is no single open dataset of tap water hardness by supply zone for the UK to test against.
How I did this
Stations: UNEP GEMS/Water’s Global Freshwater Quality Archive, version 3, open subset (CC BY 4.0). Each sample is the measured total hardness or, failing that, 2.497 times calcium plus 4.118 times magnesium measured the same day; two countries that report hardness in other units use calcium and magnesium only. Rocks: Macrostrat’s world map tiles (CC BY 4.0), BGS Geology 625k (Open Government Licence) and GSI 1:500k bedrock. Rainfall: CRU CL 2.0, 1961 to 1990. The model is fitted to log hardness with stations weighted so dense networks do not dominate, and tested by spatial cross-validation. The interactive page lets you switch between measured and modelled layers, see where the model is wrong, click any station for its record over time, search any town, and switch between mg/l and German, English (Clark) and French degrees.
The usual caveats are big ones here. Monitoring stations are not taps. A circle of rock around a point is not a river’s catchment. The world geology is coarse. The estimate is an educated guess with its errors shown, not a measurement.
Notes and sources
- Water quality: UNEP GEMS/Water, Global Freshwater Quality Archive v3, open subset (CC BY 4.0).
- World geology: Macrostrat map tiles (CC BY 4.0), compiled from regional maps including the Geologic Map of North America and the Generalized Geology of the World.
- Britain: BGS Geology 625k, British Geological Survey (Open Government Licence v3.0). Ireland: Geological Survey Ireland and Geological Survey of Northern Ireland 1:500,000 bedrock (CC BY 4.0 and Open Government Licence).
- Rainfall: CRU CL 2.0 (New et al. 2002), via my Sun and rain study.
- Places and outlines: GeoNames (CC BY 4.0), Natural Earth (public domain), ONS boundaries (Open Government Licence). Hill shading: AWS Terrain Tiles.
- Paper, data and code: Zenodo and GitHub.
- I wrote the text, with drafting and editing assistance from Claude (Anthropic), which also helped prepare the analysis code. I reviewed and checked all text and results.

