
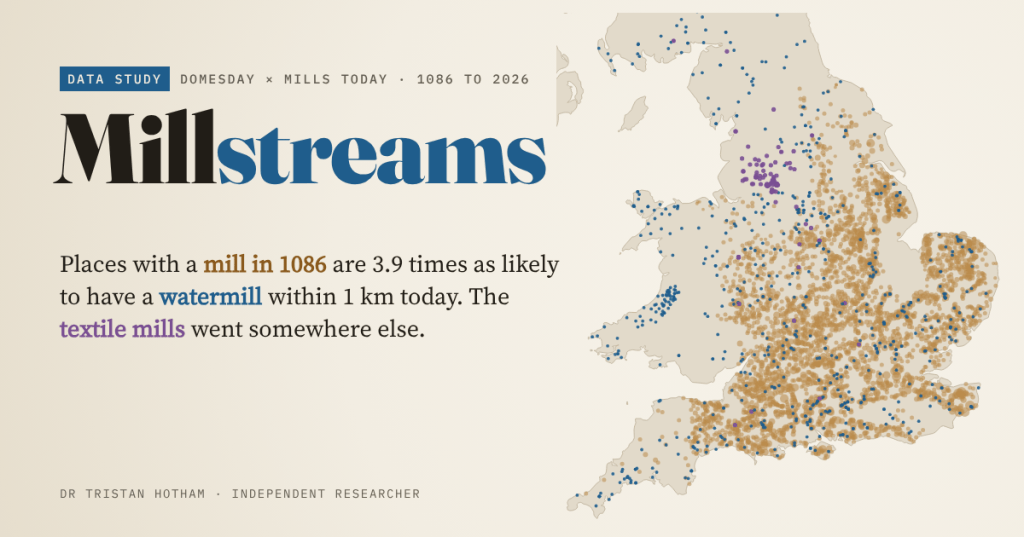
Domesday Book counted England’s mills in 1086. Nine hundred and forty years later, I went looking for them on today’s maps. The old watermill places are still marked by mills. The textile mills of the Industrial Revolution went somewhere else.
Tealby is a village in Lincolnshire. In 1086 Domesday Book recorded 52 households there and 16.5 mills, one of the highest counts of any place in England. Today a watermill is mapped 667 m from the centre of its Domesday grid square. Coincidence, or does a good mill site stay a mill site for nine centuries?
Mills are a lovely test of how long places last. A watermill needs a particular spot: a stream with enough fall, a weir, a channel to the wheel. Once those are dug, building again on the same spot is easier than starting somewhere new. And because Domesday recorded mills manor by manor, it gives a national “before” picture that open data can be set against.
How many mills?
The figure you usually read is 5,624 mills, and Wikipedia’s watermill article adds a later estimate of 6,082. Adding up every entry in the Hull Domesday Project’s coding, I get 6,172.25, in 4,160 entries. The quarter is not a typo: Domesday often records half a mill, or a share of one, and 241 entries do. How you count those shares, and mills that two lords held between them, explains most of the gap between the totals.
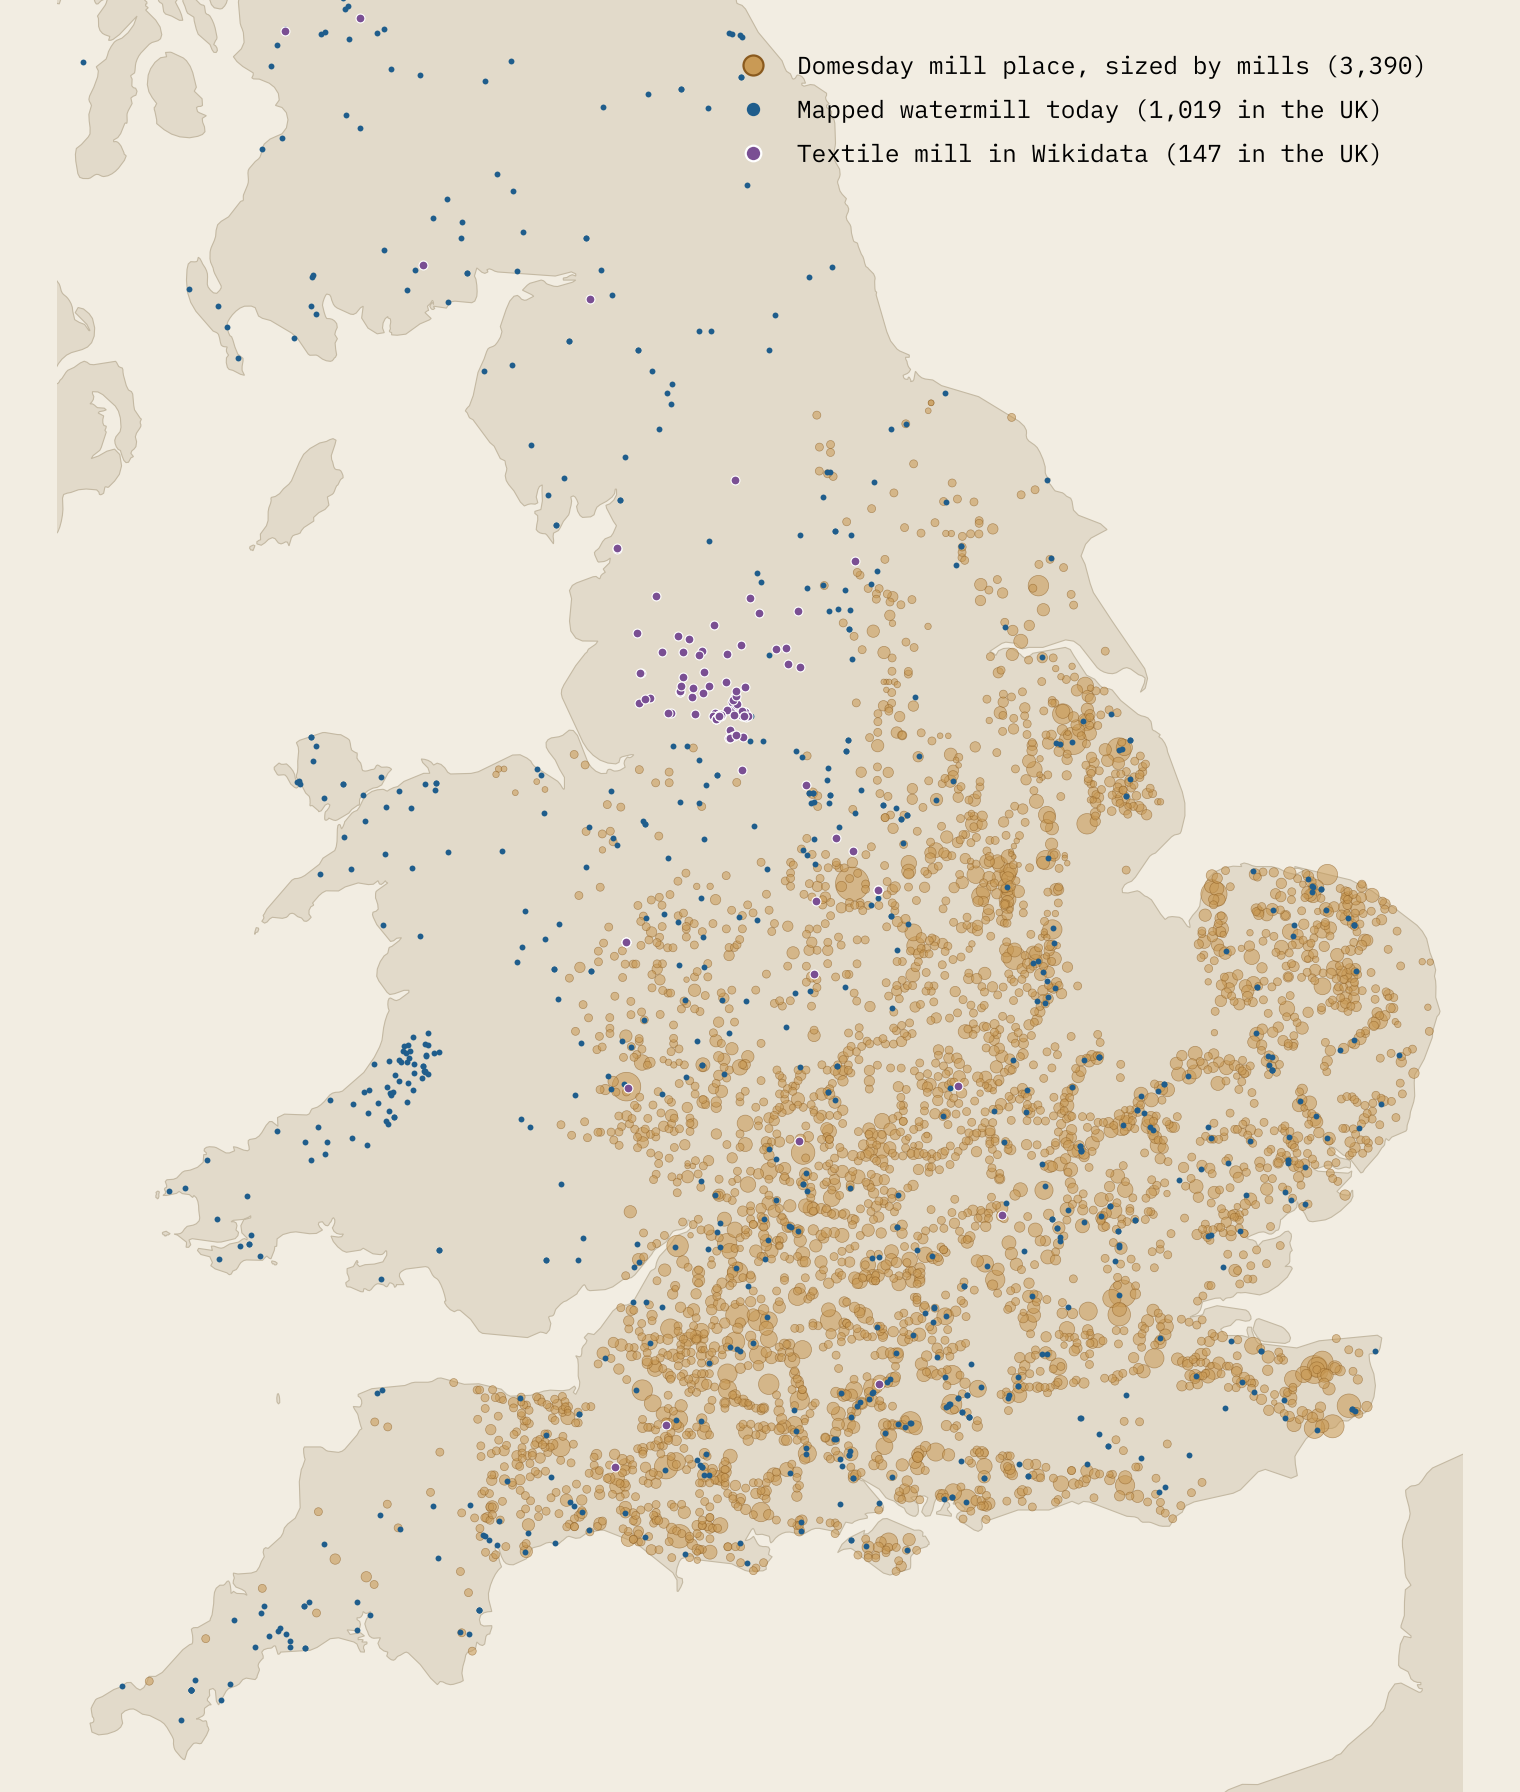
Norfolk has the most mills (528), then Lincolnshire and Wiltshire. But for its size Wiltshire is the mill county: 5.3 mills for every 100 recorded households, the highest rate anywhere. Giving each entry’s mills to the places it describes leaves 3,390 places with at least part of a mill, out of 11,892 Domesday places with a location.
The old mill places still have mills
For every Domesday place I measured the distance to the nearest modern trace of a mill: buildings mapped as watermills, windmills and other mills in OpenStreetMap and Wikidata, and features named Mill on the Ordnance Survey’s gazetteer. Within 1 km, 4.8% of the places that had a mill in 1086 have a mapped watermill today, against 1.2% of the places that did not. That is 3.9 times as many.
Mill places were bigger, and some counties are mapped much better than others, so I also compared each mill place with places of similar size in the same county. Against that local yardstick the mill places have 4.7 times the expected rate. A regression that also allows for distance to the nearest stream and the steepness of the ground gives an odds ratio of 3.59.
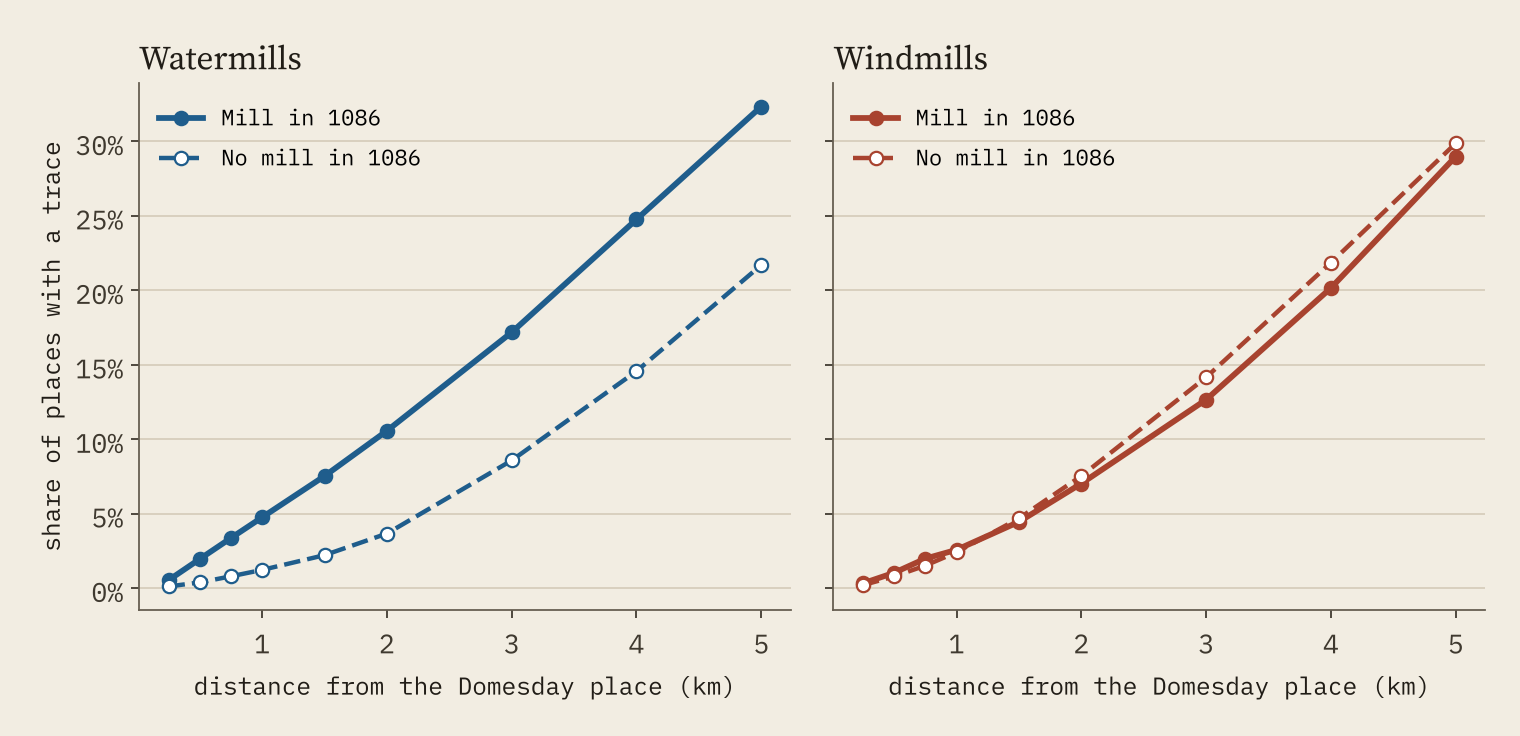
The right-hand chart is my favourite part. Windmills are a later technology: the earliest certain reference to one in northern Europe dates from 1185, a century after Domesday. So if the old mill places only had more mills because they were bigger villages, or better mapped, they should have more windmills too. They do not. 2.6% have a mapped windmill within 1 km, against 2.4% for other places, and after allowing for county and size the odds ratio is 0.75.
What lasts is the water-power site, not the idea of a mill.
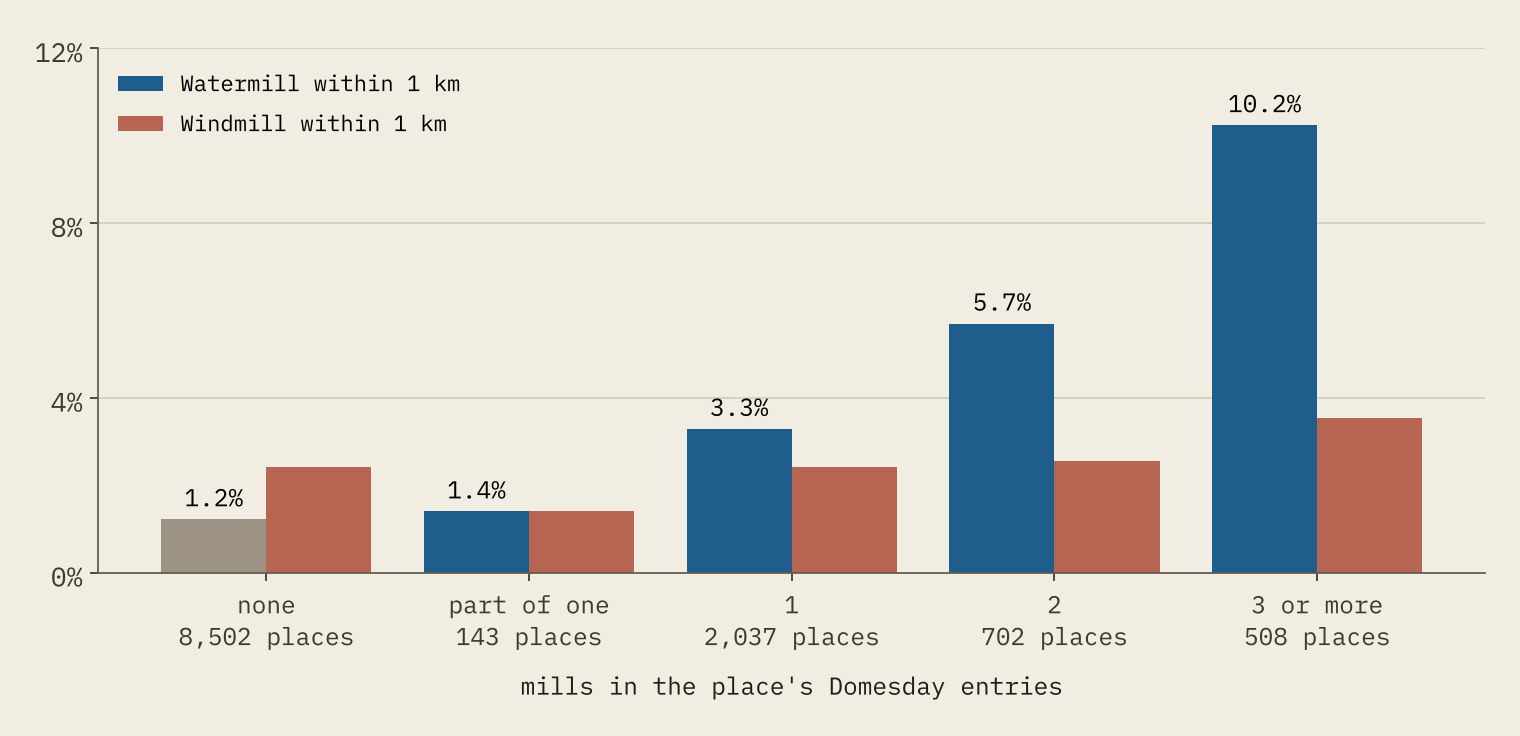
The more mills a place had, the stronger the link. Places with three or more mills in 1086 have a watermill within 1 km 10.2% of the time, 8.4 times the rate for places with none.
County by county the link is much weaker (a rank correlation of 0.30). Modern traces reflect how keenly each county’s mills have been mapped, and where later industry built. That is a useful warning about open data: compare like with like, inside a county, or you mostly measure the mappers.
The textile mills went somewhere else
Then the Industrial Revolution question. Did the cotton, wool, silk and flax mills reuse the old corn-mill places? Wikidata gives me 113 textile mills in England, and 83% of them are in the North West or Yorkshire. The median one stands 20.4 km from the nearest Domesday mill place. The median watermill stands 1.6 km away.
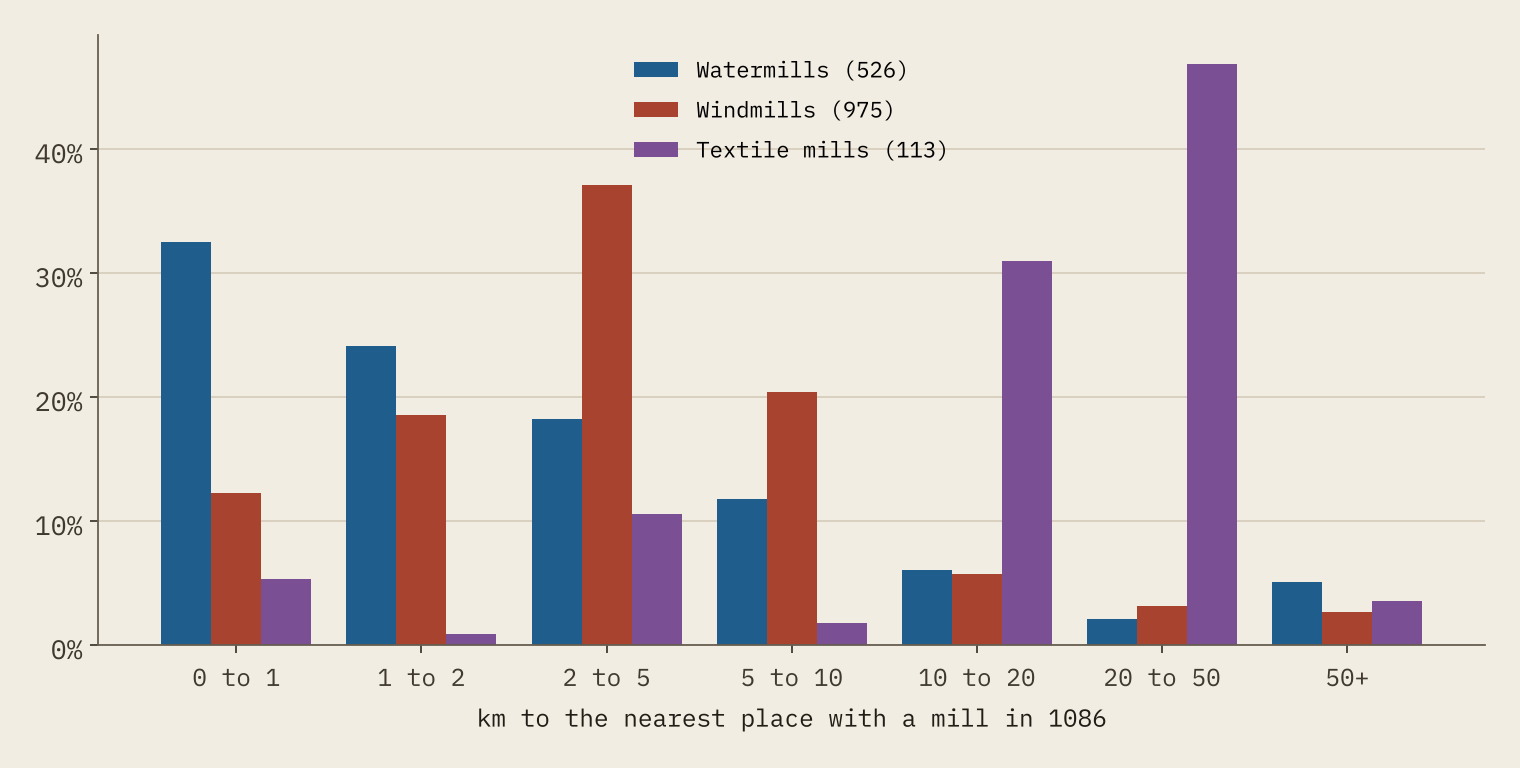
The main reason is that Domesday recorded almost no mills where the cotton industry grew. In the Domesday data the North West has 337 places and just 15 with a mill. The map of the north makes the point: the brown Domesday circles stop where the purple textile mills begin.
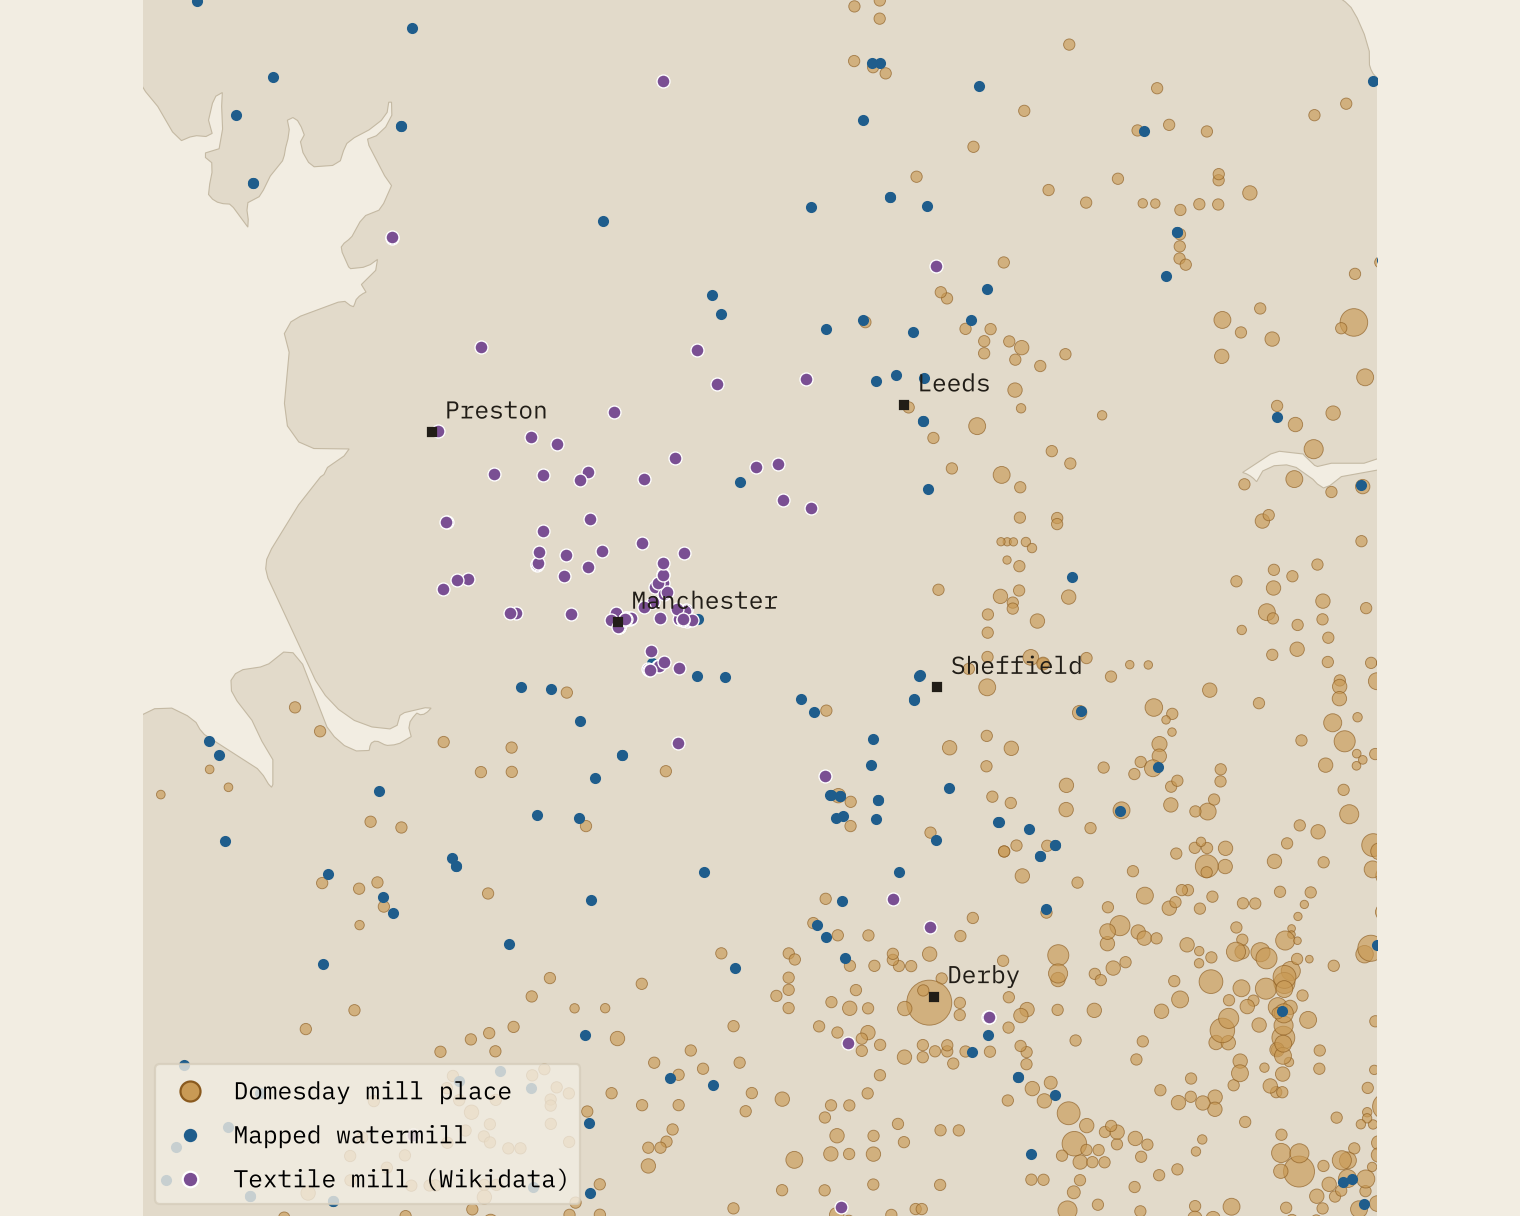
Even comparing like with like inside the North West and Yorkshire, none of the 94 northern textile mills is within 2 km of a Domesday mill place, against 17% of the watermills there. And only 35% of textile mills stand within 100 m of a watercourse on the Ordnance Survey’s river network, against 89% of watermills. The factories of the Industrial Revolution were a new geography laid over the old one, and the old one carried on.
How I did this
The Domesday figures are the Hull Domesday Project’s coding of every entry, via the realm-domesday repository and my Domesday Destiny study, with each place at the centre of its 1 km grid square. Modern mills come from OpenStreetMap (1,101 objects) and Wikidata (3,331 items), and Mill names from OS Open Names (1,617 features). Rivers are from OS Open Rivers and terrain from the Mapzen terrain tiles.
These are traces of mills, not a census. Open data hold the mills someone has mapped or listed, and coverage is uneven, which is why every comparison is made within counties. Distances under about 700 m are within the precision of a Domesday grid square. I cannot tell water-powered from steam-powered textile mills, and the textile list is small. And a watermill near a Domesday mill place fits continuity of the site; it does not prove it is the same mill.
Notes and sources
- Domesday: Hull Domesday Project, Professor J.J.N. Palmer, George Slater and the University of Hull (CC BY-NC-SA), via realm-domesday and Open Domesday.
- Modern mills: © OpenStreetMap contributors (ODbL) and Wikidata (CC0), retrieved 28 October 2026.
- Names and rivers: OS Open Names and OS Open Rivers. Contains OS data © Crown copyright and database right 2026 (Open Government Licence v3.0).
- Context: Wikipedia, Domesday Book, Watermill and Windmill (CC BY-SA 4.0).
- Paper, data and code: Zenodo and GitHub. Derived data CC BY-NC-SA 4.0; code MIT.
- I wrote the text, with drafting and editing assistance from Claude (Anthropic), which also helped prepare the analysis code. I reviewed and checked all text and results.

