
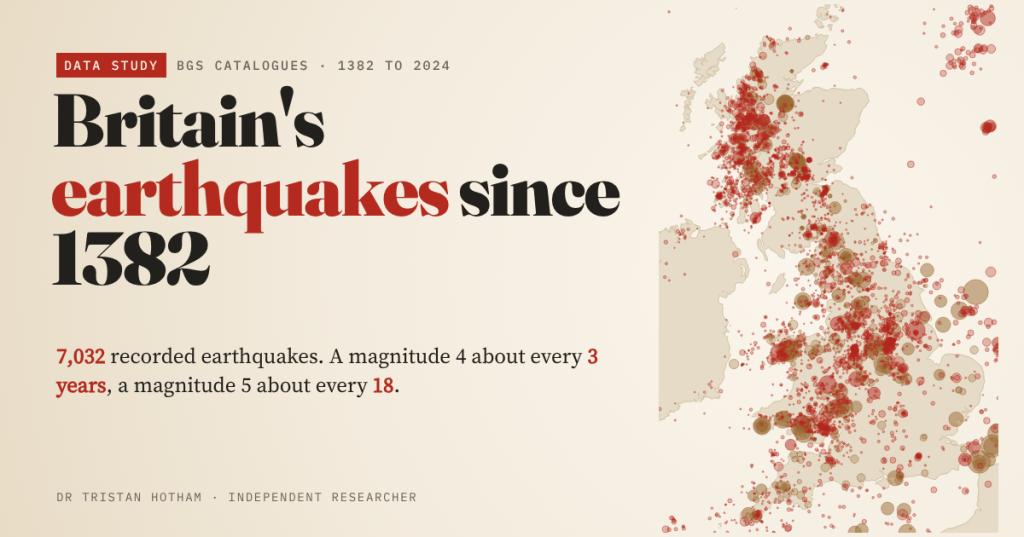
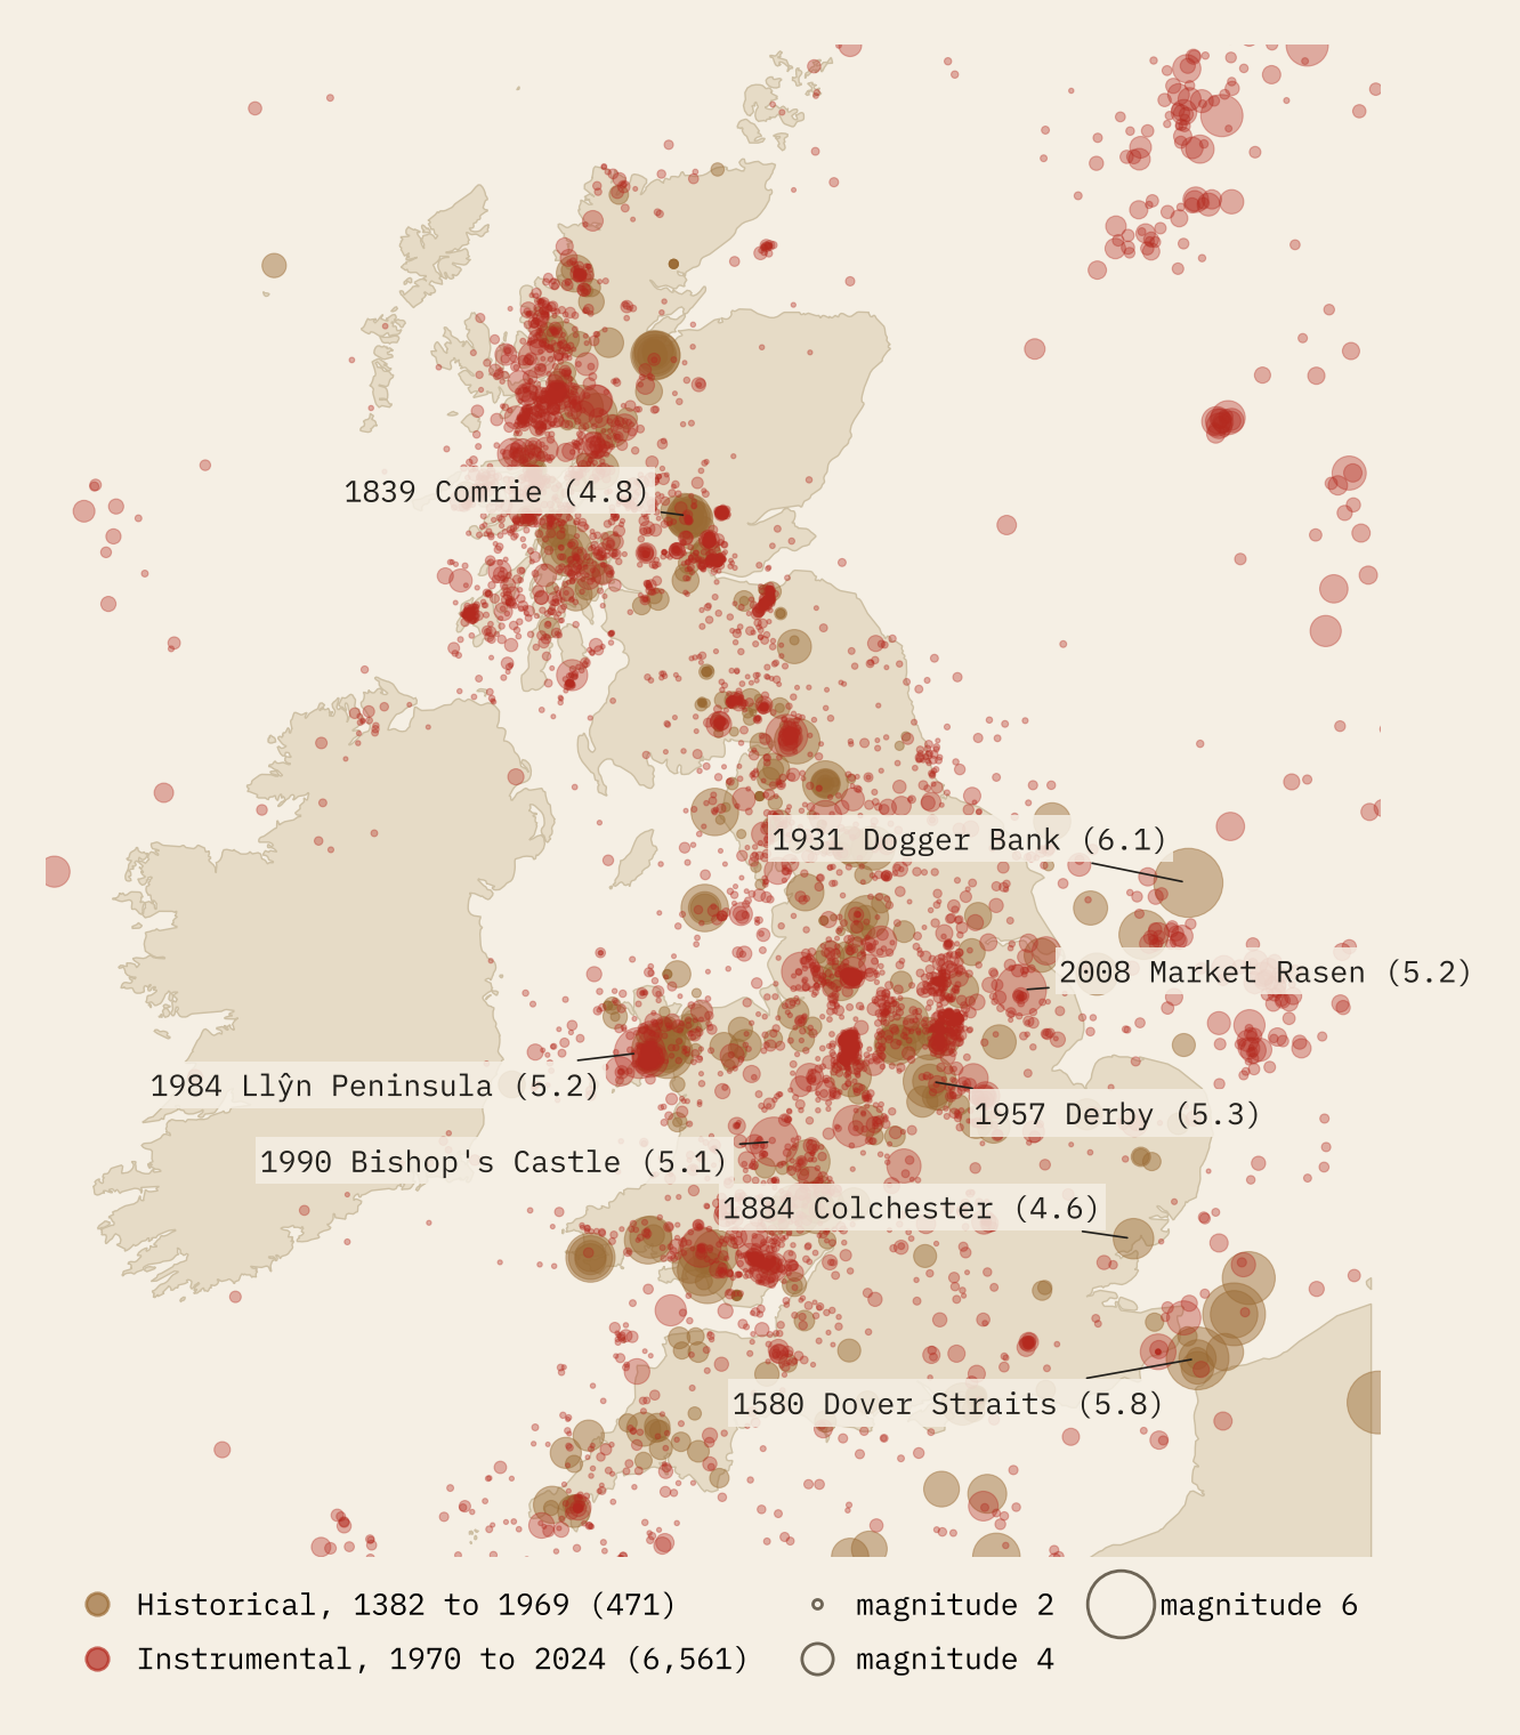
Britain is not supposed to have earthquakes. It has thousands. I put every one in the British Geological Survey’s two catalogues on one map, from the Dover Straits shock of 1382 to 2024: 7,032 earthquakes. Here is where they happen, how often a big one comes, and why the busiest earthquake zones of modern Britain were made by coal miners.
At about six in the evening of 6 April 1580, in Easter week, the ground shook in London. The shock was felt across south-east England, Flanders and northern France, and two people were killed in England. The British Geological Survey puts it in the Strait of Dover at magnitude 5.8. Two centuries earlier, in 1382, the same straits had shaken hard enough to damage Canterbury Cathedral and to interrupt a church council in London, which has been known ever since as the Earthquake Synod.
Britain sits in the middle of a tectonic plate, a long way from the plate edges where the world’s great earthquakes happen, so its earthquakes are small. But they are not rare. The BGS keeps two lists: a historical catalogue of 471 earthquakes from 1382 to 1969, reconstructed from what people wrote about the shaking, and an instrumental catalogue of earthquakes recorded by seismometers since 1970. After removing 1,273 duplicate rows, that second list holds 6,561 earthquakes up to 2 September 2024. 5,513 of all the earthquakes lie on land in Britain or within 20 km of its coast.
The big ones
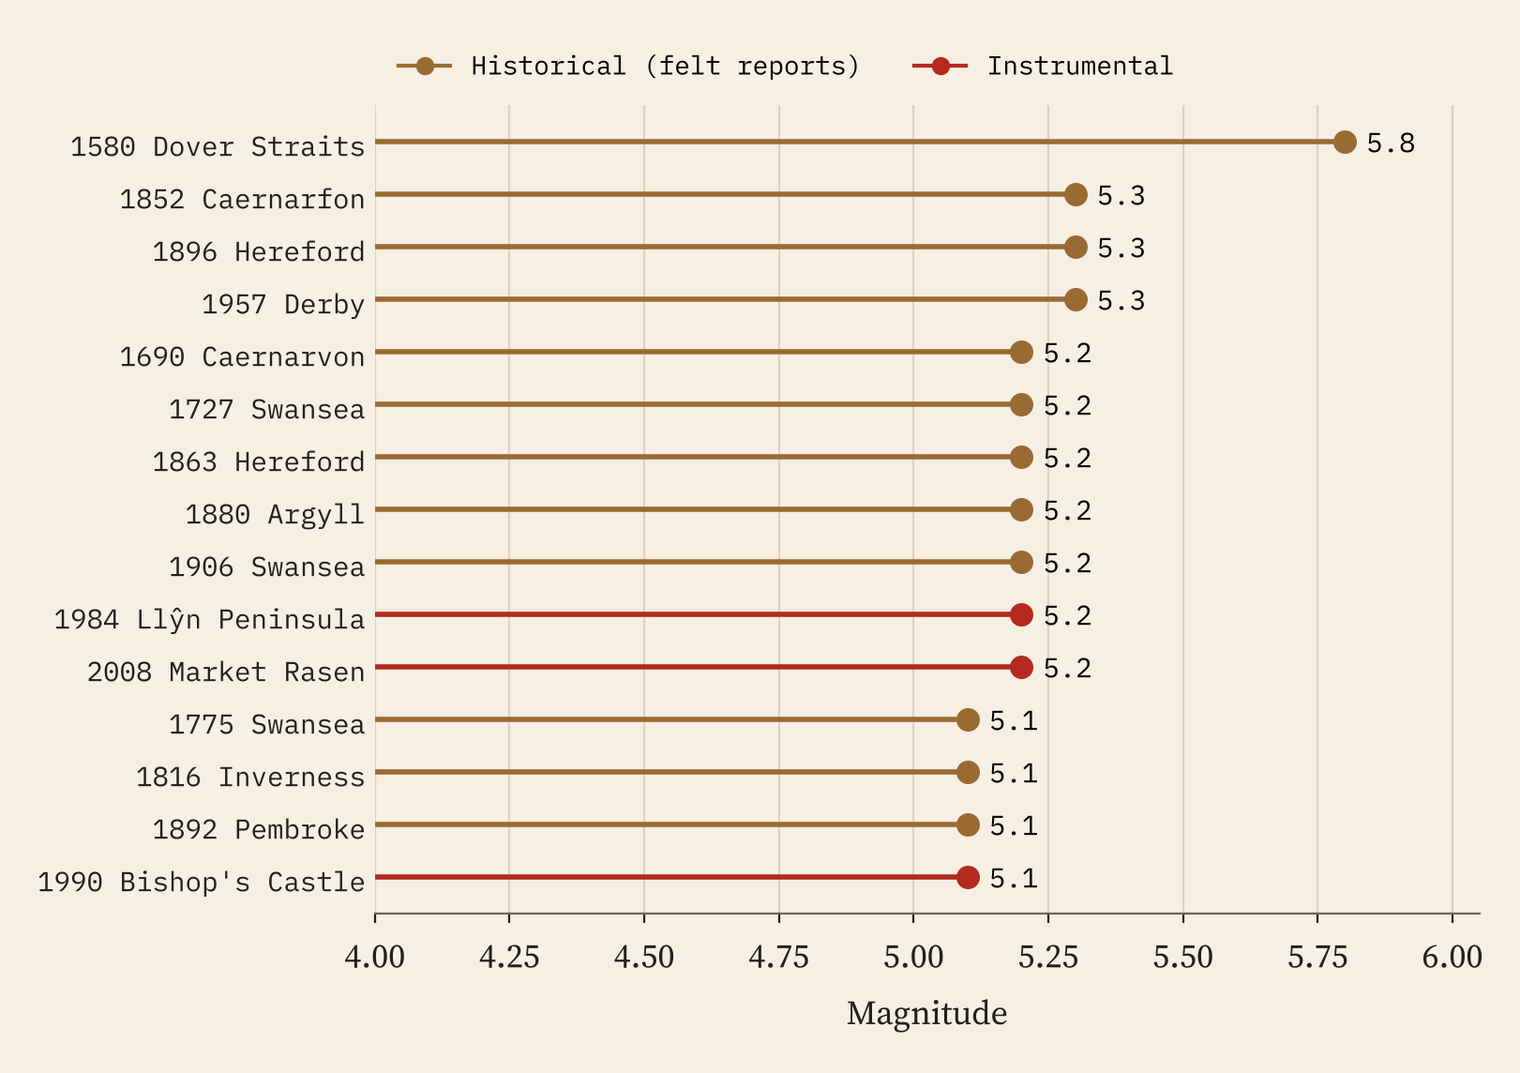
The biggest of all is offshore: the Dogger Bank earthquake of 7 June 1931, magnitude 6.1. It twisted a church spire at Filey, brought down chimneys in Hull and, at Madame Tussauds in London, knocked the head off Dr Crippen’s waxwork. On land, three historical earthquakes share the record at 5.3: Caernarfon in 1852, Hereford in 1896 and Derby in 1957. The biggest measured by instruments are Market Rasen in 2008, felt from Hampshire to Newcastle, and the Llŷn Peninsula in 1984, both 5.2 in the BGS catalogue (the Llŷn one is often quoted as 5.4).
The worst damage came from smaller but shallower shocks right under towns. The Colchester earthquake of 1884, only magnitude 4.6, damaged about 1,250 buildings in Colchester and the villages towards the coast. In 2007 a 4.3 centred just north of Folkestone left 474 properties reported damaged.
The busiest earthquake zones were coalfields
I counted the instrumentally recorded earthquakes in every 20 km square of Britain. Some of the busy squares are what you would expect: the Llŷn Peninsula, the western Highlands around Fort William, and Comrie in Perthshire, the “Shaky Toun”, which had 19 earthquakes within 10 km in the swarm of 1839 to 1846 alone. But the four busiest squares in Britain are Midlothian, the Potteries around Kidsgrove and Stoke-on-Trent, Clackmannanshire and north Nottinghamshire. All four are coalfields.
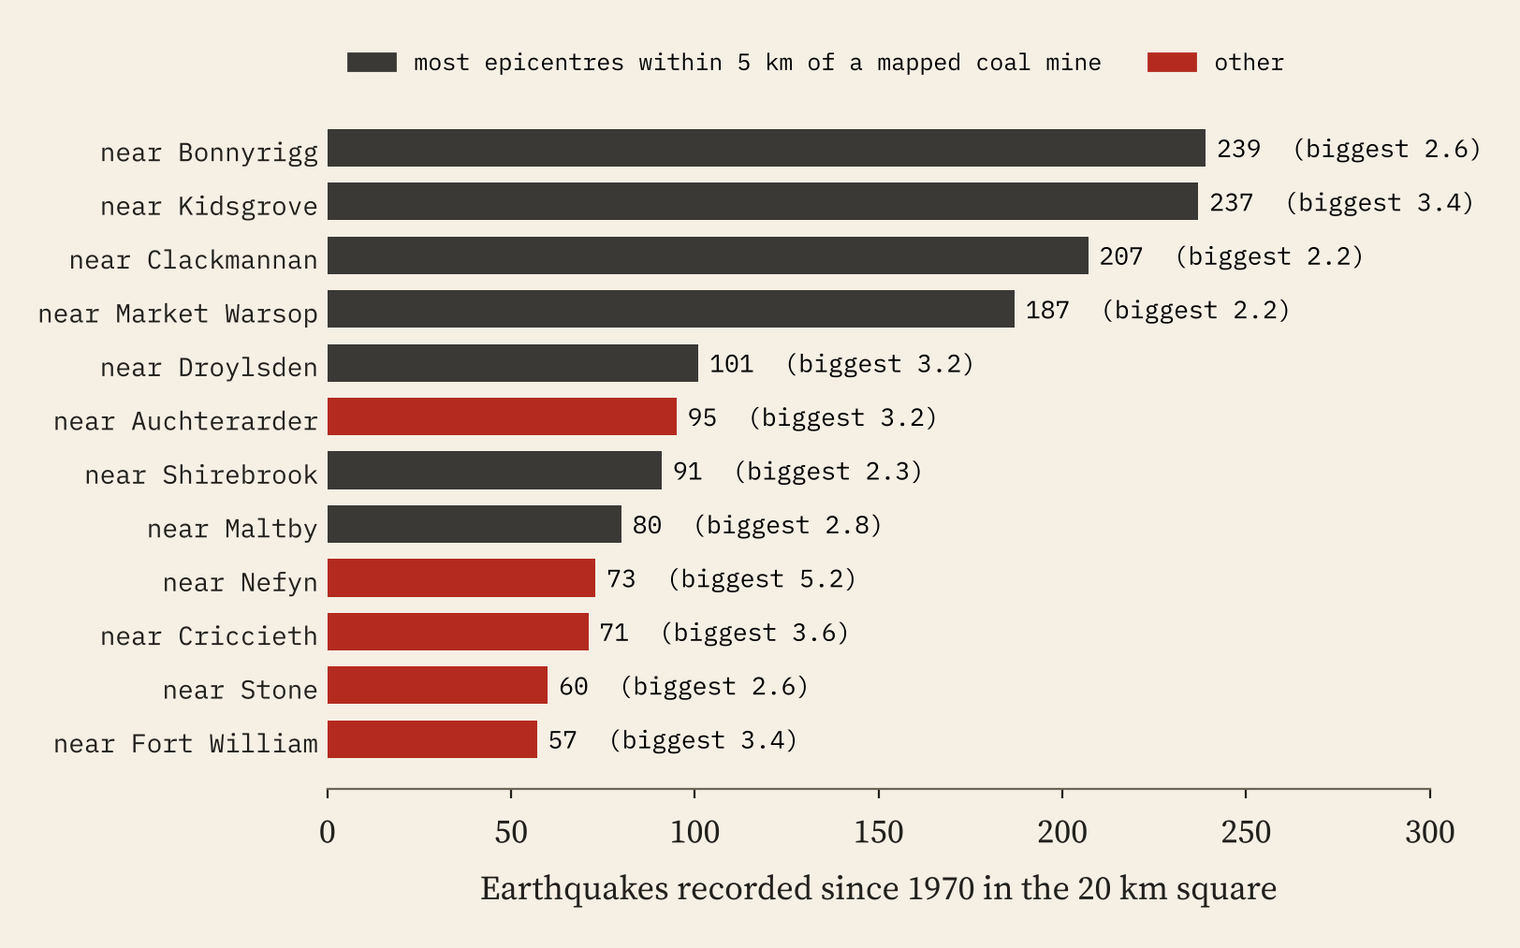
When coal is dug out from deep underground, the rock above settles and the stresses shift, and small earthquakes can follow. The BGS catalogue does not say which earthquakes were induced, but the fingerprints are clear. From 1970 to 2014, 40% of onshore earthquakes in Britain had epicentres within 5 km of a coal mine mapped in OpenStreetMap, even though only 10% of Britain’s land is that close to one. Those near-mine earthquakes were shallow, with a median depth of 1.7 km against 7.4 km for the rest. They kept to the working week: only 19% fell on a Saturday or Sunday, against 27% of other earthquakes and the 29% you would expect by chance. And when the last deep mines closed in 2015, they faded.
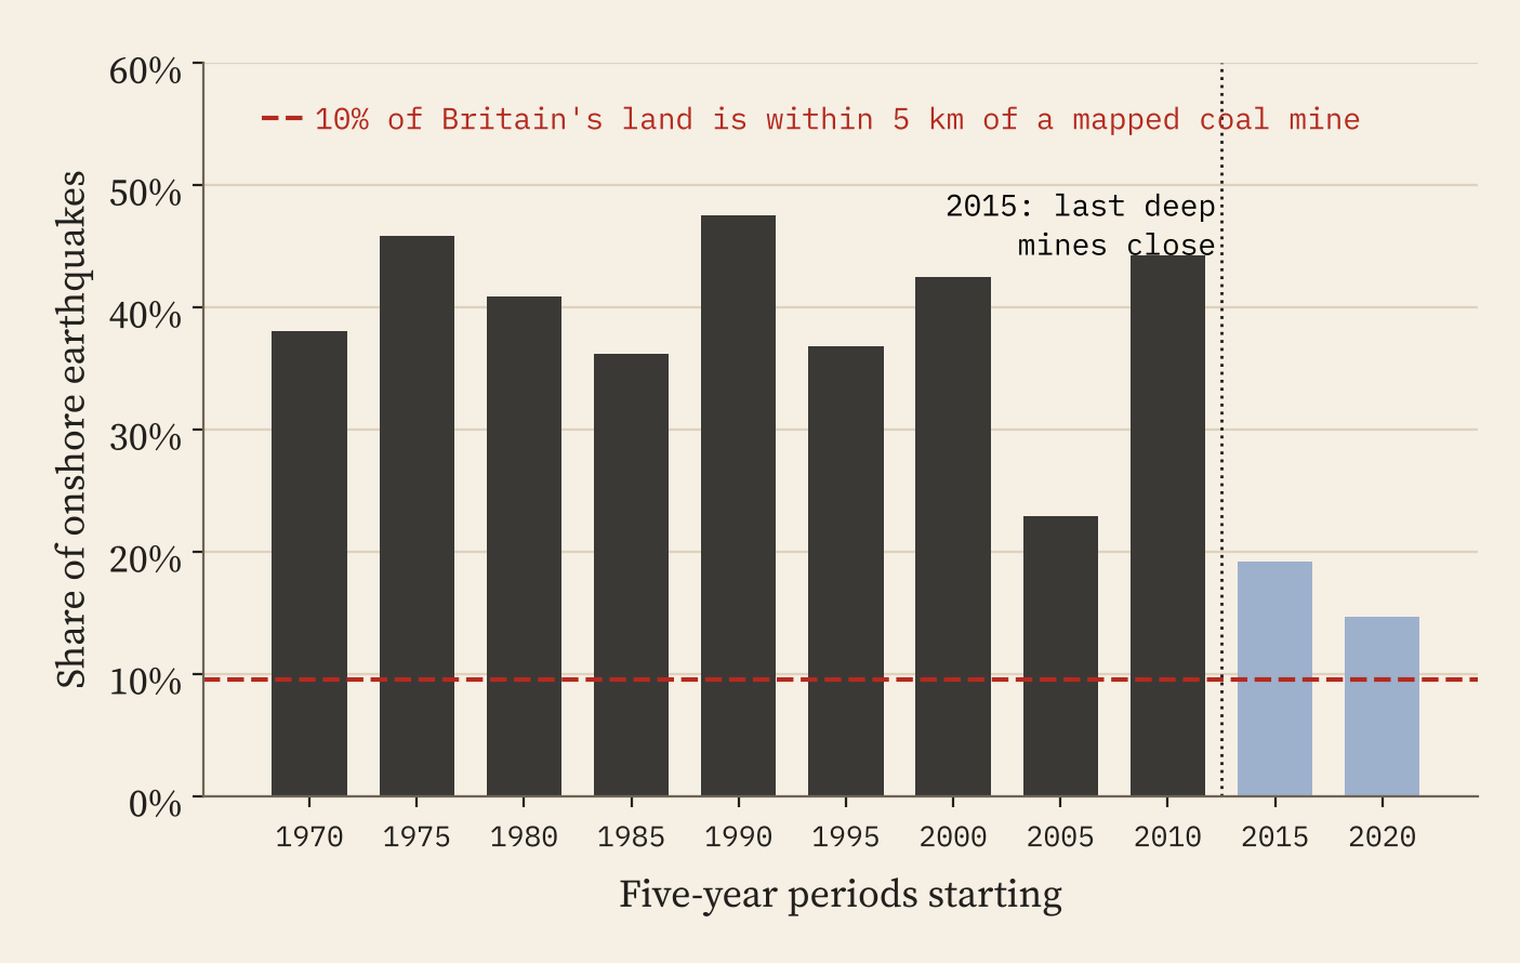
The busiest earthquake zones in modern Britain were made by people.
One oddity: the small earthquakes set off by fracking near Blackpool, a 2.3 in 2011 and a 2.9 in 2019, are not in the catalogue layer I used. I report them from published accounts, and anyone using these data should know that induced events may be kept separately.
How often does a big one come?
Seismologists use the Gutenberg-Richter law: each step up in magnitude makes earthquakes roughly ten times rarer. Fitting it to the 802 British earthquakes of magnitude 2.0 or more since 1980 gives a slope (the b-value) of 0.92, close to the global norm. It predicts a magnitude 4 or bigger in Britain about every 3.9 years and a magnitude 5 about every 32 years.
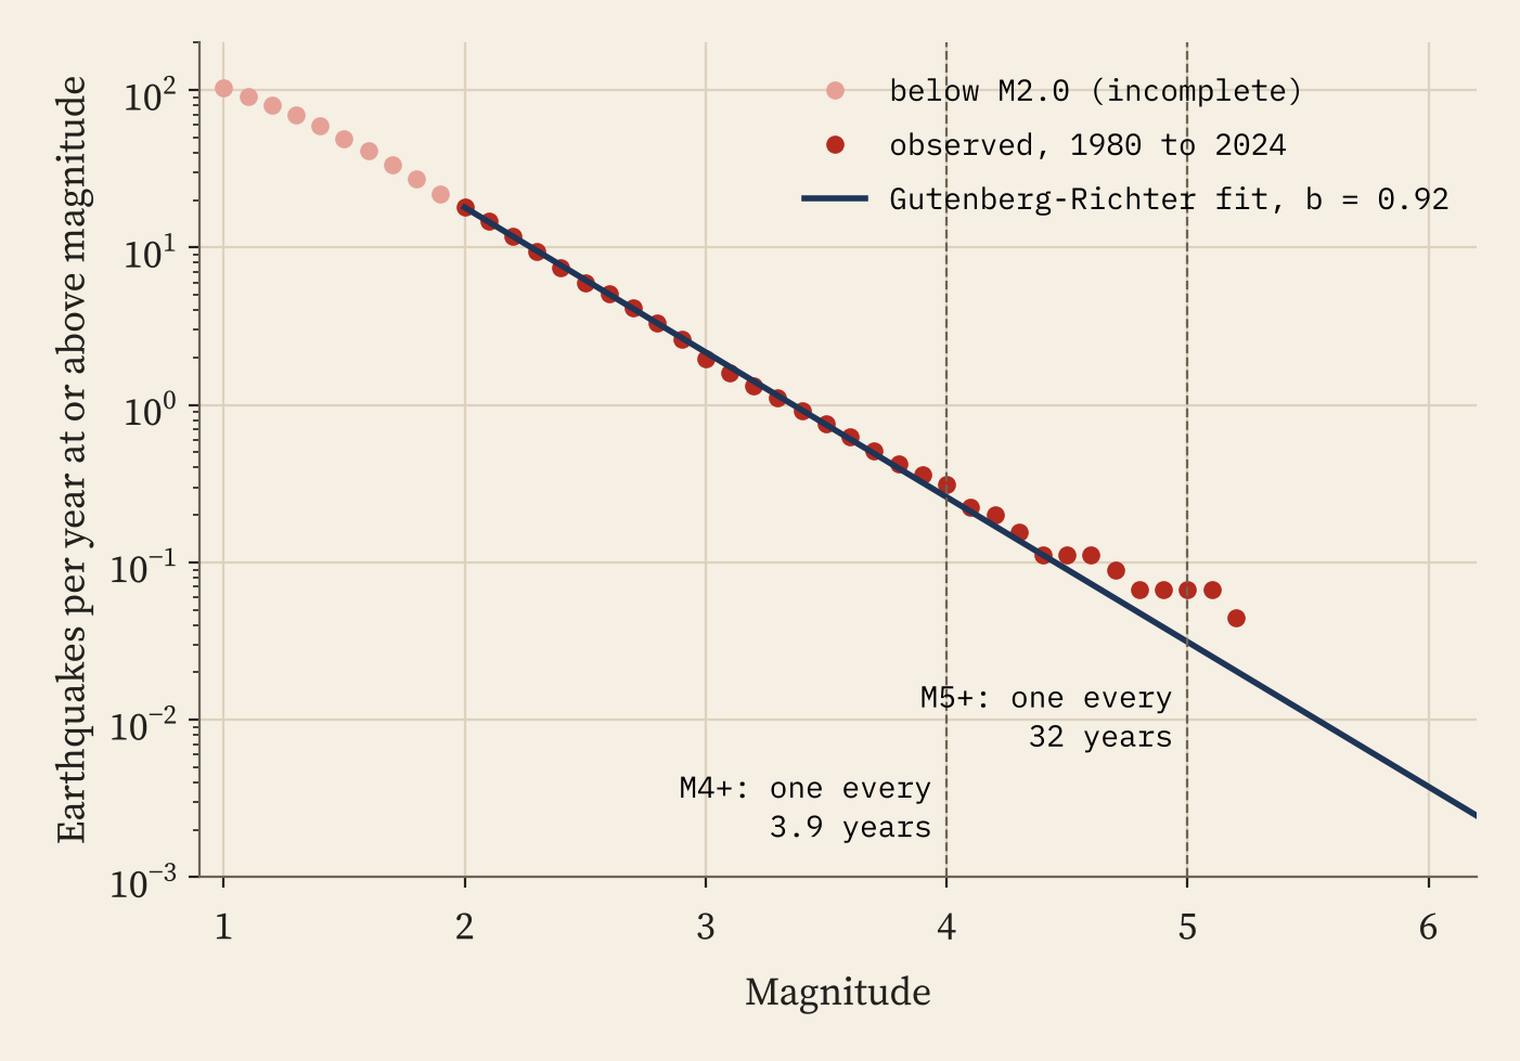
The long record agrees for magnitude 4: the two catalogues hold 91 earthquakes of magnitude 4 or more in Britain since 1750, one every 3.0 years. But they hold 15 of magnitude 5 or more, one every 18 years, more than the fit predicts. Either big earthquakes are a little commoner than small ones suggest, or the magnitudes worked out from historical felt reports run a little high. With so few big events, nobody can yet say which.
More earthquakes, or better ears?
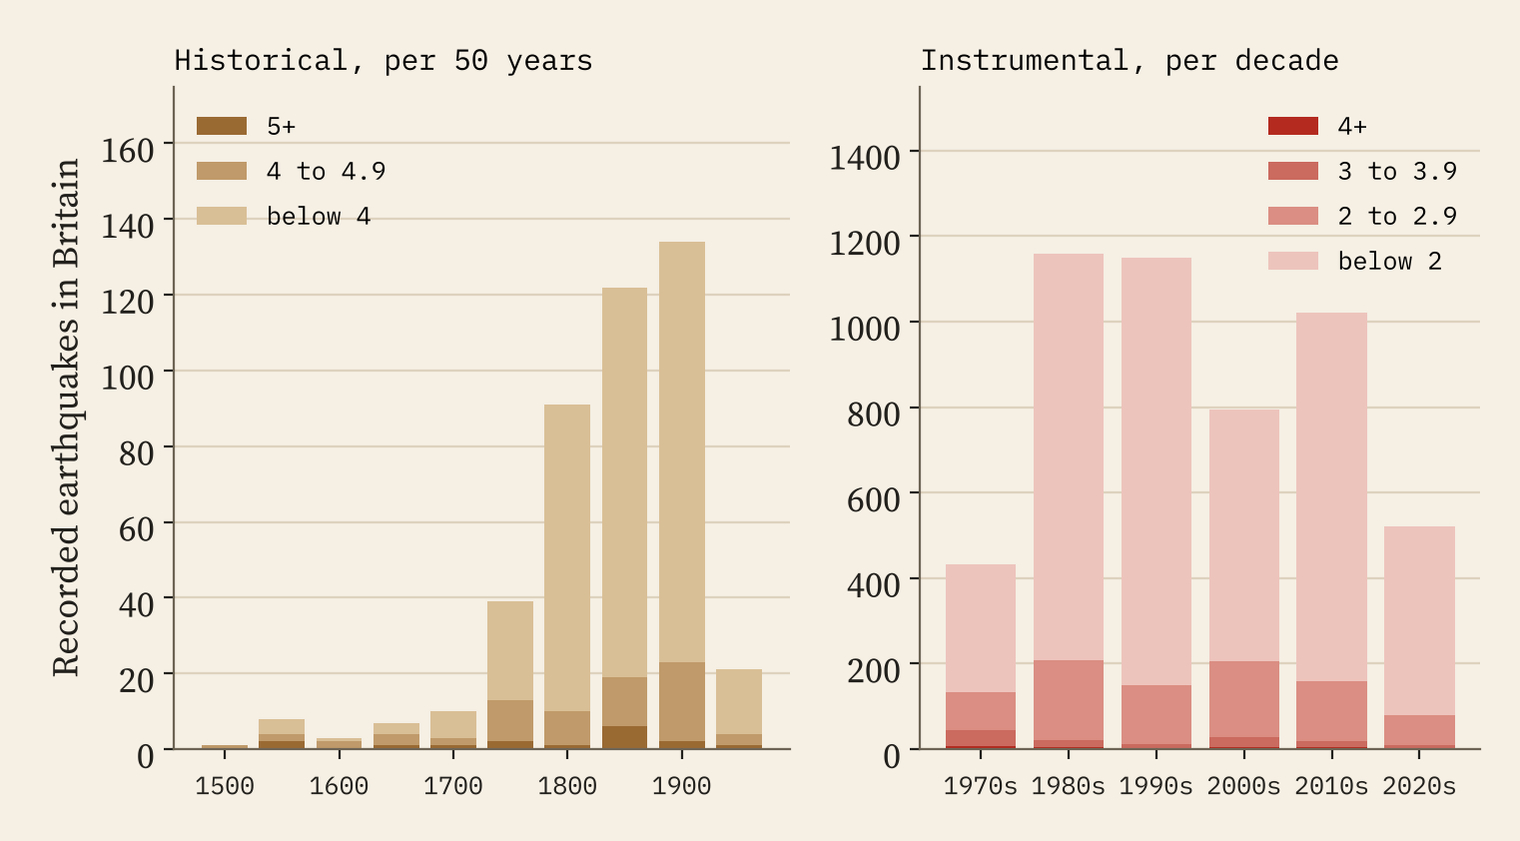
The record grows over time, but mostly because we got better at listening. Before 1700 the historical catalogue includes only earthquakes of magnitude 4 or more; just 19 in Britain survive. Newspapers caught many more small shocks in the 1800s. Since 1970 the seismometer network has kept growing: in the 1970s 69% of recorded British earthquakes were below magnitude 2, and by the 1990s 87%. The number of magnitude 3 or bigger did not rise at all.
The biggest earthquake near you
The interactive map lets you type any town or village and see the biggest earthquake recorded near it. Of 1,426 cities and towns, 41% have had a magnitude 4 or more within 25 km and 125 have had a magnitude 5. Leicester, Derby and Nottingham all sit within 25 km of the 5.3 of 1957; Lincoln of Market Rasen’s 5.2. London’s biggest within 25 km is a 3.1 in 1750, one of two London shocks a month apart that year. Only 46 towns have no recorded earthquake within 25 km at all, among them Aberdeen and St Albans.
How I did this
I downloaded the BGS historical and instrumental catalogues from the BGS map services, merged them, removed duplicate rows (the same event entered by the automatic system and again by an analyst) and placed each epicentre on land, near the coast or offshore using the Natural Earth outline, with its nearest town from OS Open Names. The b-value uses Aki’s maximum likelihood method above magnitude 2.0, where the estimate is stable. Coal mines are OpenStreetMap features named as collieries, coal mines or pits. Historical magnitudes and locations are estimates from felt reports, the instrumental layer starts at magnitude 1.0, and closeness to a mapped mine is an indicator of mining-induced seismicity, not proof.
Notes and sources
- Earthquakes: British Geological Survey, UK historical earthquake catalogue and UK modern recorded earthquake catalogue, via the BGS map services, retrieved 28 October 2026. Contains British Geological Survey materials © UKRI 2026.
- Places: OS Open Names, contains OS data © Crown copyright and database right 2026, Open Government Licence v3.0. Coal mines: © OpenStreetMap contributors, ODbL. Coastline: Natural Earth.
- Stories: Wikipedia, List of earthquakes in the British Isles and the articles on the 1382 and 1580 Dover Straits, 1884 Colchester, 1931 Dogger Bank, 1984 Llŷn Peninsula, 2007 Kent and 2008 Market Rasen earthquakes and on fracking in the United Kingdom (CC BY-SA 4.0); Undiscovered Scotland on Comrie’s Earthquake House.
- Paper, data and code: Zenodo and GitHub.
- I wrote the text, with drafting and editing assistance from Claude (Anthropic), which also helped prepare the analysis code. I reviewed and checked all text and results.

