
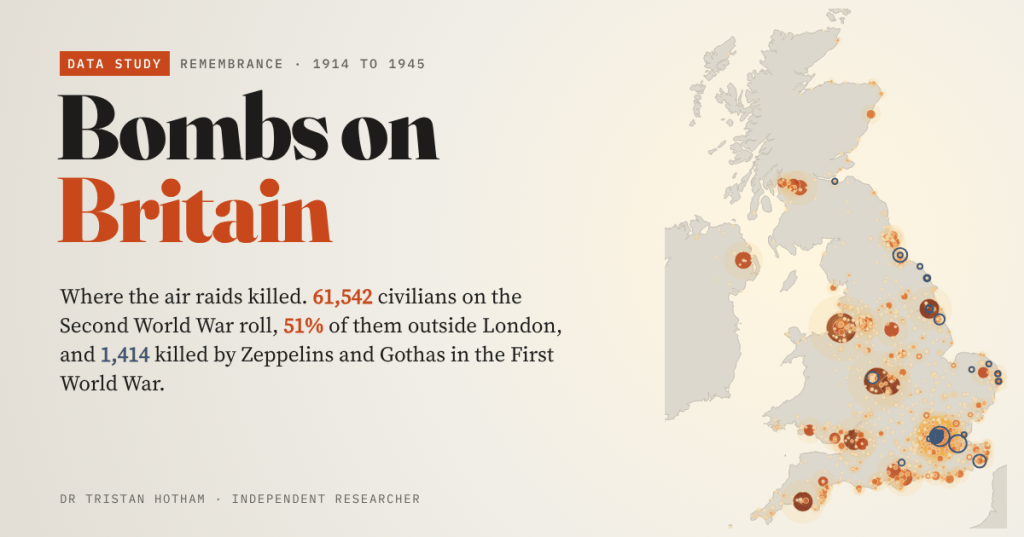
We remember the Blitz as London’s. I counted every civilian on the Commonwealth War Graves Commission’s roll of the Second World War dead, town by town and day by day, and put the First World War raids beside them. More than half of the dead were outside the capital.
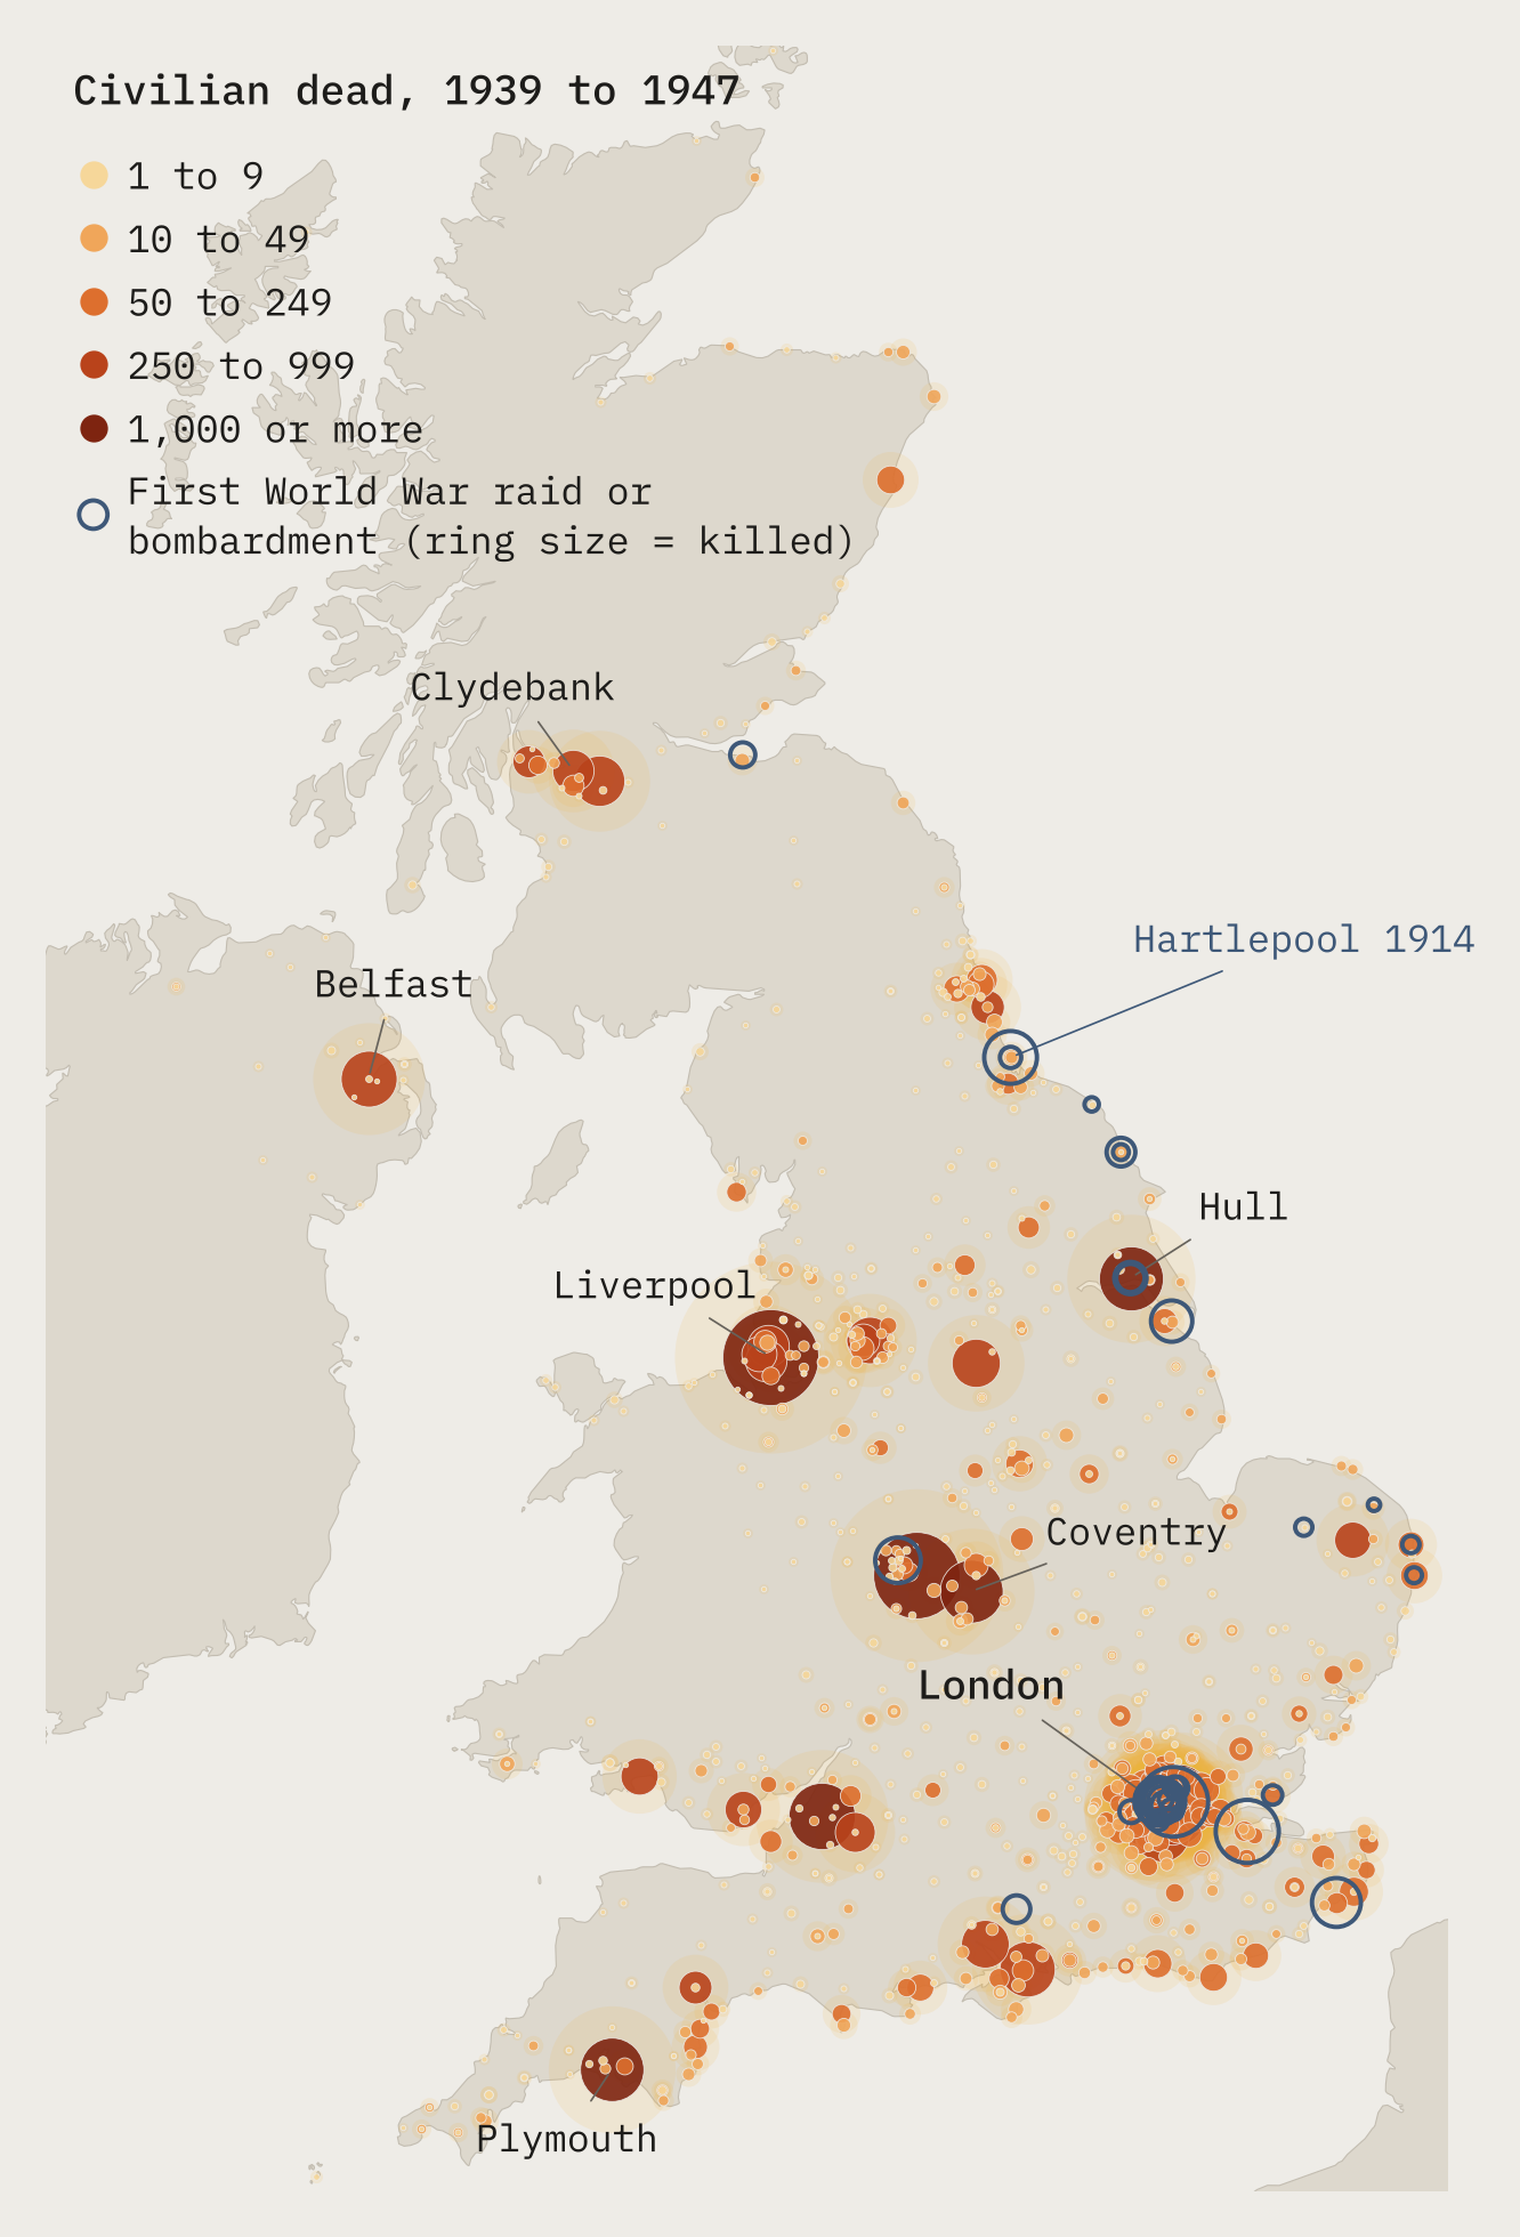
Close your eyes and picture the Blitz. Most of us see the same things: St Paul’s standing in the smoke, families asleep on the platforms of the Underground, the docks of the East End on fire. All true. But the Commonwealth War Graves Commission keeps a roll of every civilian killed by enemy action in the Second World War, filed under the town or district they are recorded in, and it tells a wider story.
The roll lists 61,542 civilians for places in the United Kingdom. 31,559 of them, 51%, were outside Greater London. I only use the counts: no names or addresses leave my analysis. This post pairs with my study of the names on our war memorials, for Remembrance.
It started in Hartlepool
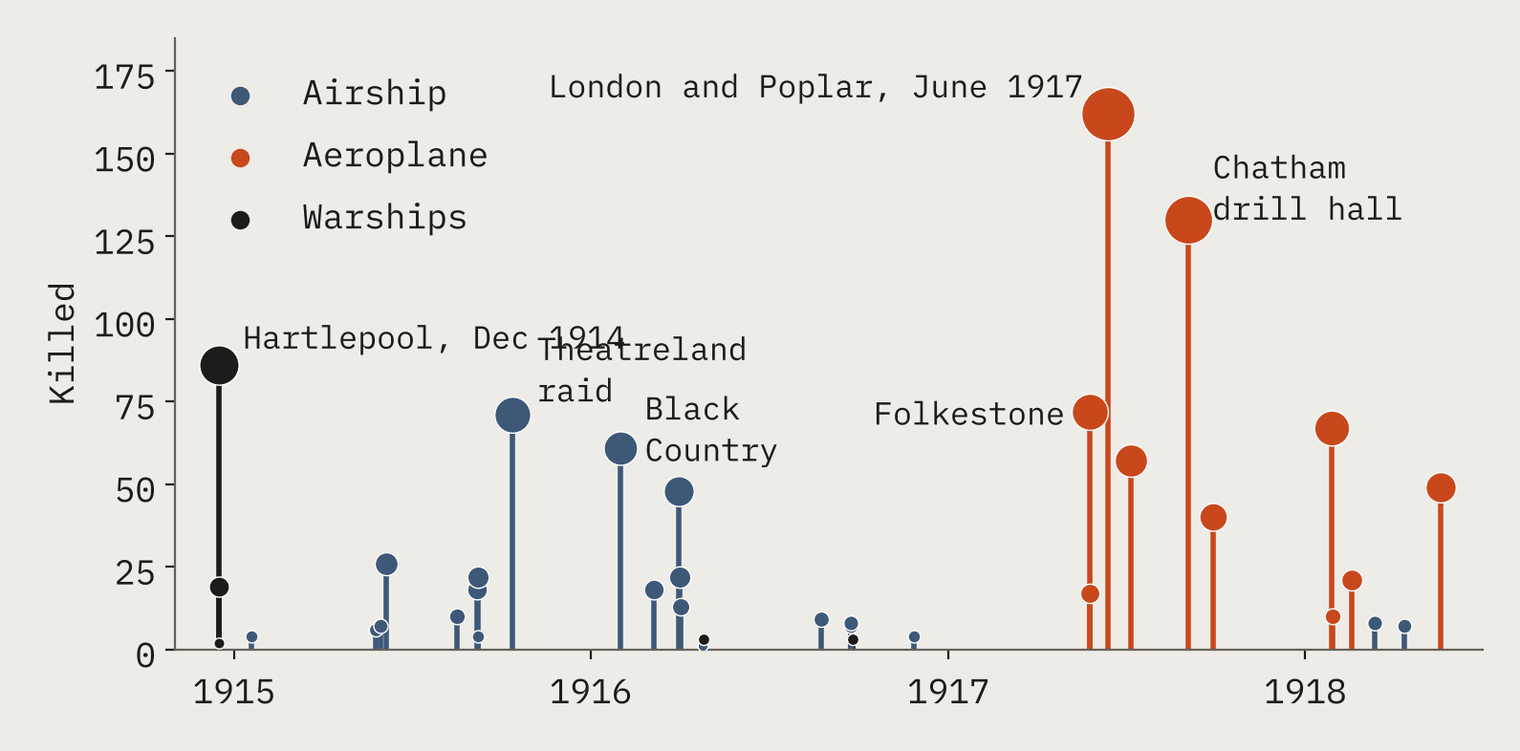
The first British civilians killed at home by German guns were not bombed. At about eight in the morning of 16 December 1914, German battlecruisers shelled Hartlepool, then Scarborough and Whitby. Hartlepool was hit hardest: 86 civilians and seven soldiers died there. The toll for the three towns is usually given as 137, and “Remember Scarborough” went on the recruiting posters.
Hartlepool folk are still called “monkey hangers”, after a legend that during the Napoleonic Wars the town hanged a shipwrecked monkey as a French spy. It is folklore, probably born in a music-hall song. The shelling a century later was not.
Then came the Zeppelins: Great Yarmouth and King’s Lynn in January 1915, London that May, and the Gotha bombers from 1917. In all, raids from the air killed 1,414 people. Only 668 of them (47%) died in the London police district. A bomb on Upper North Street School in Poplar killed 18 children in June 1917, but three weeks earlier 72 people had died in a single Gotha raid on Folkestone.
The shape of the Blitz
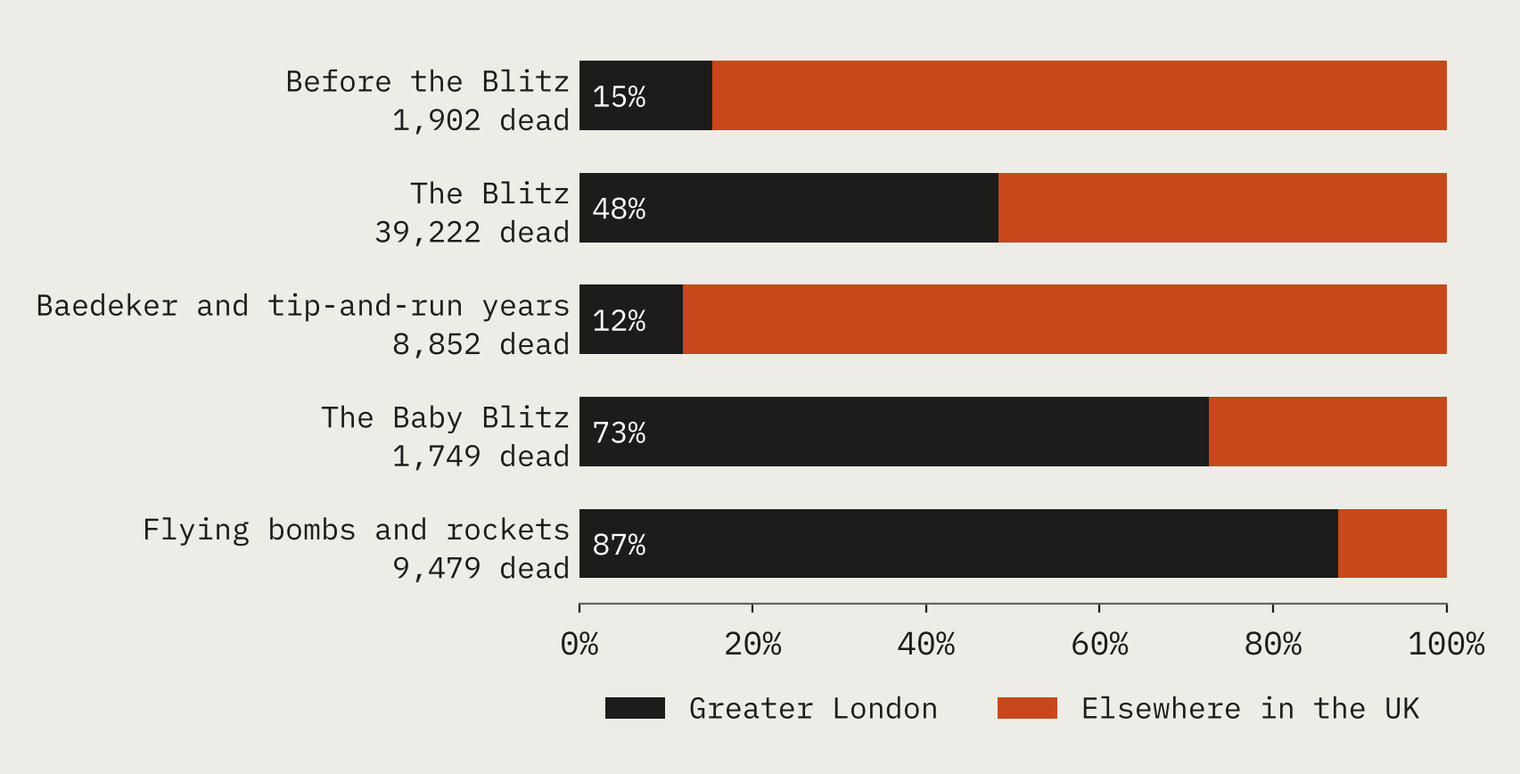
The Second World War roll has 43.5 times as many civilian dead as the first war’s raids. Week by week it shows three great waves: the Blitz of autumn 1940 to May 1941, the “Baby Blitz” of early 1944, and the flying bombs and rockets of 1944 and 1945. London’s share was very different in each.
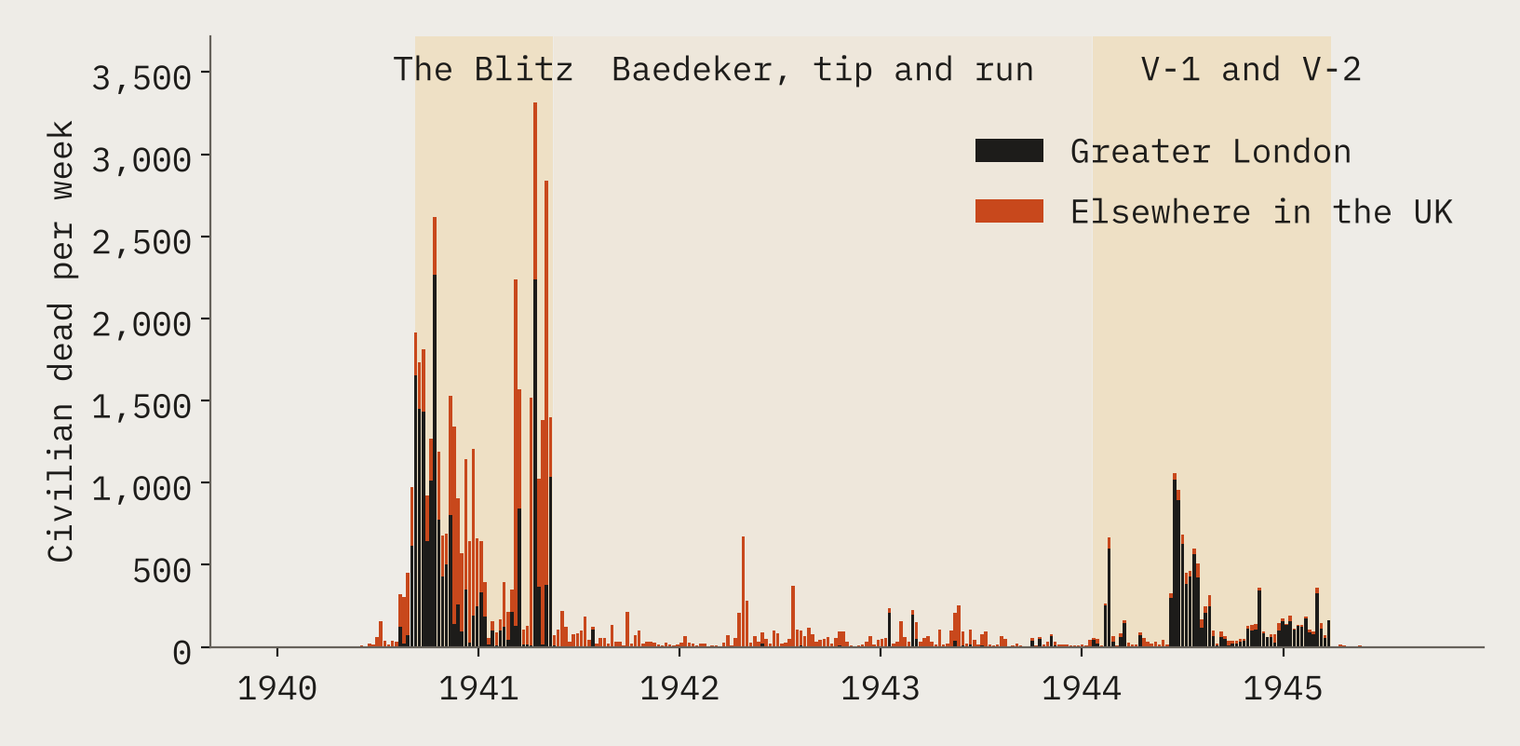
During the Blitz itself London had 48% of the 39,222 dead. The worst single day on the whole roll, 16 April 1941, was split almost exactly in two: 789 in London and 791 elsewhere, most of them in Belfast after the Easter Tuesday raid. And the deadliest days for any single place were all outside London: Liverpool lost 669 people on 3 May 1941, Belfast 565 on 16 April 1941, Coventry 417 on 14 November 1940.
Ports, factories and cathedral cities
Liverpool has the longest roll of any single place in the country, 2,640; with Bootle, Birkenhead, Wallasey and the other Merseyside towns it is 4,090. Birmingham, Bristol, Hull, Plymouth and Coventry each lost more than a thousand. Then the long middle of the war belonged almost entirely to the provinces: from May 1941 to January 1944, 88% of the dead were outside London. The Baedeker raids of spring 1942 killed 390 people in Bath and 235 in Exeter, and fighter-bombers making “tip and run” attacks on the coast left their mark on the rolls of Eastbourne, Hastings and Torquay.
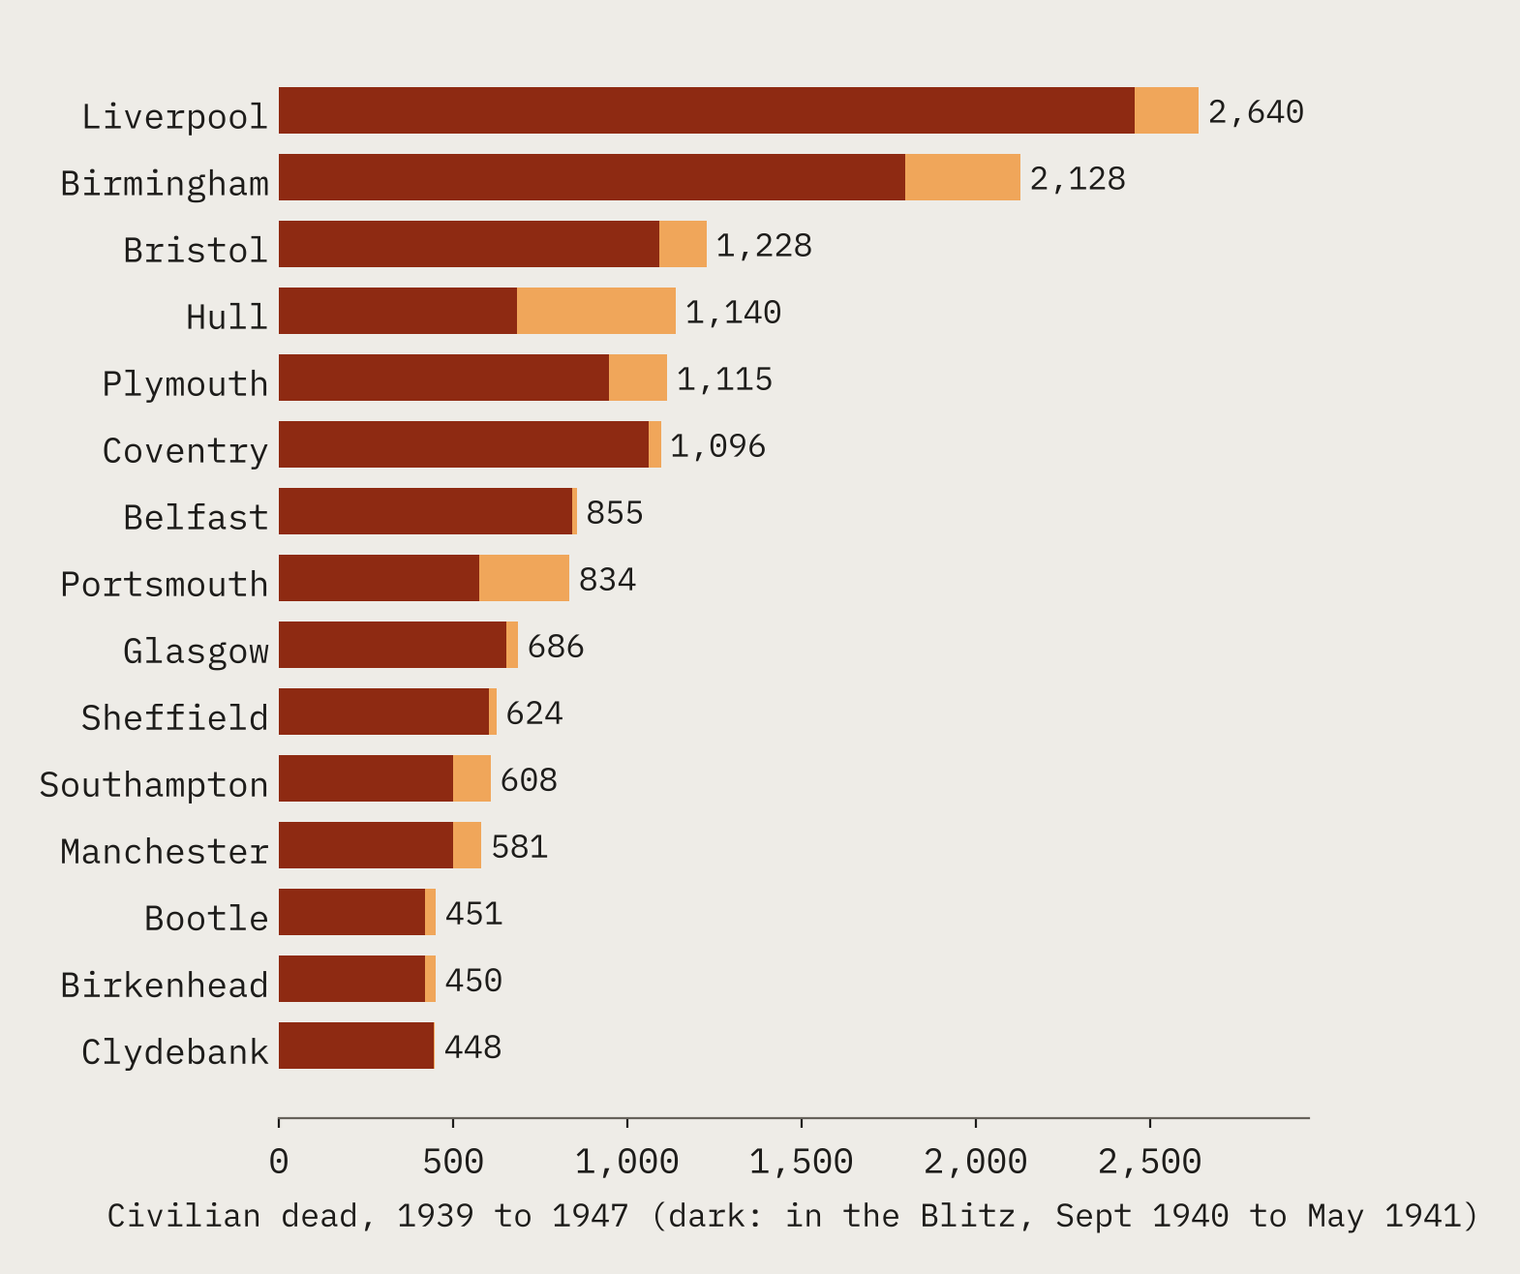
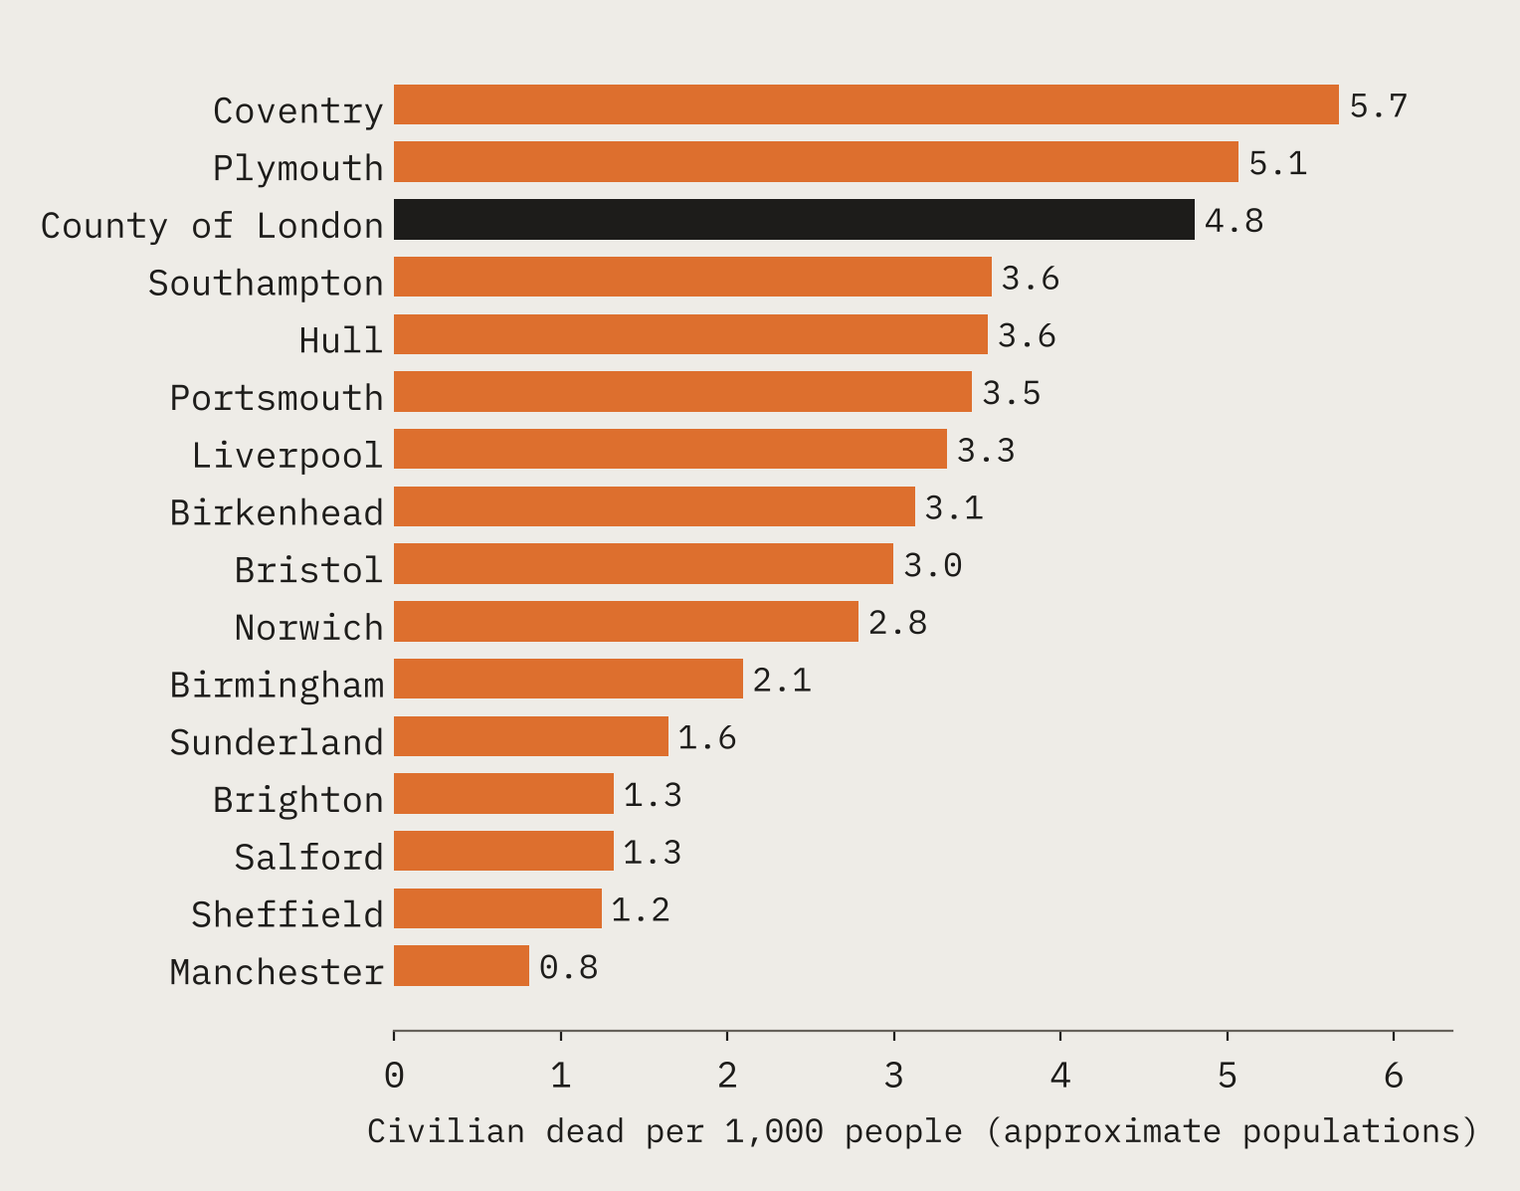
For the size of the place, the picture shifts again. Using rough population figures, Coventry lost 5.7 people per 1,000, Plymouth 5.1 and the County of London 4.8. Clydebank is missing for want of a population, but 443 of its 448 dead are recorded on 13 to 15 March 1941, in a small shipbuilding burgh.
Hartlepool lost more people in 1914 and 1918 than on its rolls for the whole of the Second World War.
The people behind the numbers
Of the dead with an age recorded, 7,764 (13%) were children under 16. Behind the totals are particular nights: 123 dead on Wandsworth’s roll the night a bomb flooded the shelter at Balham station; 173 crushed on the stairs of the Bethnal Green tube shelter in 1943 when no bomb fell at all; 38 children killed at Sandhurst Road School in Catford by a single fighter-bomber; 144 on Deptford’s roll the day a V-2 hit Woolworth’s in New Cross. And in the north-east, a comparison I did not expect: Hartlepool, shelled in 1914 and bombed again in 1918, lost 94 people in the first war and has 76 on its two rolls for the second.
How I did this
I exported the Commission’s Civilian War Dead roll (67,779 people) and kept only three things from each record: the civic area, the date of death and the age. I sorted the 1,140 areas into the United Kingdom, at sea, the Channel Islands and overseas, and placed each UK area at the town it is named after using Ordnance Survey’s open gazetteer (99.5% of the dead placed). For the First World War I built a table of 36 raids and bombardments whose tolls are stated in Wikipedia, checking each figure against the article text. The roll is filed by place and date, not by incident, and it agrees within ten per cent with the totals in Wikipedia’s city articles in 13 of 18 cases; the full method and its caveats are in the paper.
Notes and sources
- Second World War dead: Commonwealth War Graves Commission, Find War Dead (Civilian War Dead 1939-1945). Only counts by area, date and age are published.
- First World War raids: Wikipedia, German bombing of Britain, 1914 to 1918, Raid on Scarborough, Hartlepool and Whitby and related articles (CC BY-SA 4.0); English Heritage; Ian Castle’s raid records.
- The monkey legend: Wikipedia, Monkey hanger.
- City totals and populations: the Wikipedia articles on each city’s blitz and the list of English towns by historical population (CC BY-SA 4.0).
- Places: OS Open Names, contains OS data © Crown copyright and database right 2026 (Open Government Licence v3.0); Wikidata (CC0). Coastline: Natural Earth.
- Derived data are released under CC BY-SA 4.0 and the code under the MIT licence.
- I wrote the text, with drafting and editing assistance from Claude (Anthropic), which also helped prepare the analysis code. I reviewed and checked all text and results.

