
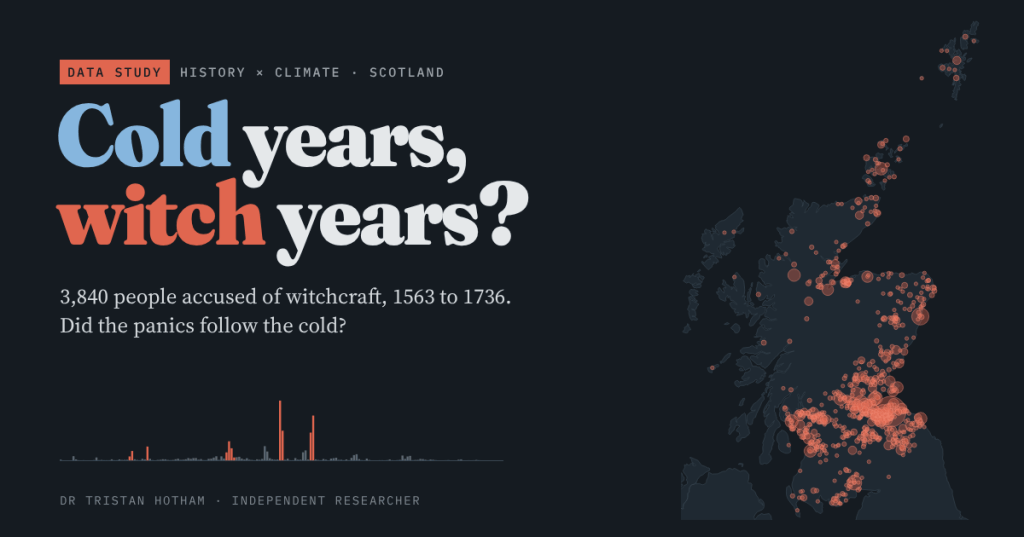
In 1590 a group of East Lothian men and women were accused of raising storms against the king’s ship. Over the next century and a half Scotland accused 3,840 people of witchcraft. Were the great panics born of cold, hungry years? I set every recorded accusation against five centuries of European temperature to find out.
There is a famous idea about the European witch-hunts: that they followed the weather. The Little Ice Age brought cold years, failed harvests and hunger, and frightened communities looked for someone to blame. Historians such as Wolfgang Behringer and the economist Emily Oster have made the case for continental Europe, and it is a powerful, memorable story.
Scotland is a good place to test it. The Survey of Scottish Witchcraft, built at the University of Edinburgh, records nearly every known accusation between 1563 and 1736, usually with a date and often with a place. I joined it to Wikidata to put 3,133 of the named accused on a map, and set the yearly totals beside a reconstruction of European temperature that runs back to 1500. For contrast, I also take a quick look at Lancashire’s most famous witches, at Pendle.
A hunt that came in bursts
In a typical year Scotland accused only a handful of people: the median year saw 5, and 33 years saw none at all. Then, every so often, the numbers exploded. The worst year, 1649, saw 565 people accused. The five panics that historians name, 1590 to 1591, 1597, 1628 to 1631, 1649 to 1650 and 1661 to 1662, cover just 11 of 174 years, yet they hold 57% of all dated accusations.
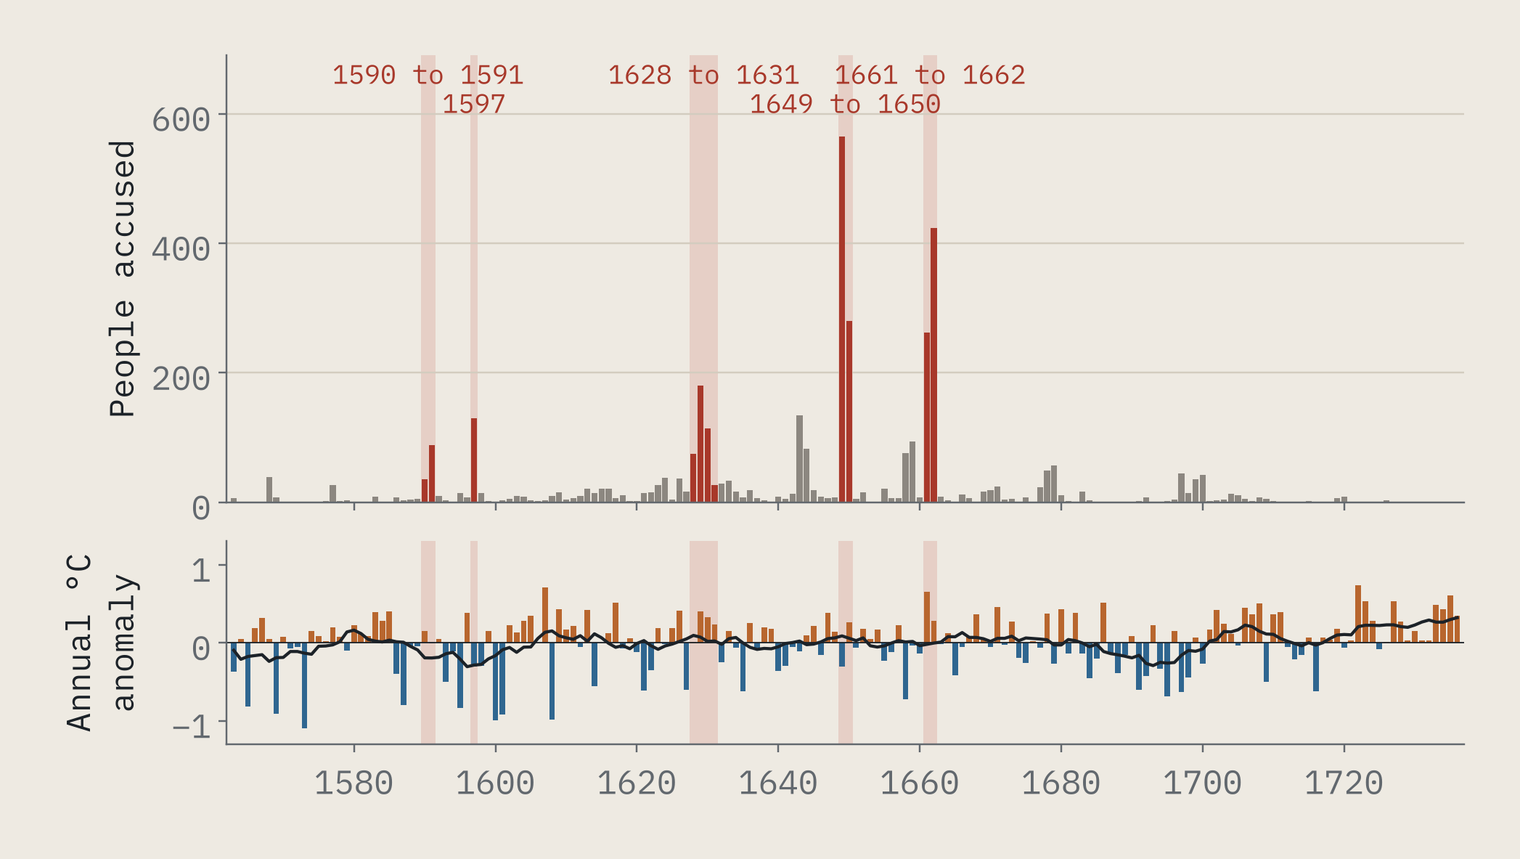
Look at the two panels together and the problem for the cold theory is already visible. The tall red spikes do not line up with runs of blue.
The Lowlands, not the Highlands
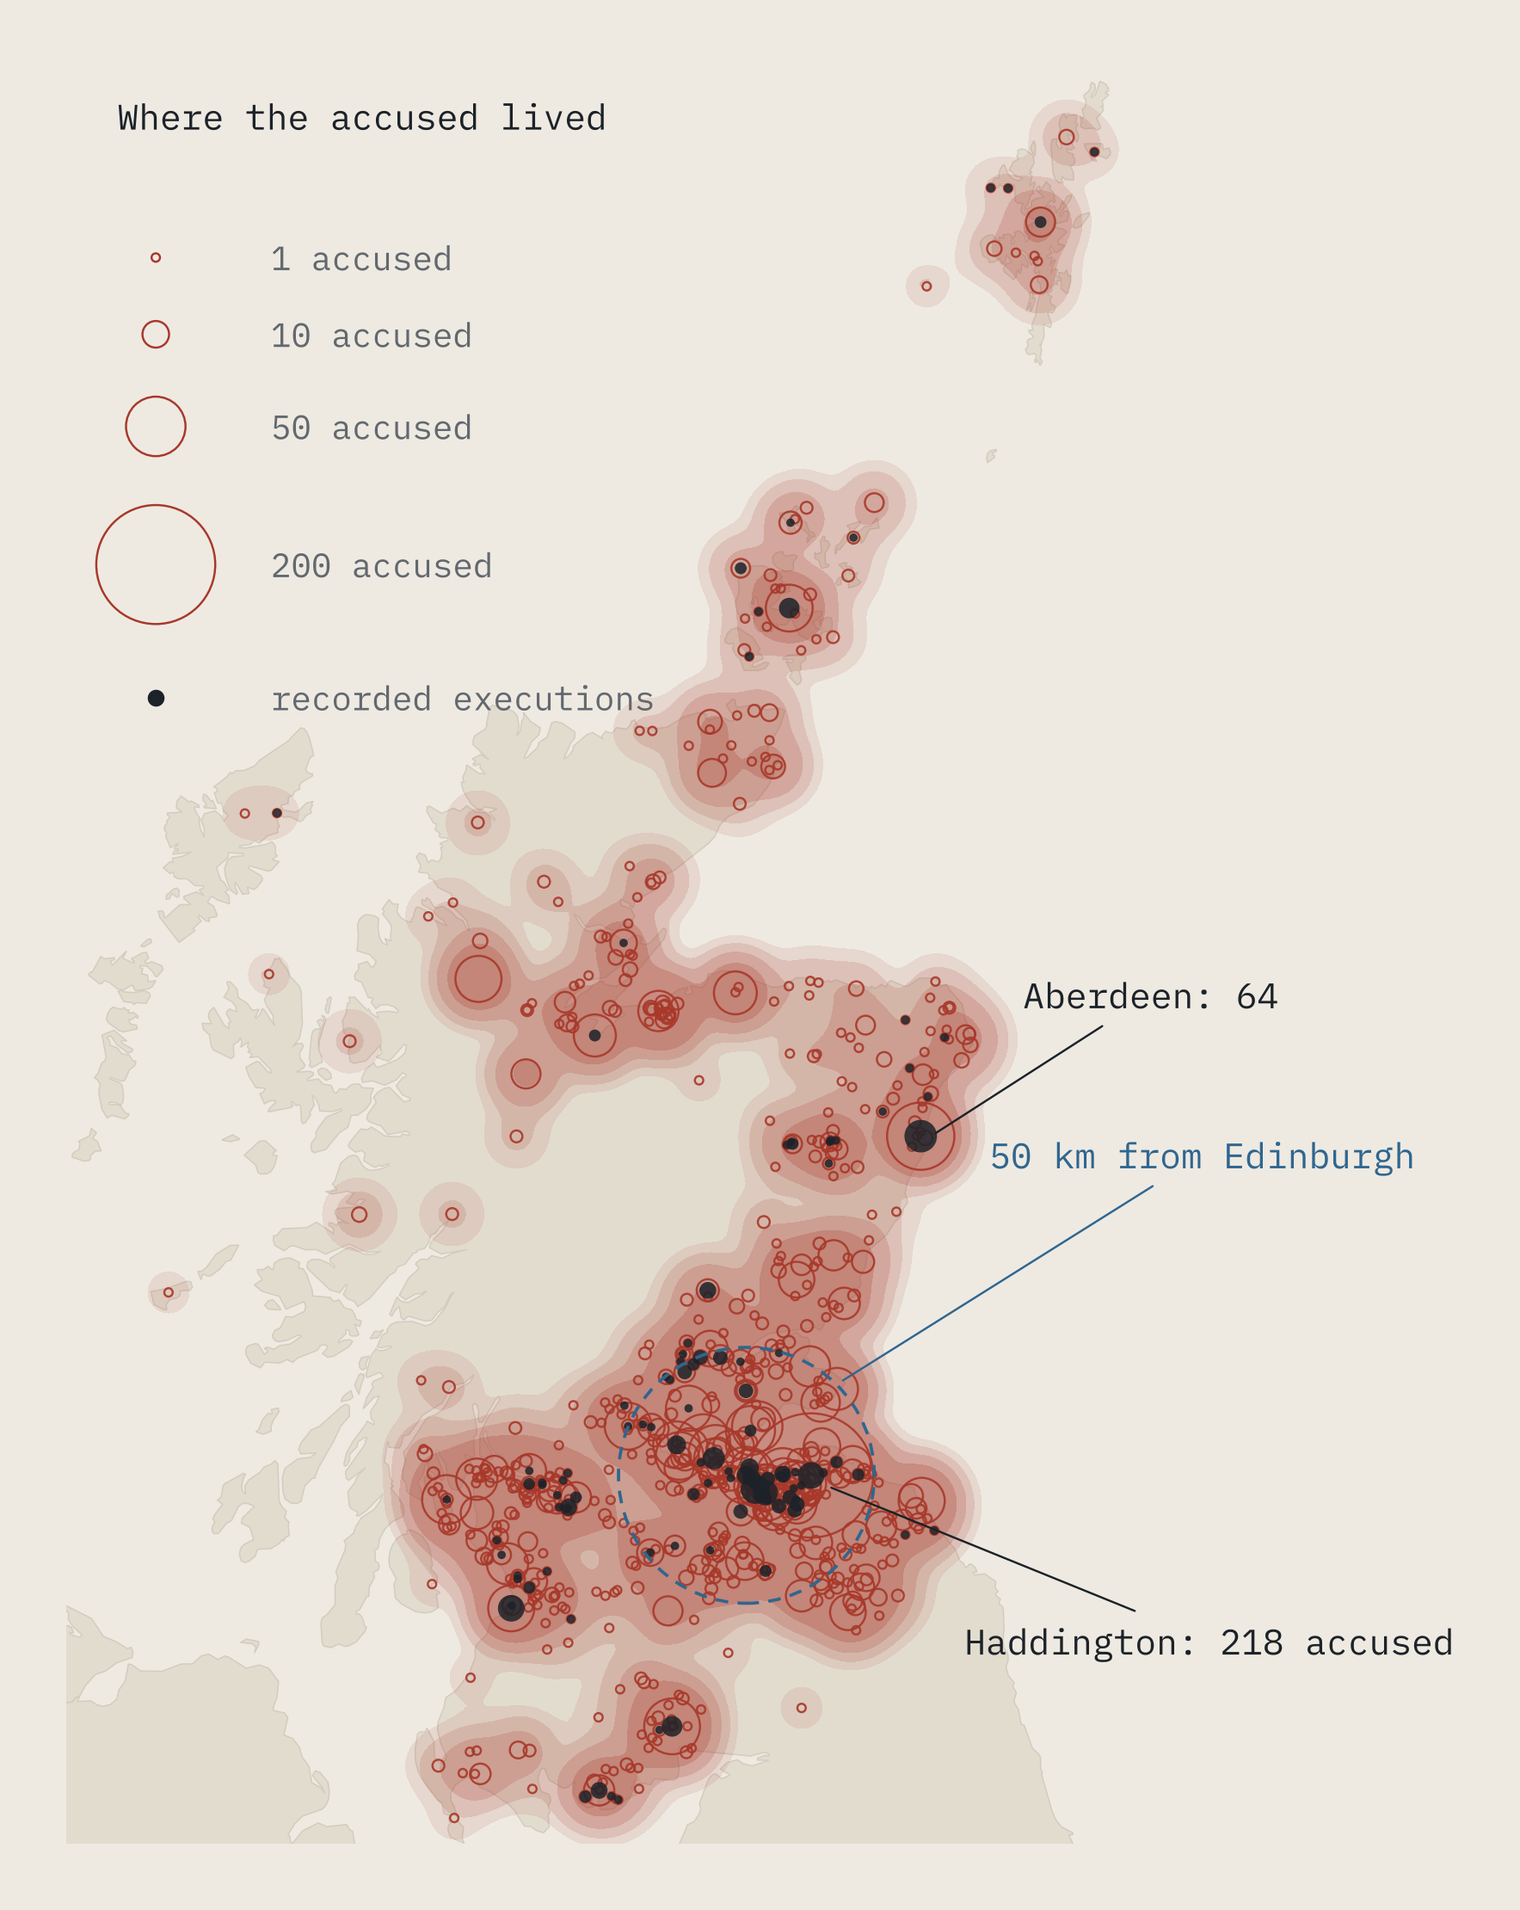
The map is just as striking. Accusations piled up around the Firth of Forth: 54% of mapped accused lived within 50 km of Edinburgh. Three counties, East Lothian (then Haddingtonshire), Fife and Midlothian, account for 42% of accused with a recorded county. The single place with most accused is the town of Haddington, with 218. The Highlands and Islands are almost empty in the record.
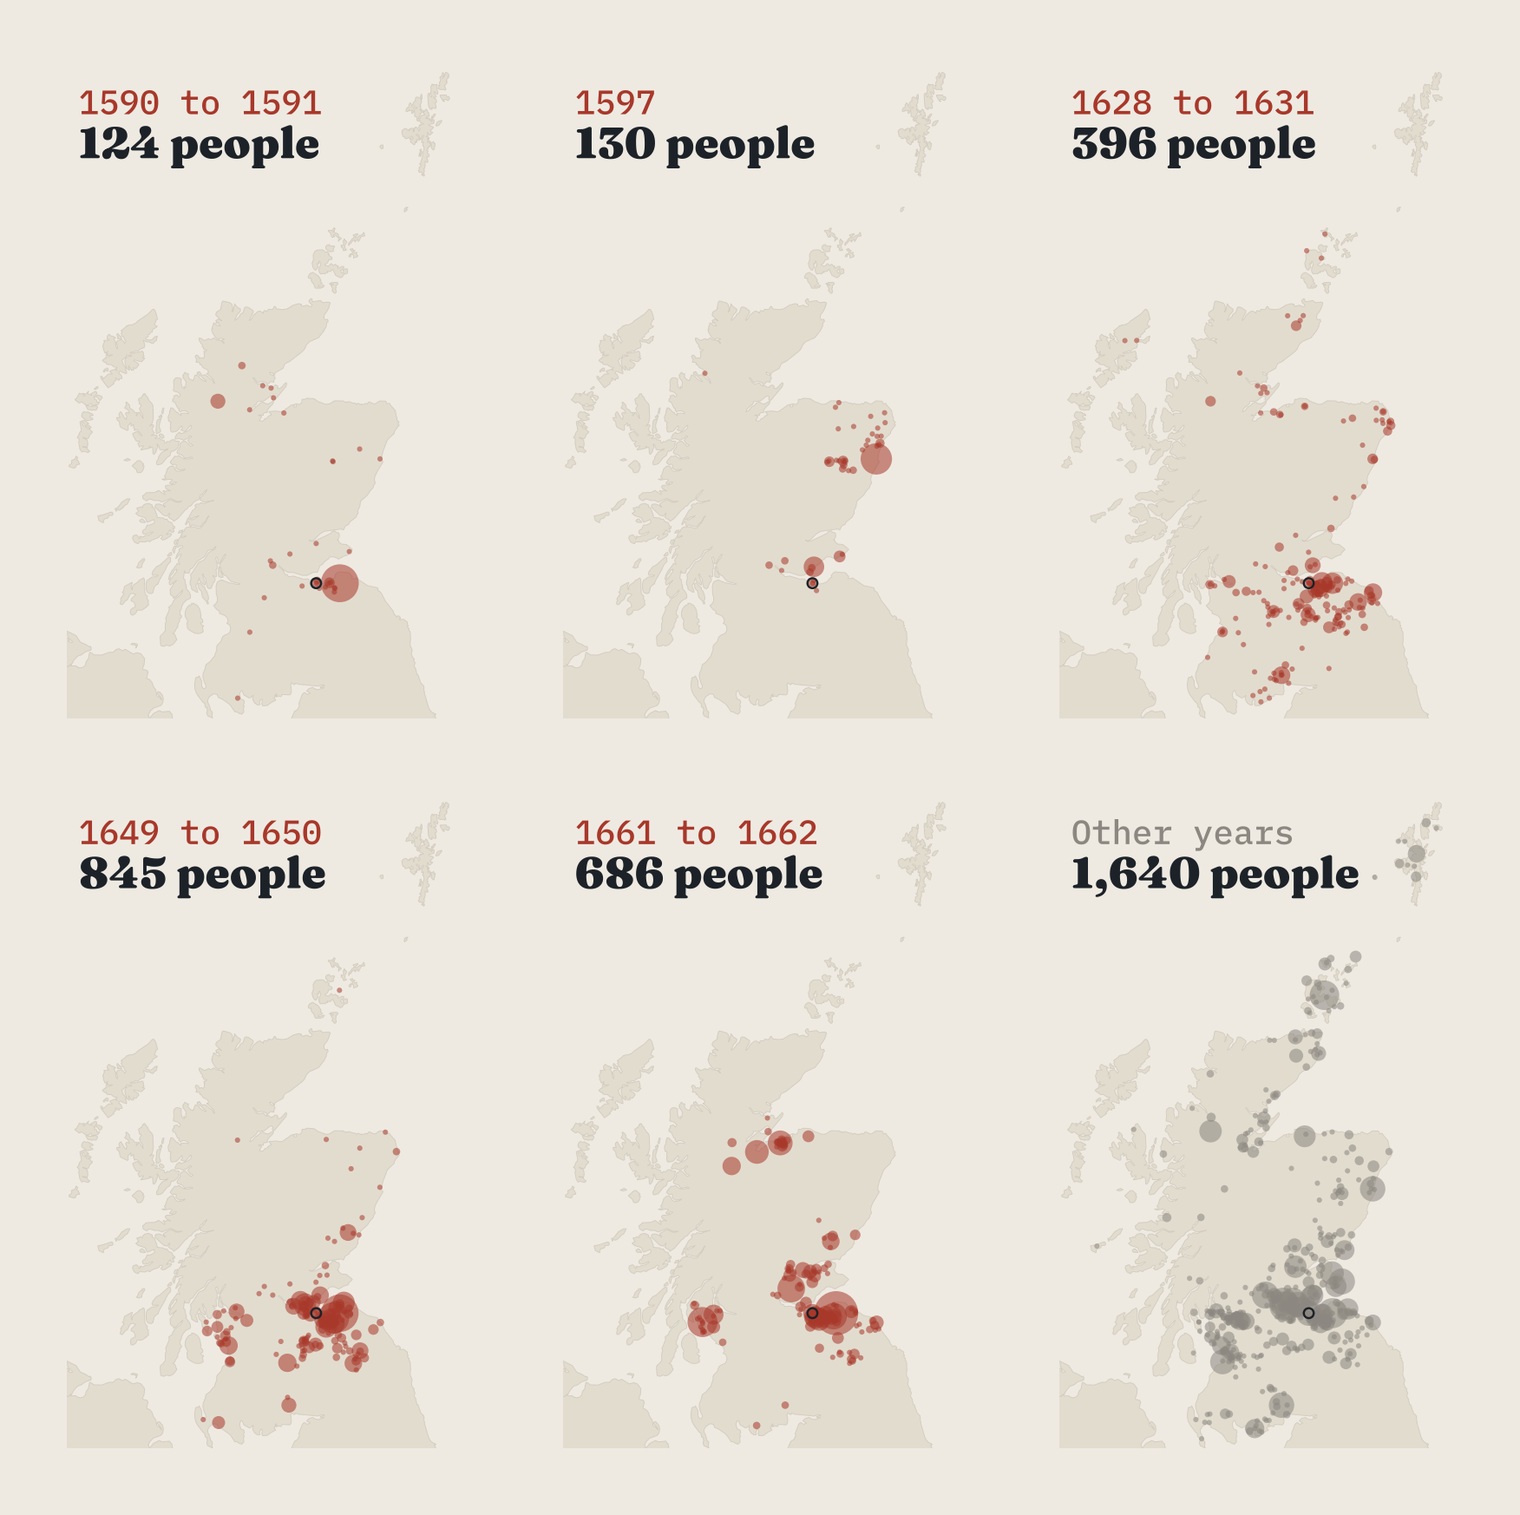
Each panic had its own heartland. The 1597 hunt was centred on Aberdeenshire and Fife, with only 31% of its accused near Edinburgh. The two largest, 1649 to 1650 and 1661 to 1662, swept through the Lothians. In the quieter years between, accusations were scattered much more widely.
Did the cold come first?
Here is the test. If cold set off the panics, the years when they began, or the years just before, should be colder than usual. There are two traps. There are only five panics, and both temperature and accusations run in streaks, which makes coincidences look far more convincing than they are. So instead of trusting standard statistics, I compared the real panics with 20,000 sets of five years picked at random from the same period.
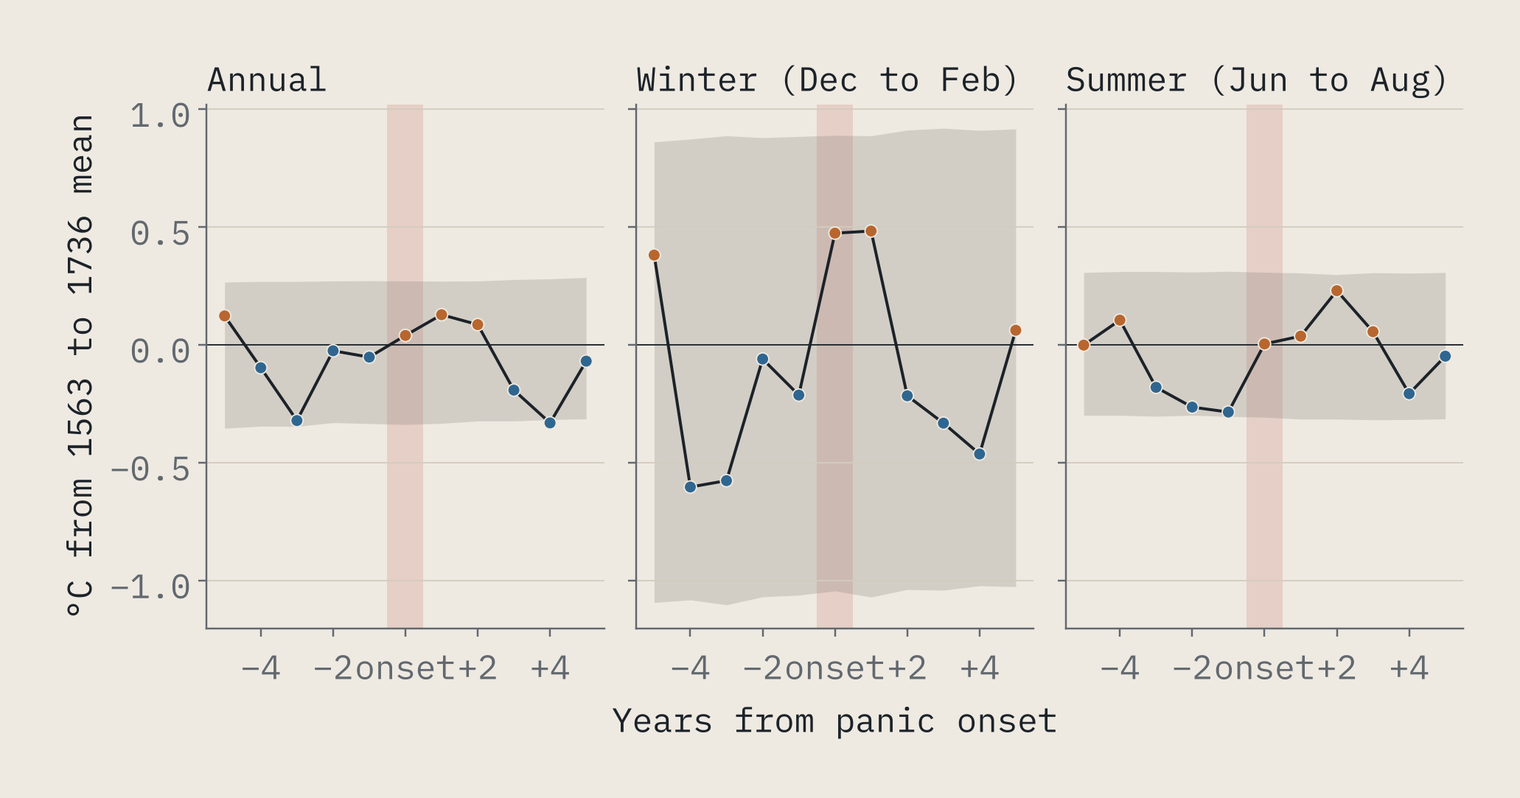
The onset years were not cold. Their annual temperature averaged +0.04 °C against the period’s mean, comfortably inside what chance produces, and their winters were mild (+0.47 °C). Only two of the five onset years were colder than average. The Restoration panic of 1661 began in one of the warmest years of the whole period: the 172nd coldest of 174.
The cold years were not the witch years.
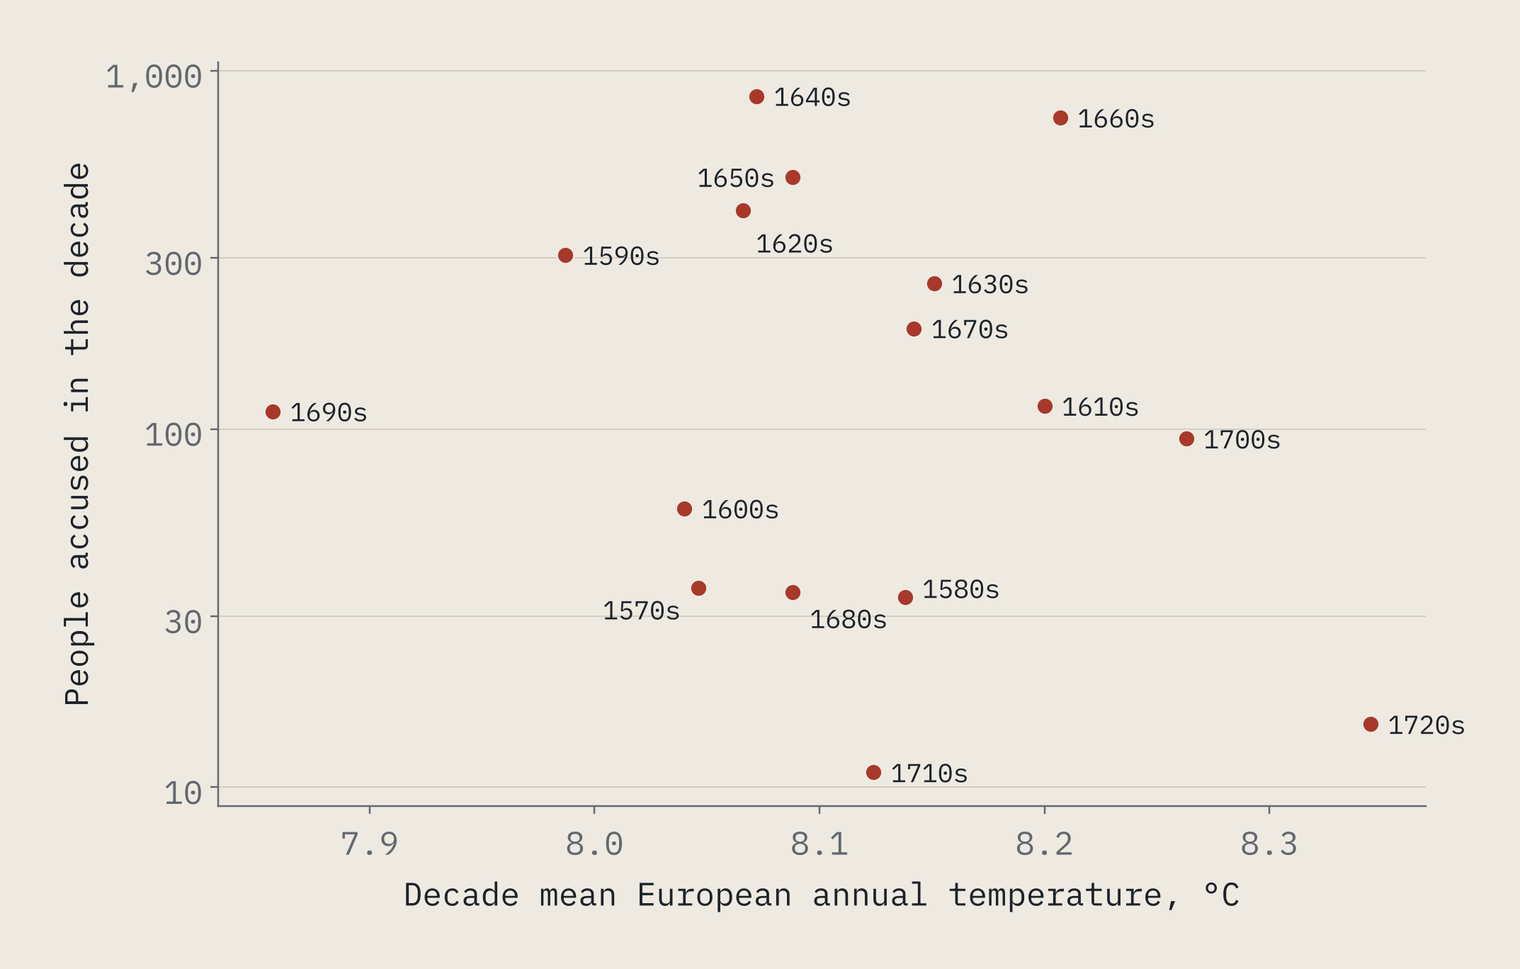
I then checked every year, not just the panics: five seasons, temperature in the same year and up to two years before, with and without the slow long-term trend. That is 30 correlations, and none of them passes the usual 5% test once the streakiness is accounted for. The coldest tenth of years actually saw fewer accusations than their share (5.6% against 9.8%). Decade by decade there is a faint tilt towards more accusations in colder decades, but it is well within chance, and it flips the other way if you leave out the warm, quiet eighteenth century.
There is one hint worth recording honestly. The summer before a panic averaged −0.28 °C, and four of the five were cooler than average. A cold summer means a poor harvest, so this is exactly where the theory would expect a signal. On its own it would pass a conventional test. But I looked at 30 combinations of season and timing, and random dates produce something at least this striking 25% of the time. It is a lead for someone with Scottish harvest records, not a finding.
Who they were
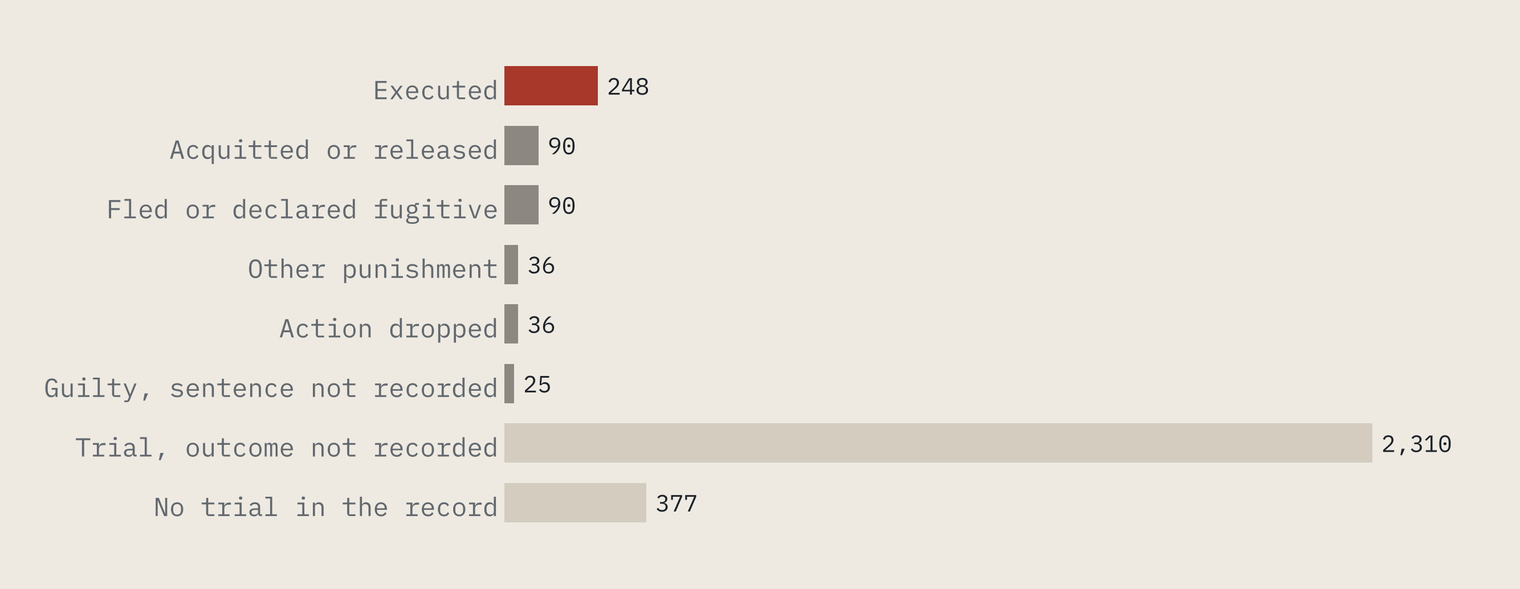
Of the named accused whose sex is known, 85% were women, in panic years and quiet years alike. Where it is recorded, most were married or widowed and of middling or lower status; the median recorded or estimated age is 45. What happened to them is often lost. For 2,687 of the 3,212 named accused no outcome survives. Of the 525 whose fate is known, 248 (47%) were executed, most often strangled and then burned.
These were real people, and the interactive map lists them by name, with links to their case records in the Survey. I would rather a reader met Helen Lausone or Euphame Haliburton of Haddington than another anonymous dot.
And Pendle?
Lancashire’s Pendle witches of 1612 are England’s best-known witch trial: 12 people accused and 10 hanged. In Scotland that year the Survey records 10 accusations, a quiet year. England produced notorious single trials. Scotland, where local church courts gathered accusations and the Privy Council issued commissions to try them, produced panics that could sweep up hundreds in a season, and the weather does not seem to explain when they came.
How I did this
The accusations come from the Survey of Scottish Witchcraft’s database export (CC BY 4.0). Its files have no header row, so I inferred the column names by checking their contents. I counted unnamed groups, such as “3 unnamed witches”, by the number given, and dated each case by its case date. Places come from Wikidata, which links 3,133 of 3,212 named accused to a residence with coordinates: a parish or settlement centre, not a house.
Temperature is the European seasonal reconstruction by Jürg Luterbacher, Elena Xoplaki and colleagues, from the NOAA paleoclimate archive. It covers European land as a whole, not Scotland, which sits at its north-western edge; that is the biggest limit on this test. Every p-value respects the streakiness of the data: I shifted the series against each other, drew random sets of panic years, or built random series with the same rhythms. With only five panics the test can catch a strong, consistent cold effect, but not a subtle one.
Notes and sources
- Accusations: Goodare, J., Martin, L., Miller, J. and Yeoman, L. 2003, The Survey of Scottish Witchcraft, 1563 to 1736, University of Edinburgh (CC BY 4.0). Online: witches.hca.ed.ac.uk.
- Places: Wikidata items for accused witches with Survey identifiers and residences (CC0).
- Temperature: Luterbacher, J. et al. 2006, European Seasonal Temperature Reconstructions, IGBP PAGES/World Data Center for Paleoclimatology Data Contribution Series 2006-060, NOAA/NCDC Paleoclimatology Program; Luterbacher et al. 2004, Science 303, 1499 to 1503; Xoplaki et al. 2005, Geophysical Research Letters 32, L15713.
- Background: Behringer, W. 1999, Climatic change and witch-hunting, Climatic Change 43, 335 to 351; Oster, E. 2004, Witchcraft, weather and economic growth in Renaissance Europe, Journal of Economic Perspectives 18(1), 215 to 228.
- Pendle: Wikipedia, Pendle witches (CC BY-SA 4.0).
- Paper, data and code: Zenodo and GitHub.
- I wrote the text, with drafting and editing assistance from Claude (Anthropic), which also helped prepare the analysis code. I reviewed and checked all text and results.

