
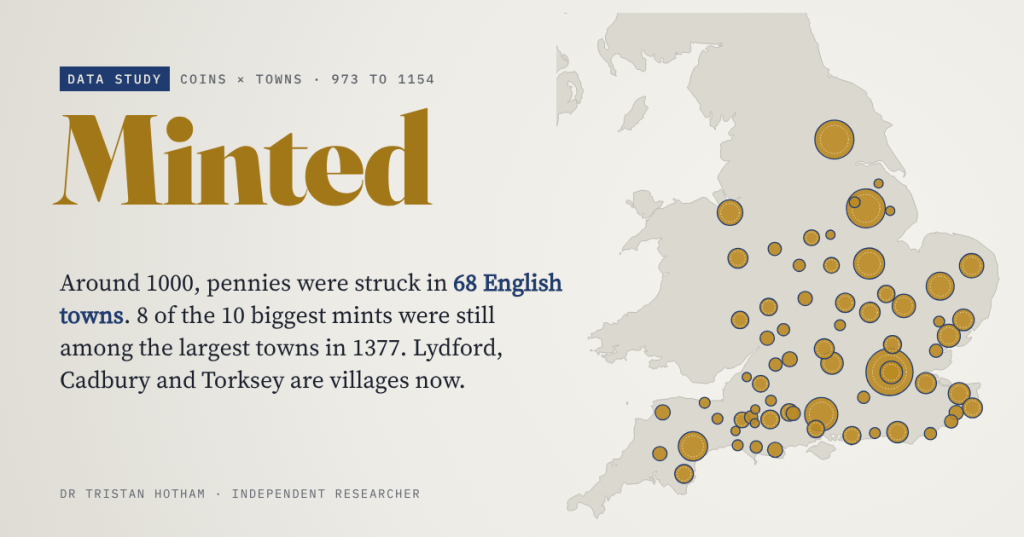
Around the year 1000, every English penny named the town that struck it. I followed 68 mint towns of Æthelred II’s reign forward through the poll tax of 1377, the census of 1801 and the census of 2021. Most of the big ones stayed big. Some of the small ones all but disappeared.
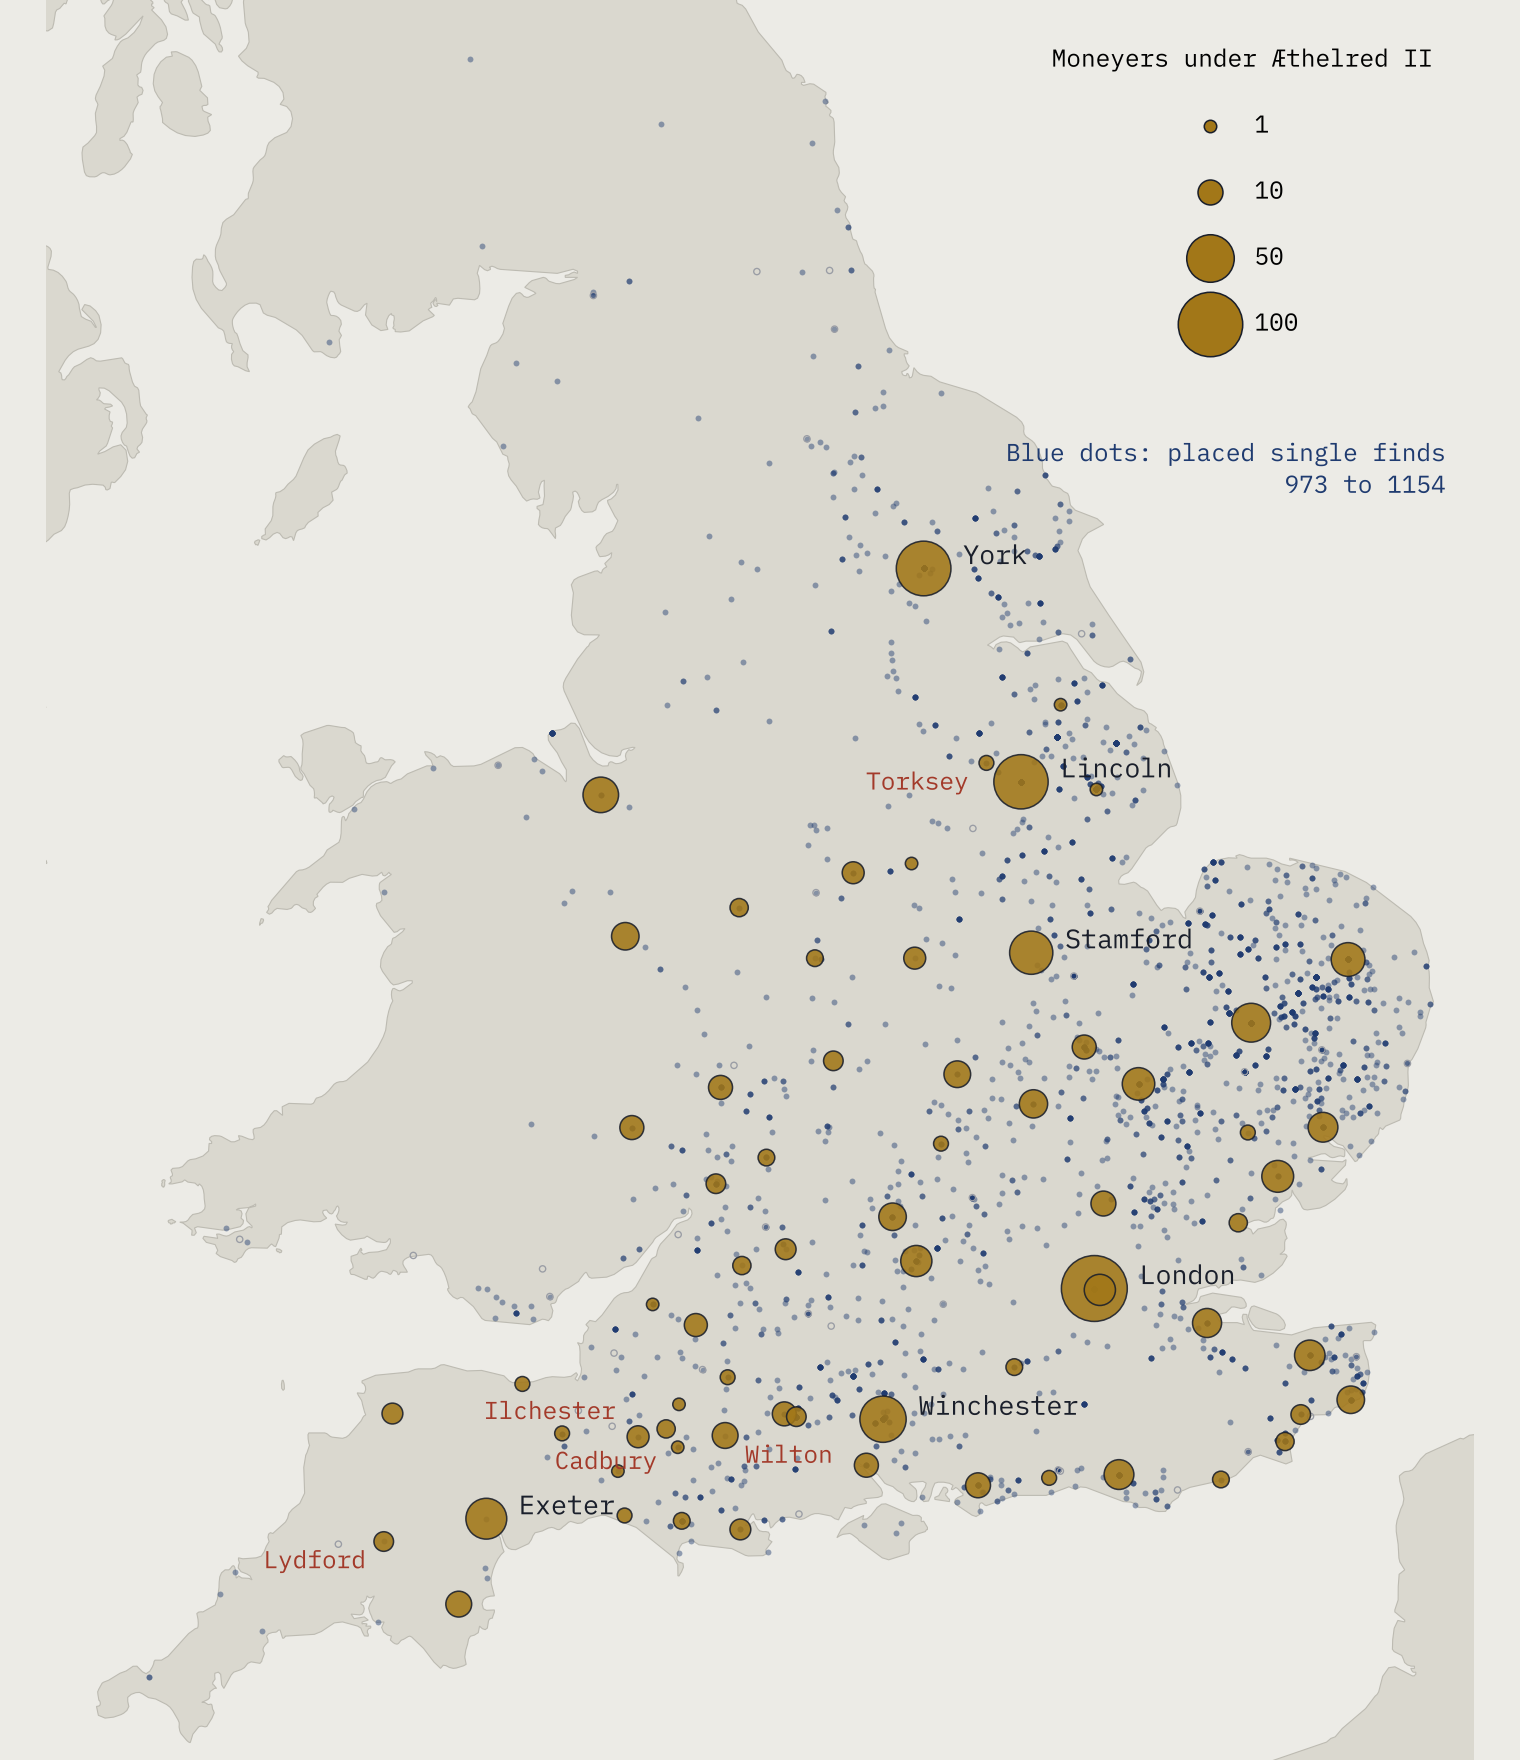
Lydford is a village on the western edge of Dartmoor. Its parish has 370 residents. A thousand years ago it was a mint town: its surviving coins name nine different moneyers between the reigns of Æthelred II and Edward the Confessor, and Domesday Book counts 28 burgesses there in 1086. Then the coins stop.
Late Anglo-Saxon England had a remarkably organised coinage. After King Edgar’s reform, around 973, every silver penny carried the king’s name, the moneyer who struck it and the town where it was struck. That makes the coins a kind of census: a list of the places that mattered enough to hold a mint, and, through the number of moneyers, a rough measure of how much each one made. So I asked a simple question. Were the towns that made England’s money still the important towns later on?
I gathered 70,995 coin records from the Fitzwilliam Museum’s database of early medieval coins and coin finds, and kept the 33,609 from Edgar’s reform to the death of Stephen in 1154 whose mint is a single, certain place in England or Wales.
Seventy mints at the peak
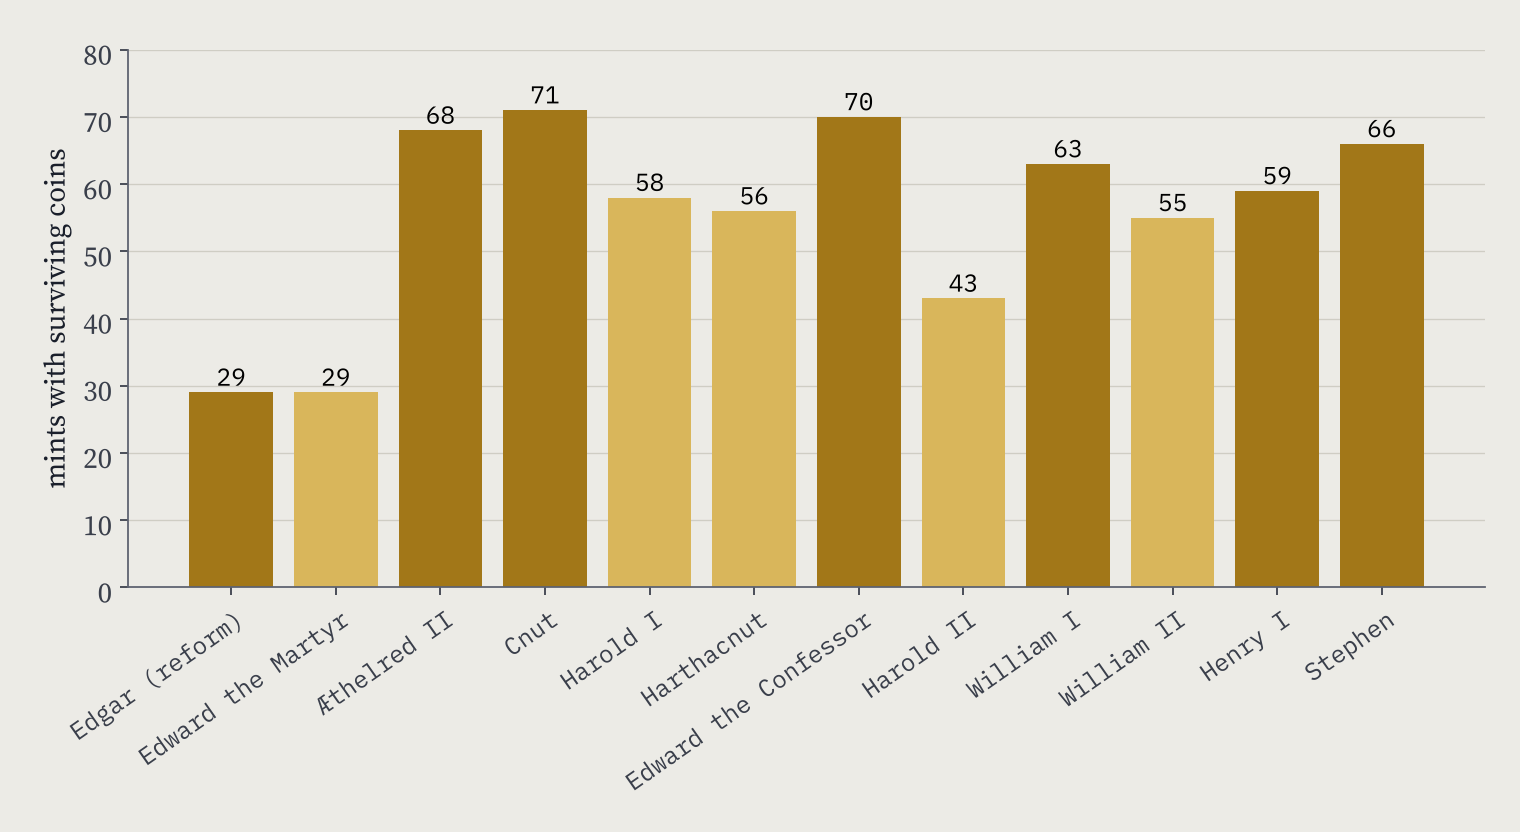
Surviving coins of Æthelred II come from 68 mints. Under Cnut the number peaks at 71, and under Edward the Confessor it is 70. After the Conquest it dips, to 63 under William I and 59 under Henry I, before Stephen’s troubled reign adds new mints such as Castle Rising, Dunwich, Cardiff and Newcastle.
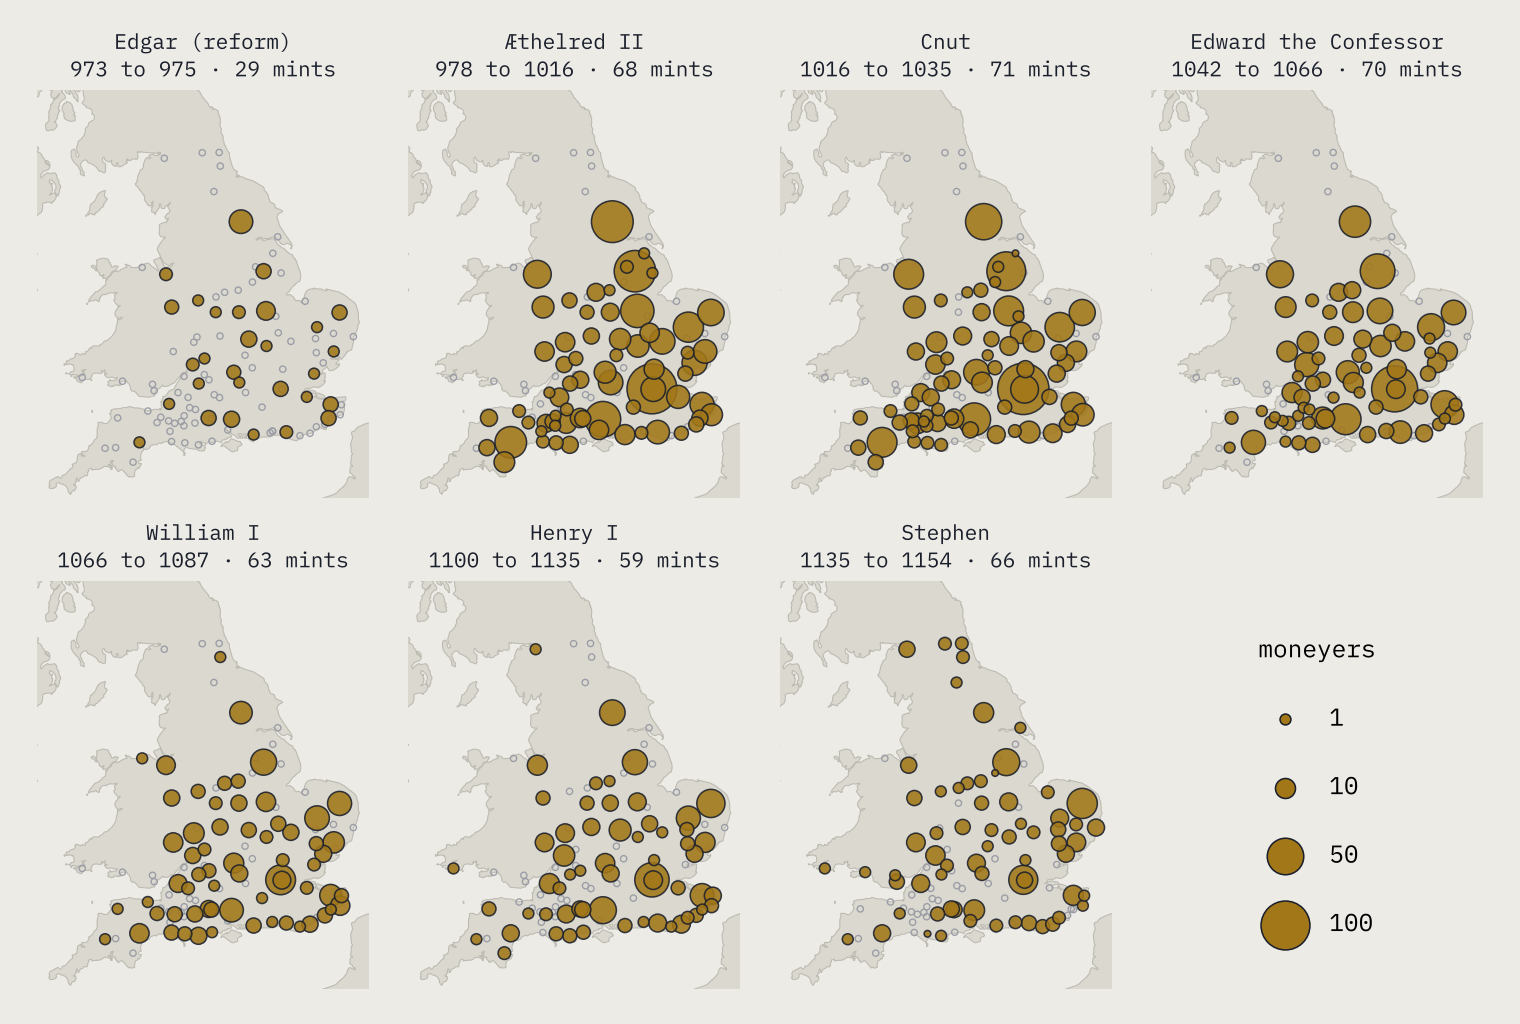
These are mints with surviving coins, so they are a floor rather than a census. Harold II reigned for nine months in 1066, and the database has his coins from 43 mints, where Wikipedia’s history of the English penny gives 48.
London, York and Lincoln
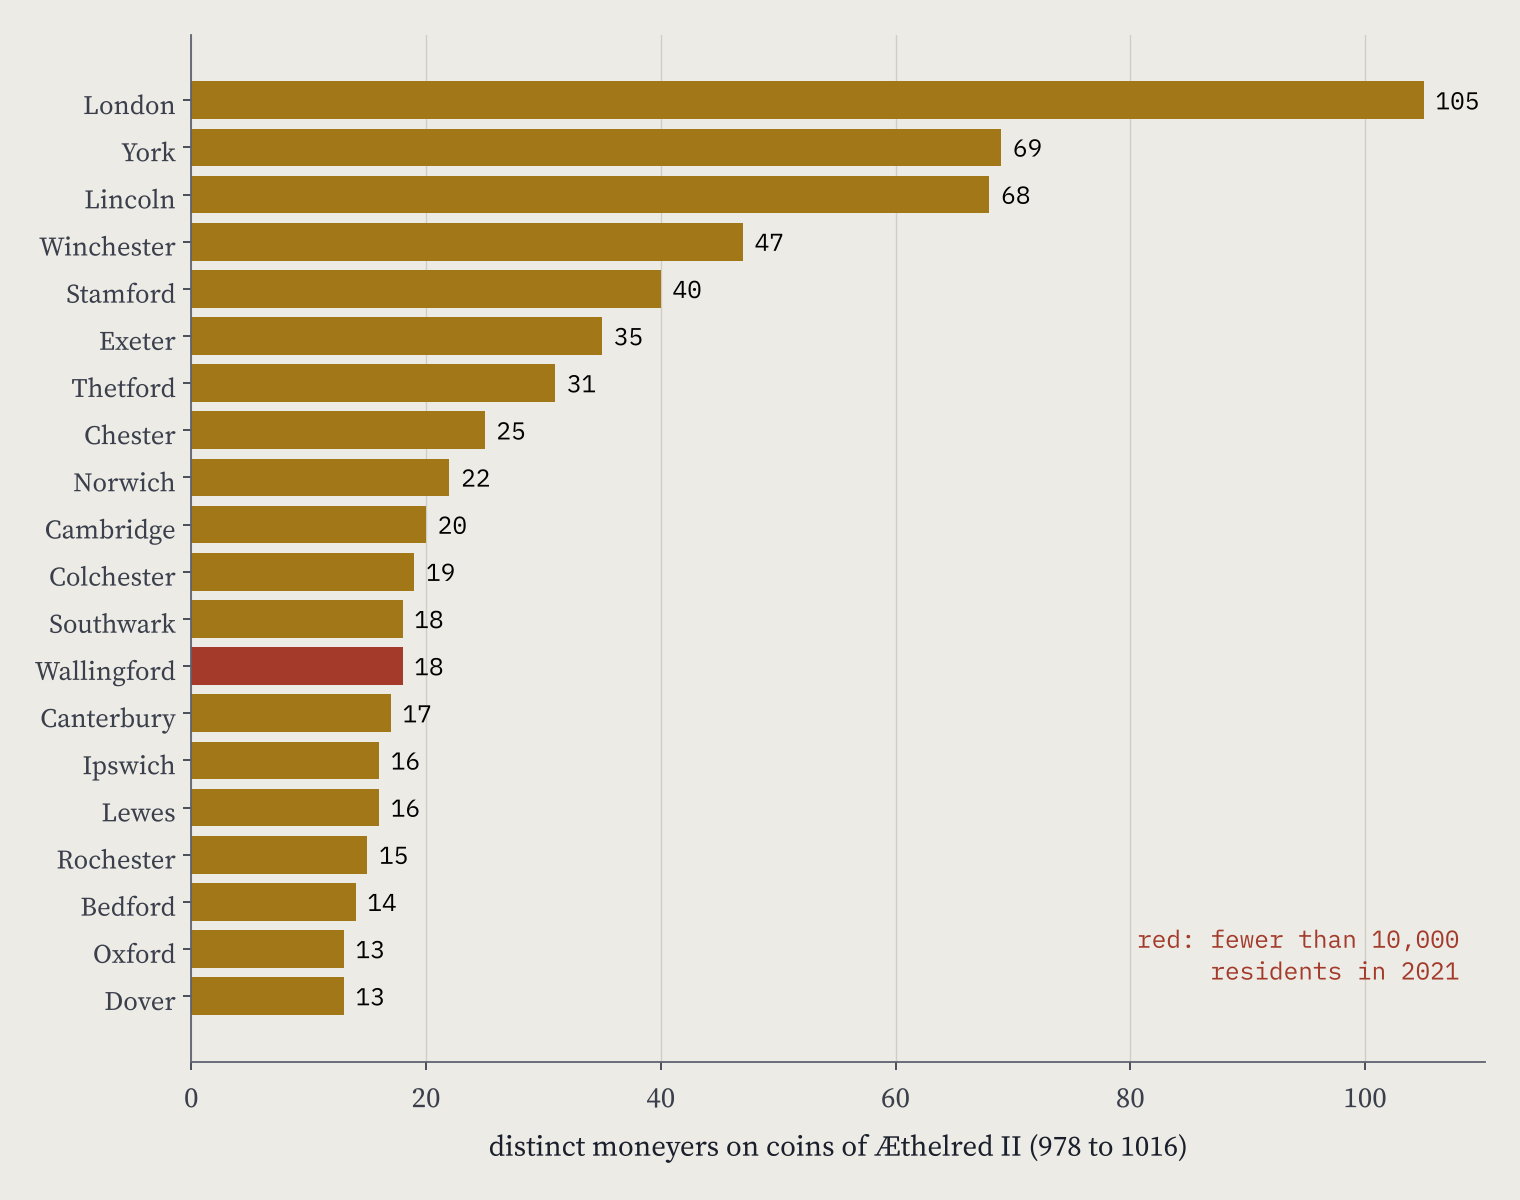
The mints were wildly unequal. Under Æthelred II, London coins name 105 different moneyers, York 69 and Lincoln 68. Those three hold 28% of all the moneyers in the reign. Winchester, the old West Saxon royal centre, has 47, and Stamford 40.
Local money, travelling far
Some of the records are single finds: coins lost one at a time, with a findspot. They are the best guide to money in everyday use. I could place 2,894 of them on the map. The median coin was found 89 km from the mint that struck it, and 45% had gone more than 100 km.
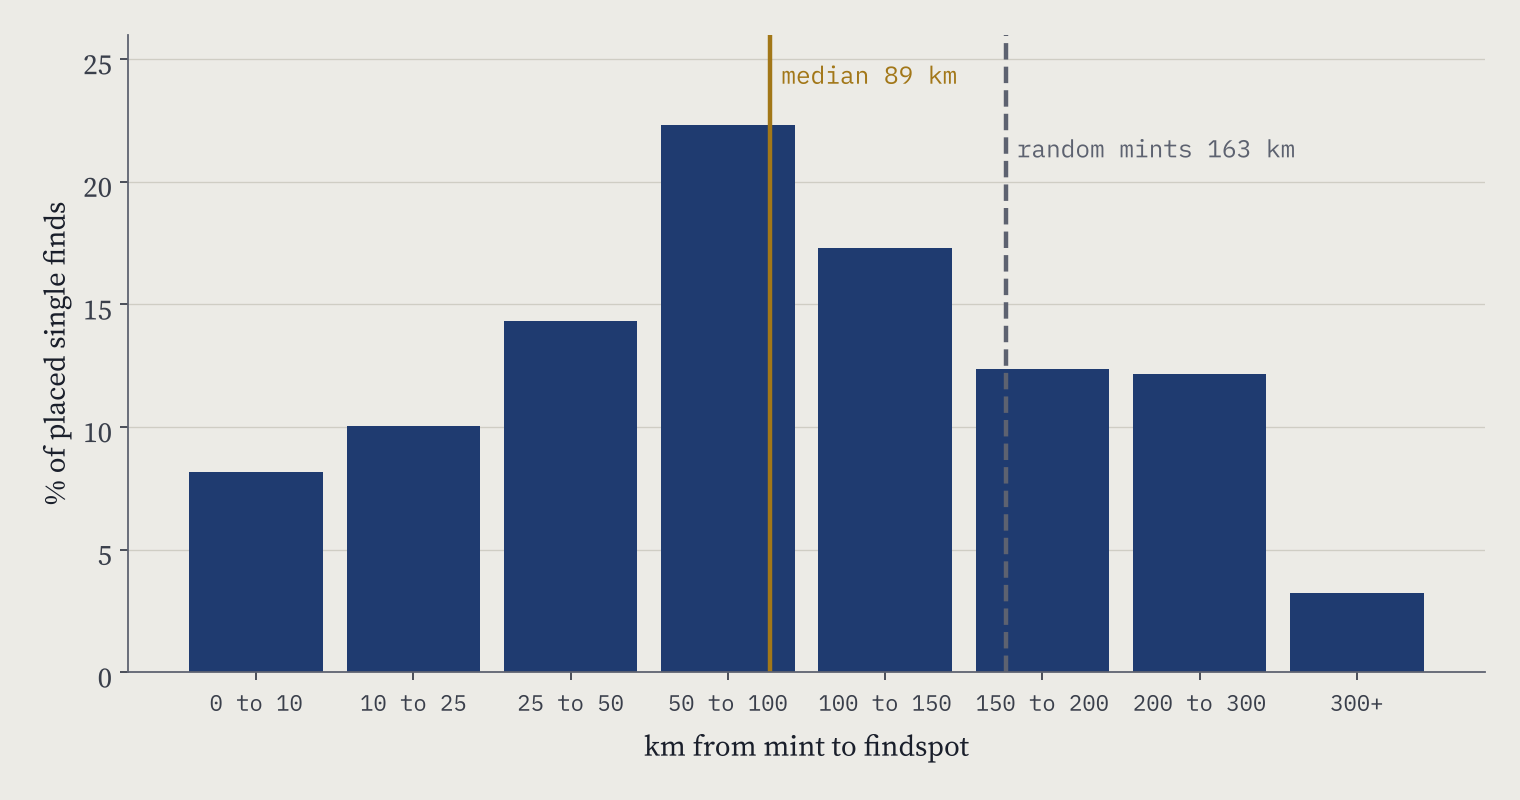
So money moved. But not at random. If every coin in a purse had been drawn from the national output, the median distance would be about 163 km. And 20% of finds were struck at the nearest working mint, 6.2 times what free mixing would give. A penny was still most likely to be lost near home. London’s coins spread widest of the big four: only 14% of London finds lie within 50 km of the city.
Eight of the ten biggest mints of around 1000 were still among England’s largest towns in 1377.
Were the big mints still big?
Mostly, yes. Eight of the ten biggest mints of Æthelred’s reign appear among the 41 largest towns in the poll tax of 1377. London is first in 1086, 1377, 1801 and 2021. Across all the mint towns of that reign, the rank correlation between moneyers then and residents now is 0.44: moderate, but across a thousand years.
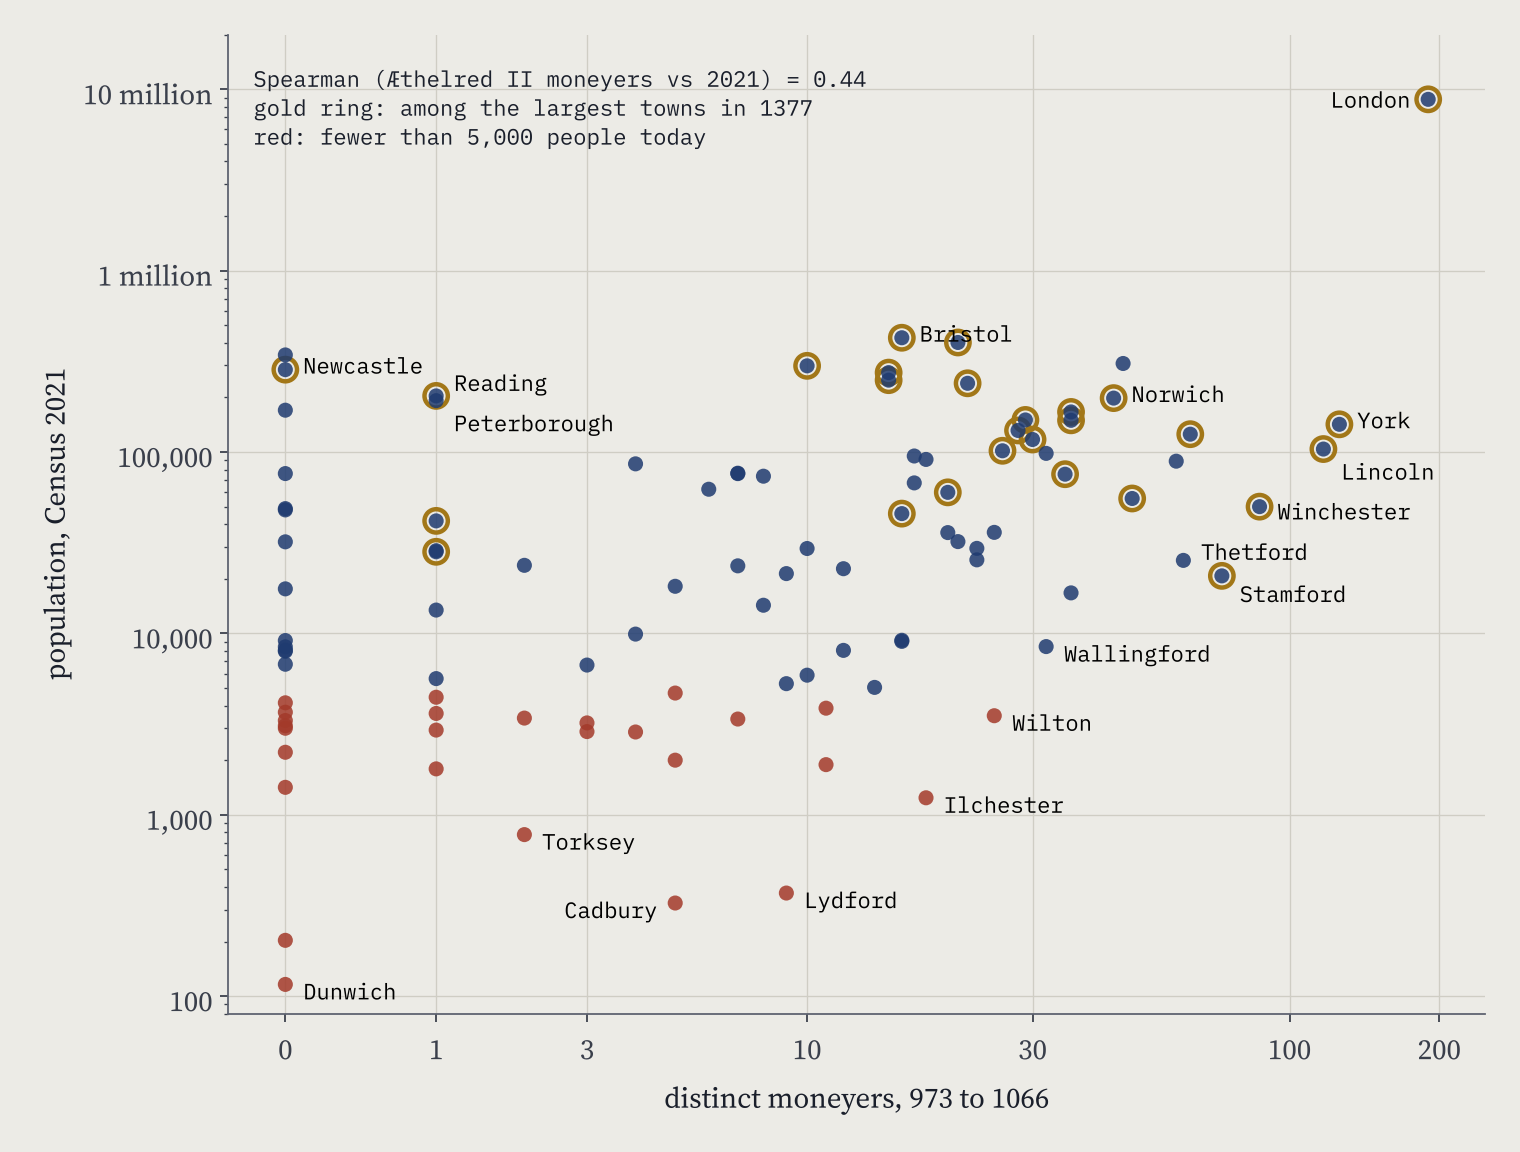
The year that breaks the pattern is 1801. By then only five of the ten were in the top 30, and the correlation falls to 0.23. Of the 30 largest towns of 1801, only 12 had struck coins in my period. None of Manchester, Liverpool, Birmingham, Leeds or Sheffield had a mint in those centuries. Today, 11 of England’s 30 largest built-up areas were mint towns. The industrial cities did not grow out of the old network. They grew beside it.
Inside the network there were losers. Winchester, fourth among the mints, was 30th in 1377 and has 49,967 people today. Thetford, seventh, with 1,665 burgesses in Domesday, is missing from the 1377 list and has 25,256 residents. Wallingford had 18 moneyers and now has 8,456 people. Bristol went the other way: one moneyer in Æthelred’s reign, third largest town in 1377.
The mints that vanished
29 mint towns have fewer than 5,000 people today. Cadbury’s coins were struck at the hillfort of Cadbury Castle; the parish beside it has 326 residents. Cissbury, on the South Downs, has none. Ilchester had 18 moneyers before 1066 and has 1,240 residents in its built-up area now; Wilton had 25 and has 3,515. Torksey on the Trent had 264 burgesses in 1086 and has a parish of 777. Dunwich, which Russell’s estimate puts at 1,596 people in 1086, has a parish of 116. Only four tiny mints have grown past 100,000: Newcastle, Reading, Peterborough and Swansea, all late or marginal mints.
How I did this
I searched the Fitzwilliam Museum’s public EMC/SCBI database by each of its 353 mint values, removed 764 duplicate records, and counted only coins whose mint is a single, certain place: queried mints, copies and ambiguous ones such as “Bath or Barnstaple” are left out and listed in the data. A mint’s size in a reign is the number of different moneyers named on its coins, the usual rough measure of output. Mints and findspots are placed with the Ordnance Survey’s OS Open Names gazetteer. The 1086, 1377 and 1801 figures come from Wikipedia’s list of English towns by historical population, Domesday burgesses from my Domesday Destiny study, and 2021 populations from Census 2021 small areas summed to built-up areas.
The caveats matter. The database is what has been catalogued, not every coin ever struck, so counts are floors. Moneyer spellings can split one person in two. The 1377 and 1801 lists cover only the largest towns. And I publish only counts and record links, not the museum’s descriptions. For more on Viking-age silver, see my Silver and Names study.
Notes and sources
- Coins: Fitzwilliam Museum, EMC/SCBI database (Corpus of Early Medieval Coin Finds and Sylloge of Coins of the British Isles), searched by mint on 27 October 2026. Only derived counts and record links are republished.
- Historical populations: Wikipedia, List of towns and cities in England by historical population (CC BY-SA 4.0). Context: Wikipedia, History of the English penny and Horndon mint.
- Domesday: Hull Domesday Project (CC BY-NC-SA), via Domesday Destiny.
- Census 2021, small-area income estimates (financial year ending 2023) and geography: Office for National Statistics, Open Government Licence v3.0. Places: OS Open Names, contains OS data © Crown copyright and database right 2026. Coastline: Natural Earth.
- Paper, data and code: Zenodo and GitHub.
- I wrote the text, with drafting and editing assistance from Claude (Anthropic), which also helped prepare the analysis code. I reviewed and checked all text and results.

