
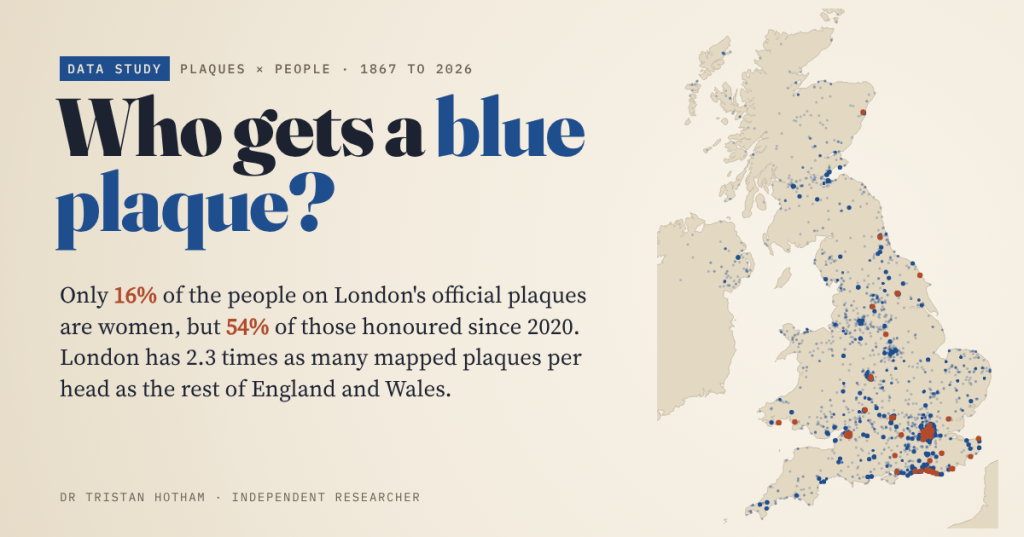
London’s blue plaques have been going up since 1867. I read every one listed on Wikipedia, 1,037 plaques naming 1,081 people, and mapped 6,476 plaques across the UK. For a century, about one person in ten honoured was a woman. Since 2020 it is more than half.
In 1867 the Society of Arts fixed a plaque to a house in King Street, St James’s, where Napoleon III had lived in exile. It is still there, the oldest surviving plaque in London’s scheme, and the scheme has kept going ever since: through the London County Council, the Greater London Council and, since 1986, English Heritage. Towns and civic societies all over Britain have copied it, in blue and in plenty of other colours.
A plaque is a small public verdict. Someone has decided that this person mattered, and that the street should be told so for the next hundred years. So I wanted to know who those verdicts have gone to. Men or women? Writers or engineers? London or everywhere else?
I used three open sources. Wikipedia’s lists of English Heritage plaques in London give the year each plaque went up, and I parsed all 1,037 rows. Wikidata holds 5,428 people with an Open Plaques ID, from schemes all over the country. And OpenStreetMap volunteers have mapped 6,476 plaques across the UK.
One in ten, then one in two
Of the 1,081 people named on London’s official plaques, 174 are women. That is 16%.
What surprised me was how flat the line was for so long. The London County Council, which ran the scheme from 1901 to 1964, honoured 22 women among 272 people (8%). The Greater London Council, from 1965 to 1985, honoured 23 among 240 (10%). Then, very recently, the line turns: 20% in the 2010s, 40% since 2016, and 54% in the 2020s so far, when 39 of the 72 people honoured have been women.
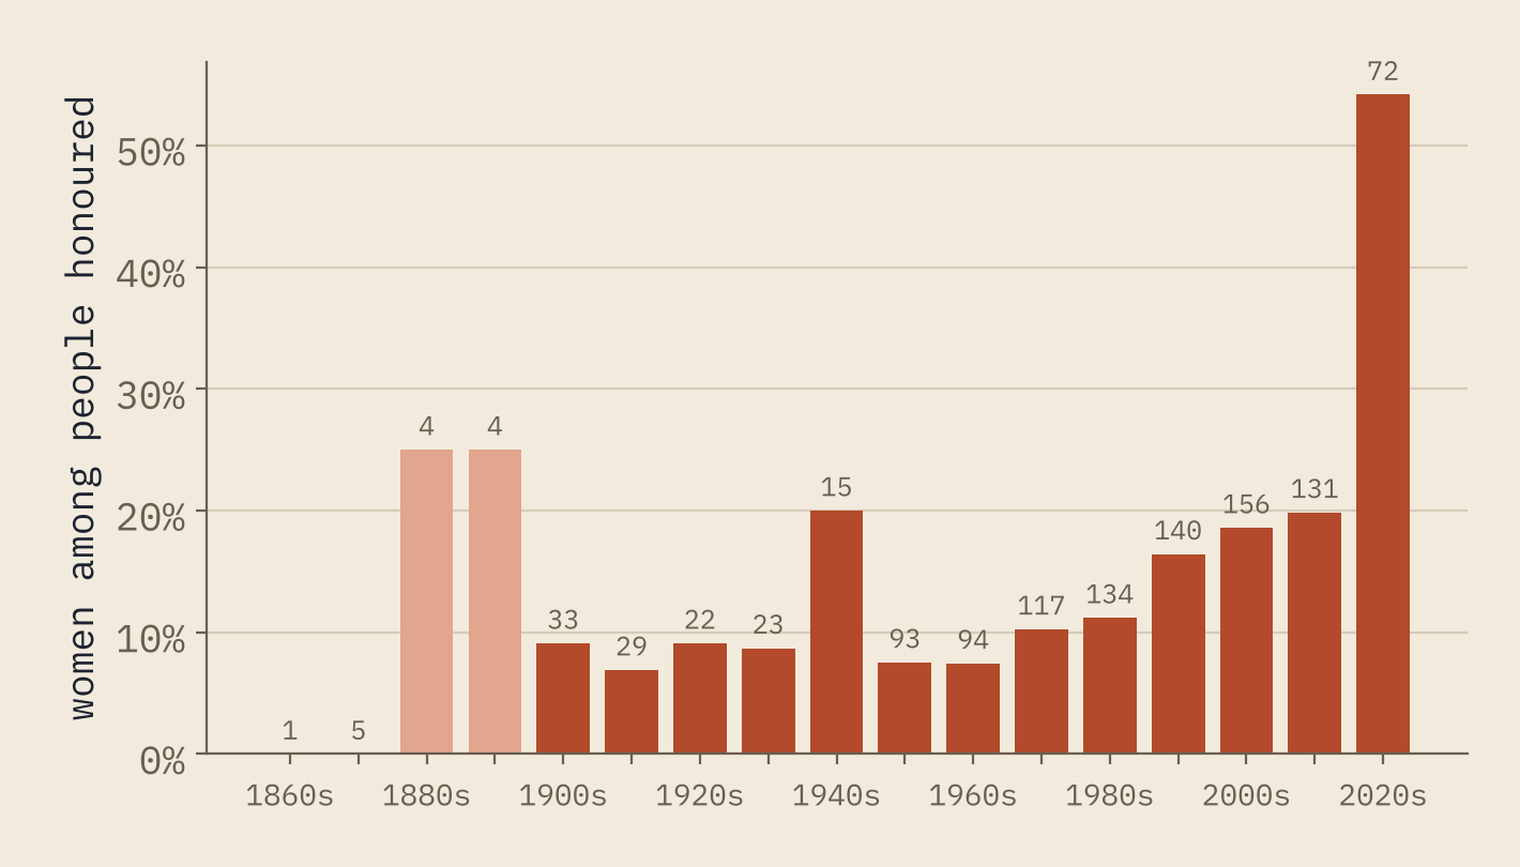
Wikipedia’s history of the scheme says the first woman to get a plaque was the actor Sarah Siddons, in 1876; her house was demolished and the plaque taken down. The oldest surviving plaque to a woman in my data is Fanny Burney’s, from 1885.
Before 2000, about one person in nine honoured with a London plaque was a woman. Since 2020 it is more than one in two.
The same tilt shows up by birth date. Of the plaque people born in the 1700s, 3% are women; born in the 1800s, 17%; born in the 1900s, 31%. Across all the Open Plaques people in Wikidata, from every scheme, women are 15%, very close to London.
Writers, painters and statesmen
I sorted each plaque by the first job its inscription mentions, so “Novelist lived here” counts as writing. Writers are the biggest group, with 227 people, then artists, architects and designers (202), scientists and doctors (139) and politicians and lawyers (122).
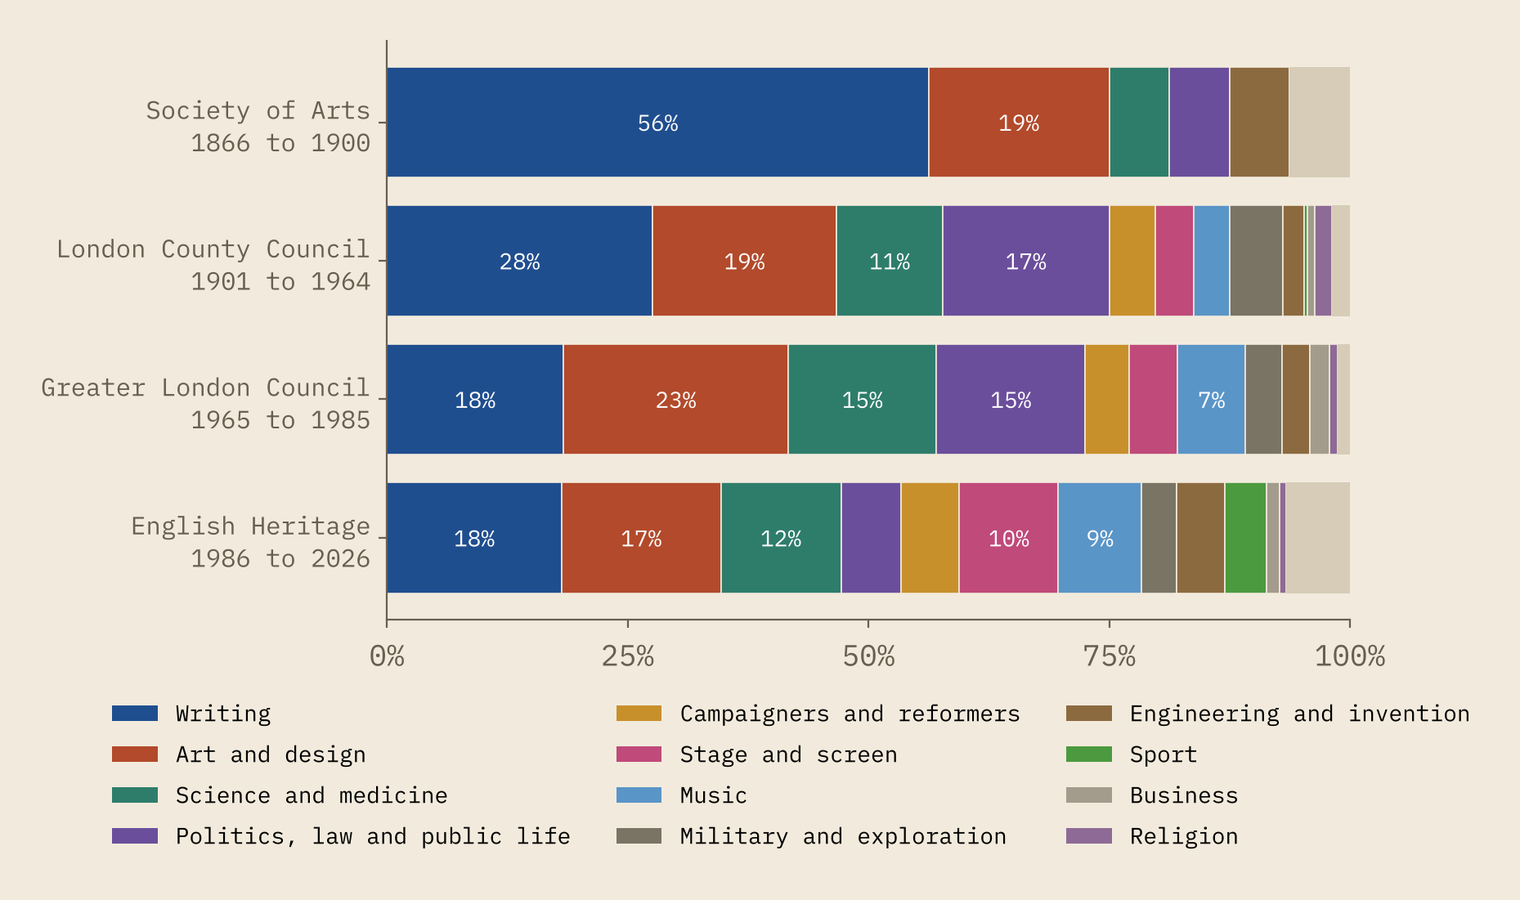
The mix has moved. Writing fell from 28% of those honoured by the London County Council to 18% under English Heritage, and politics and law from 17% to 6%. Actors, musicians and sportspeople took their place: Freddie Mercury has a plaque in Feltham, and the first sporting plaque in my data went up in 1963.
Women are 46% of the campaigners and reformers and 30% of the stage and screen group, but 2% of the engineers and inventors. Some of that is history: for much of the period these plaques cover, women were kept out of engineering, the professions and Parliament. Some of it is a choice about what counts as eminence.
London, and the places that beat it
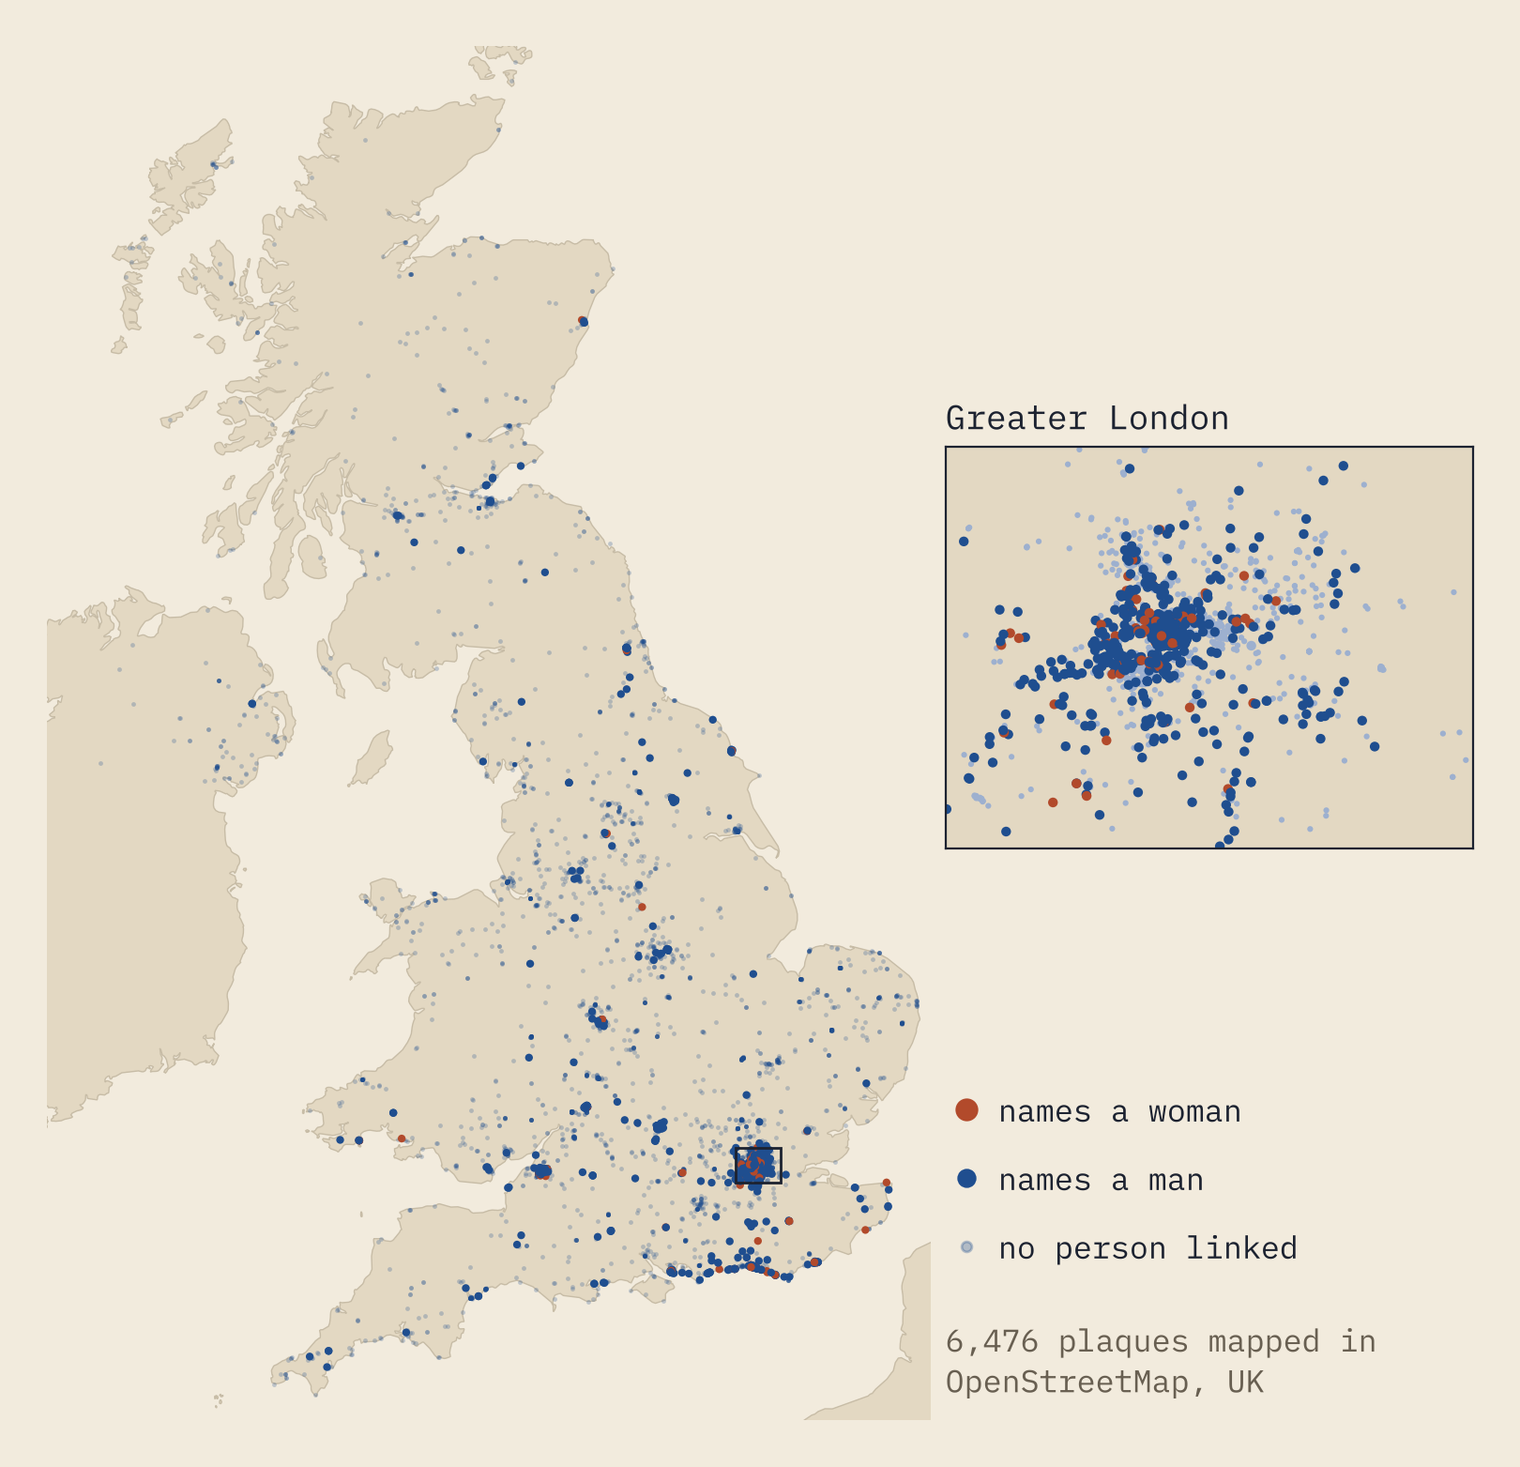
Of the 6,476 mapped plaques, 1,654 are in Greater London. London has 15% of the people of England and Wales but 28% of the plaques mapped there: 18.8 per 100,000 residents, against 8.2 in the rest. So the capital really is plaque-heavy.
But it is not the most plaqued place. Among the larger towns and cities, London comes 12th. Cheltenham has 103.5 mapped plaques per 100,000 people, York 76.0, Oxford 61.9, Bristol 59.3 and Brighton and Hove 53.3. Bradford has 3 mapped plaques and Stoke-on-Trent 1.
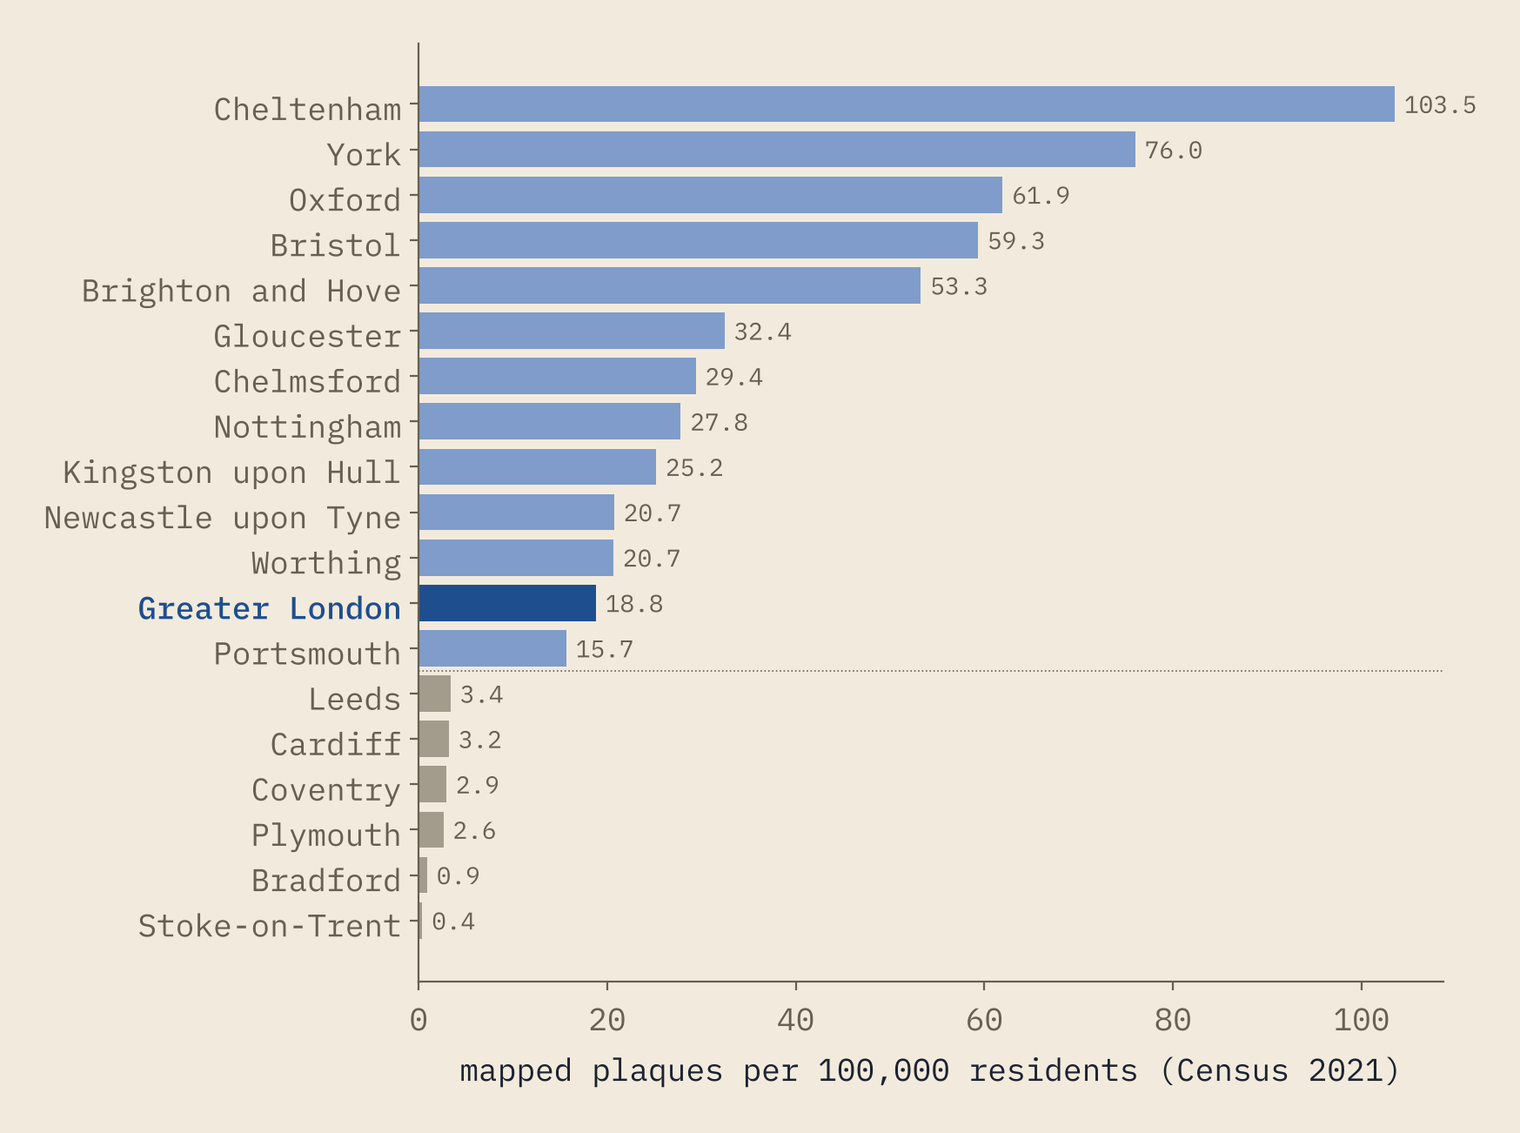
I would not read too much into the bottom of that list. These are mapped plaques, and mapping depends on volunteers. In York, 103 of 108 mapped plaques are linked to the Open Plaques database; in Liverpool, 2 of 50. A low number can mean few plaques, or plaques nobody has mapped yet.
Not always blue
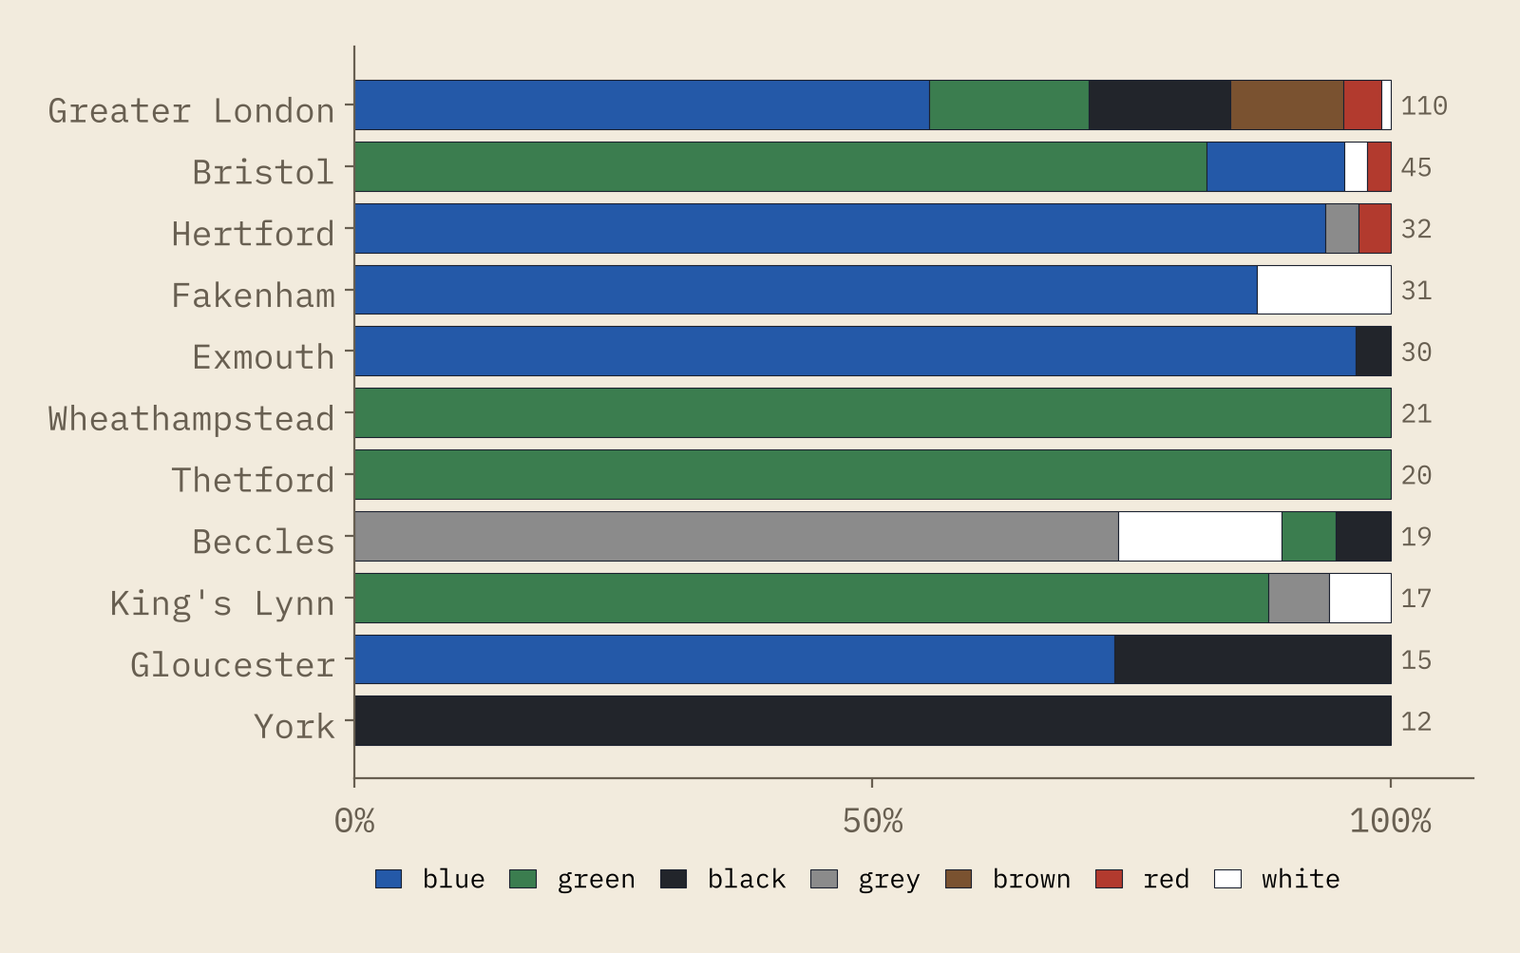
Only 564 mapped plaques have a colour recorded, so this is a sample. Just over half of them, 52%, are blue. But 37 of 45 in Bristol are green, every one in Thetford and Wheathampstead is green, and in York all 12 are black.
Firsts, lasts and repeats
The oldest-born person with a London plaque of their own is Sir Harry Vane, born in 1613. The youngest is Diana, Princess of Wales, born in 1961, with a plaque from 2021 on the flat in Earl’s Court where she lived before her marriage. English Heritage asks that a person has been dead for 20 years, but the median plaque goes up 51 years after the death.
And some people get more than one. Across the UK, 165 people are linked to more than one mapped plaque. Charles Dickens leads with 6, then John Logie Baird and Roald Dahl with 5 each.
How I did this
I parsed the wikitext of Wikipedia’s list of English Heritage blue plaques in London and its borough lists for Camden, Kensington and Chelsea, and Westminster, taking the people, inscription, address and year of each plaque. I matched 83% of the people to Wikidata and took their recorded gender; for the rest I used titles such as Sir and Dame, then first names, and checked the last few by hand. Occupation comes from the first job word on the plaque. The UK-wide plaques are OpenStreetMap objects tagged as memorial plaques or linked to Open Plaques, placed in regions and towns with ONS small areas and set against Census 2021 populations.
The caveats matter. The Wikipedia lists cover surviving plaques, so the early decades are thin. Gender and occupation are inferred, so a few individual entries will be wrong, though not enough to move the shares. And Open Plaques and OpenStreetMap are volunteer records: they show what people have photographed and mapped, which differs a lot from town to town. For another look at what Britain keeps, see my Still Standing study of the oldest buildings.
Notes and sources
- Plaque lists: Wikipedia, List of English Heritage blue plaques in London and its lists for Camden, Kensington and Chelsea, and the City of Westminster; history of the scheme from Wikipedia, Blue plaque (CC BY-SA 4.0), retrieved 27 October 2026.
- People: Wikidata (CC0), items with an Open Plaques subject ID, via QLever. Open Plaques: openplaques.org.
- Plaque locations and colours: © OpenStreetMap contributors (ODbL).
- Census 2021 and geography: Office for National Statistics, Open Government Licence v3.0. First-name fallback: US Social Security baby names 1880 to 2009 (public domain). Coastline: Natural Earth.
- Paper, data and code: Zenodo and GitHub.
- I wrote the text, with drafting and editing assistance from Claude (Anthropic), which also helped prepare the analysis code. I reviewed and checked all text and results.

