
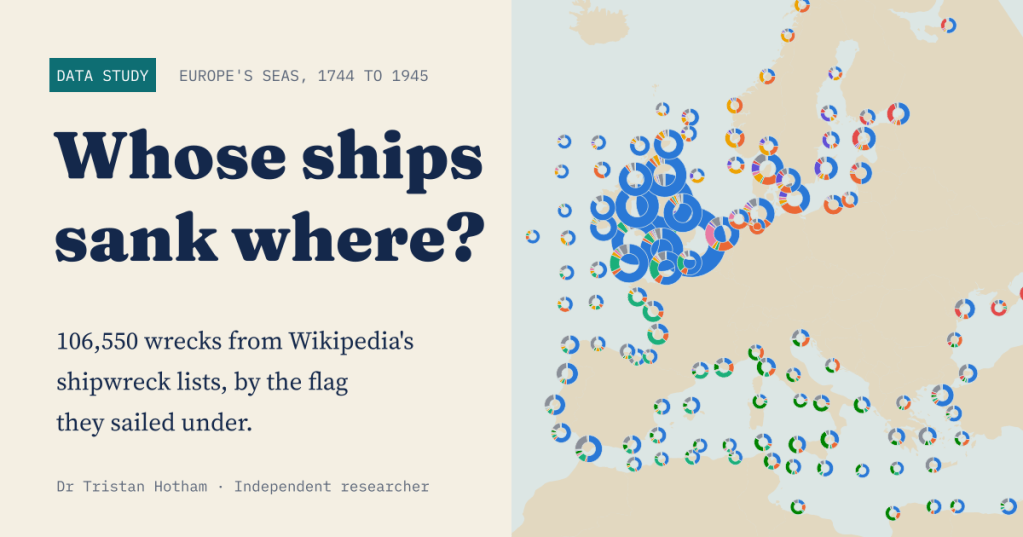
Two centuries of shipwrecks in Europe’s seas, from the age of sail to 1945, each with the flag the ship sailed under. I put 106,550 of them on the map to ask a simple question: in each sea, whose ships were lost?
Wikipedia keeps a remarkable set of lists. For almost every year from the 1740s to 1945, and for every month from 1820, volunteer editors have written up the ships that were wrecked, foundered, burnt, captured or sunk, mostly from the shipping columns of Lloyd’s List and the newspapers. Each entry gives the ship’s name, her flag, and a line on what happened and where: “driven ashore and wrecked near Hjørring, Denmark”, “foundered in the North Sea off Sunderland”.
For an earlier post I used these lists to ask whether lighthouses worked. This time I took all 236,326 entries, worked out where each ship was lost, and kept the 106,550 that put the wreck in a European sea, from the Arctic coast of Norway to the Black Sea. Then I grouped them by flag.
A map of donuts
The map below gathers the wrecks into squares of about 230 km, and each donut shows the flags lost in its square. The first thing it shows is the shape of the record. A great blue cluster sits on Britain: 65% of all the wrecks I could place lie nearest to a British or Irish coast, and 68% of all of them flew the British flag.
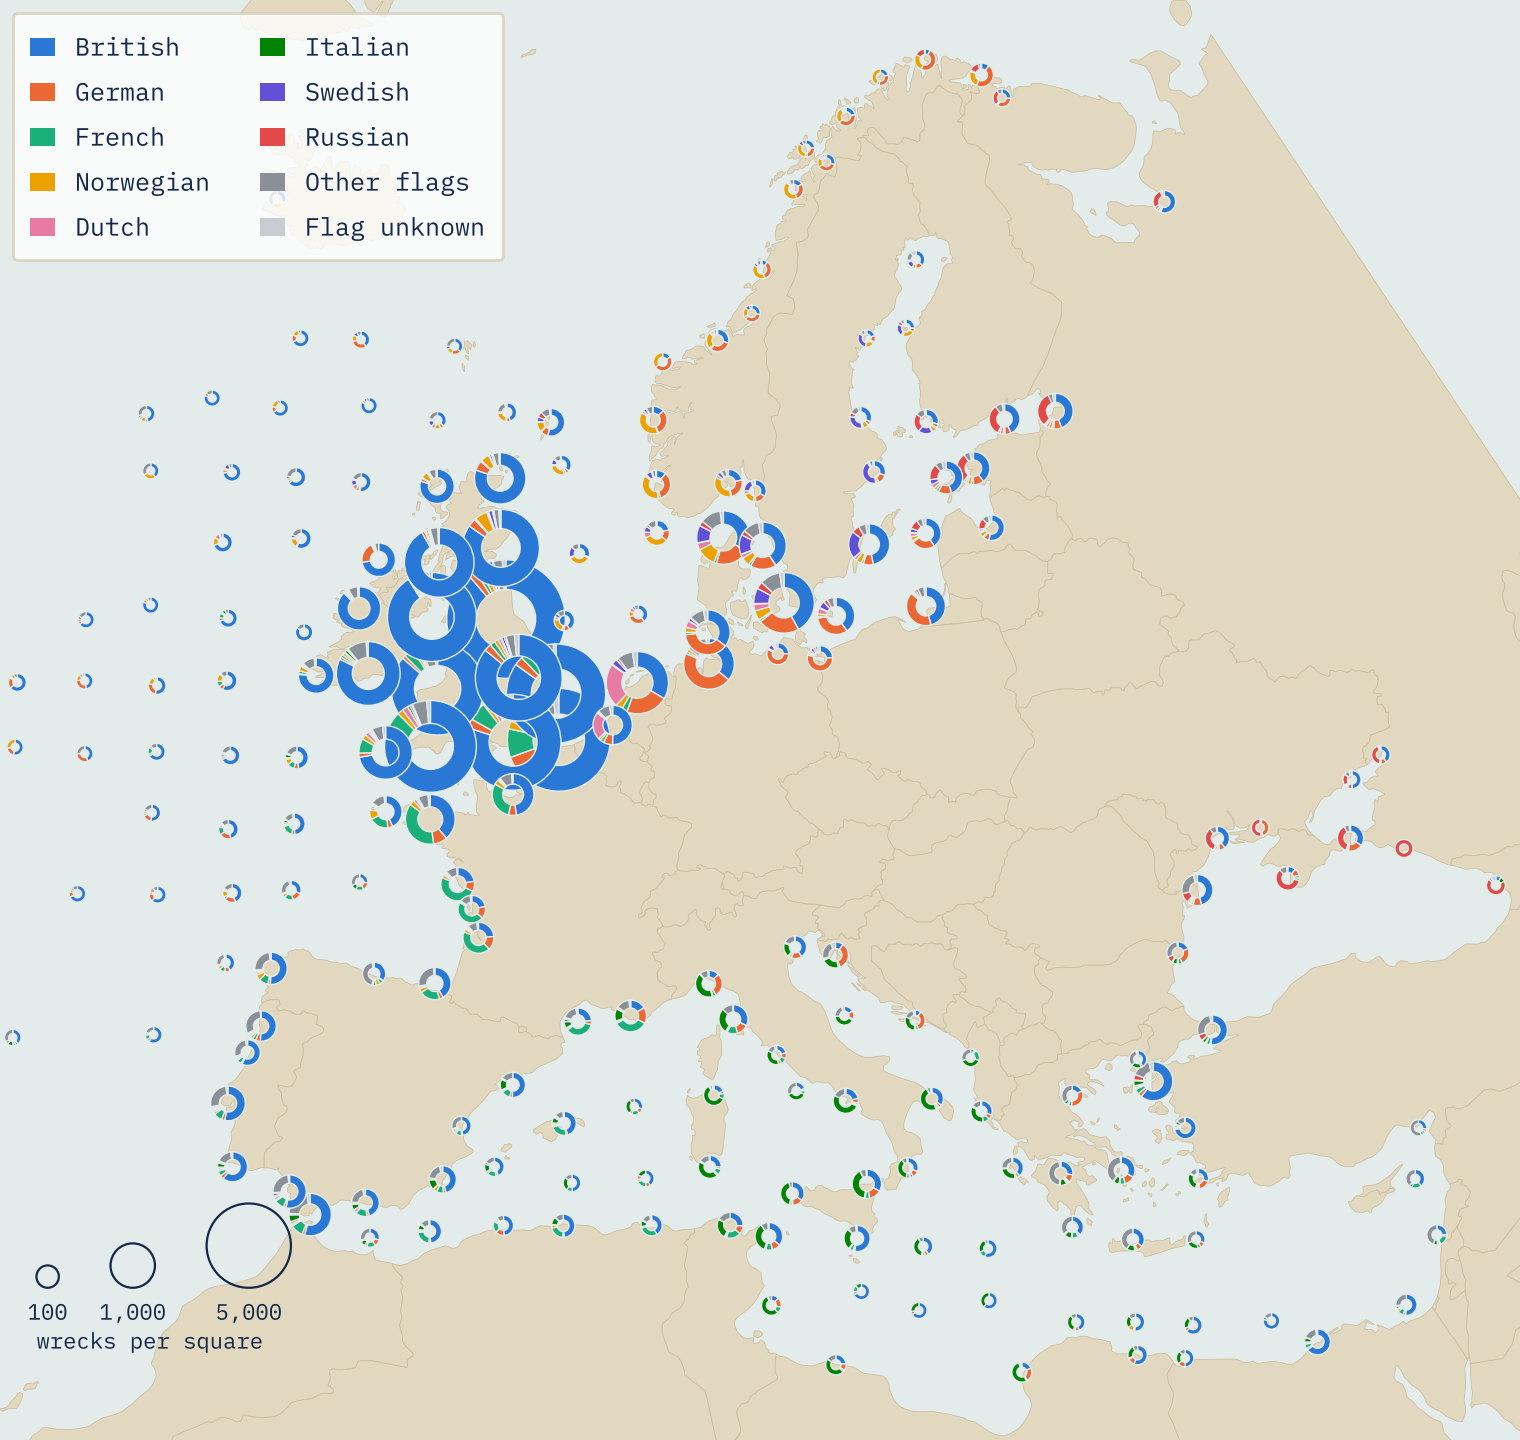
The second thing it shows is more interesting. Move away from Britain and the colours change. The Biscay coast turns French green. The Baltic fills with German, Swedish and Russian ships. Norway’s coast is Norwegian yellow and German orange, the Mediterranean is mixed with Italian green, and the Black Sea has a strong band of Russian red.
Sea by sea
Grouping the wrecks by sea makes the pattern plain. The three seas round Britain are nearly all British: 89% in the Irish Sea and its approaches, 74% in the North Sea and 70% in the English Channel. These were the home waters of the world’s largest merchant fleet, and the waters Lloyd’s List watched most closely.
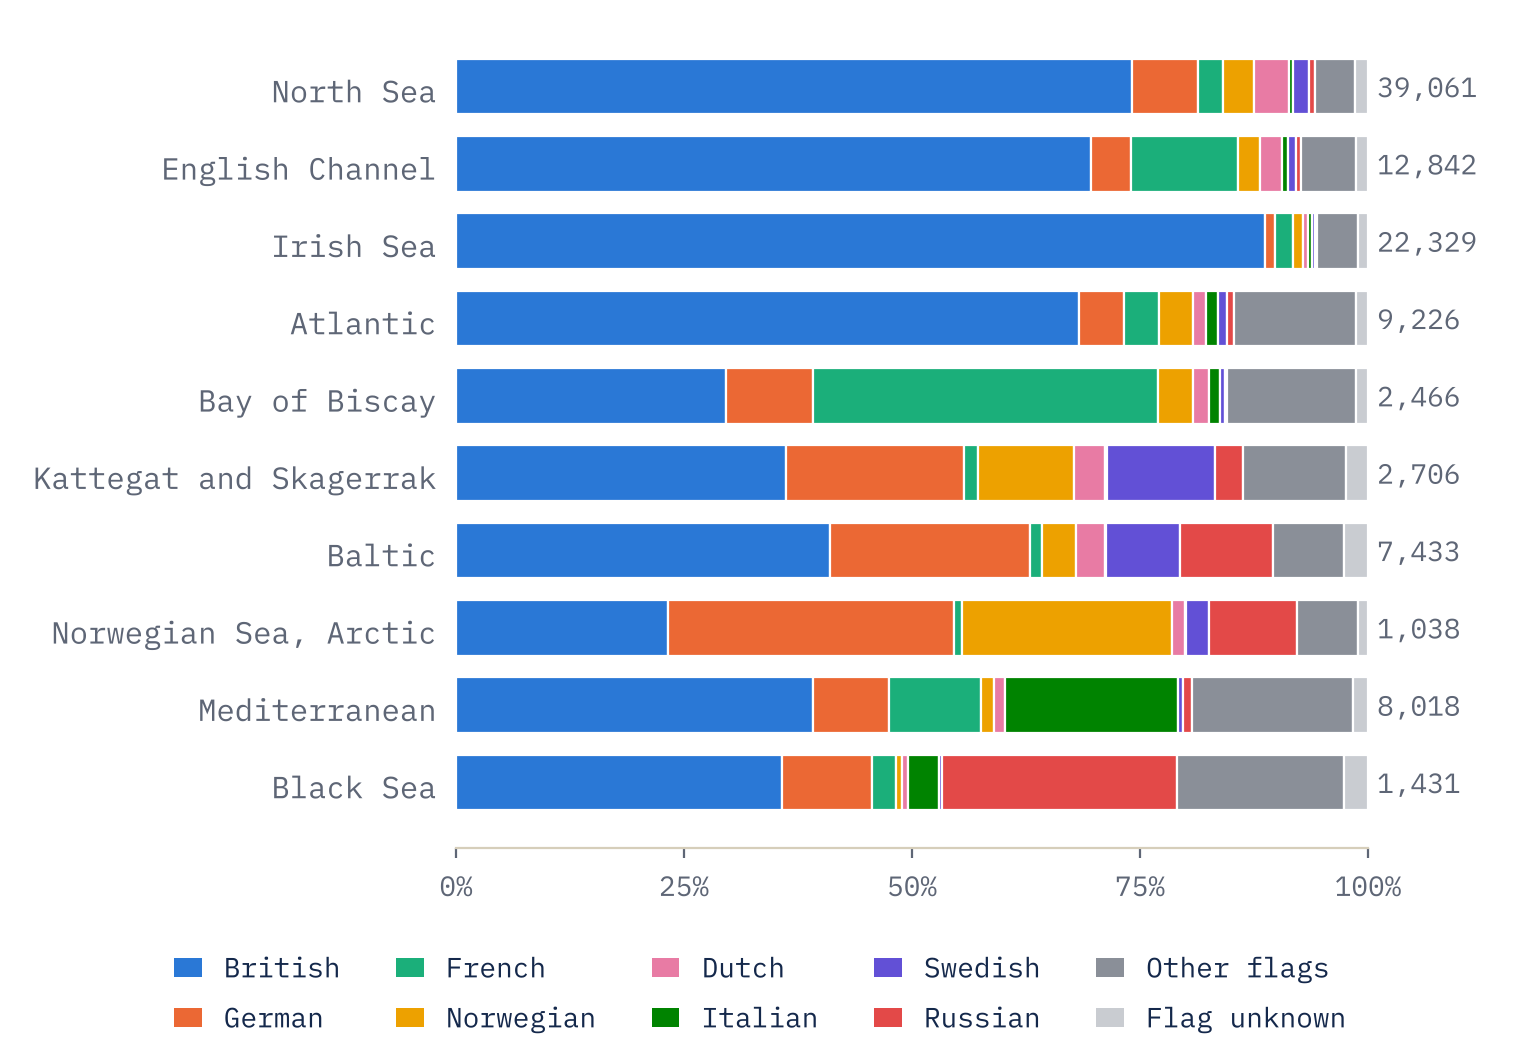
Further out the British flag is still the largest single group in most seas, but only just. It is 41% in the Baltic, with German ships next on 22%; 39% in the Mediterranean, with Italian ships on 19%; and 36% in the Black Sea, with Russian ships on 26%. Two seas break the rule. In the Bay of Biscay the French flag leads, 38% against 30% British. In the Norwegian Sea and the Arctic, German ships lead with 31%, most of them lost in the Second World War.
To put one number on how mixed a sea was, I used the “effective number of flags”: how many equally common flags would give the same chance that two wrecks picked at random share a flag. The Irish Sea scores 1.24, close to one flag. The most mixed sea is the Kattegat and Skagerrak, the narrow waters between Denmark, Norway and Sweden through which all the Baltic trade passed, on 4.63. The Mediterranean is close behind on 4.55.
From sail to the world wars
Over time, the British share peaks during the long wars with France. From 1793 to 1815 it was 77% of placed wrecks, and in the five years from 1810 it reached 81%. It stayed above 70% for most of the nineteenth century, while Norwegian ships, the rising fleet of the late 1800s, grew from 1.3% of the record before 1860 to 4.0% after.
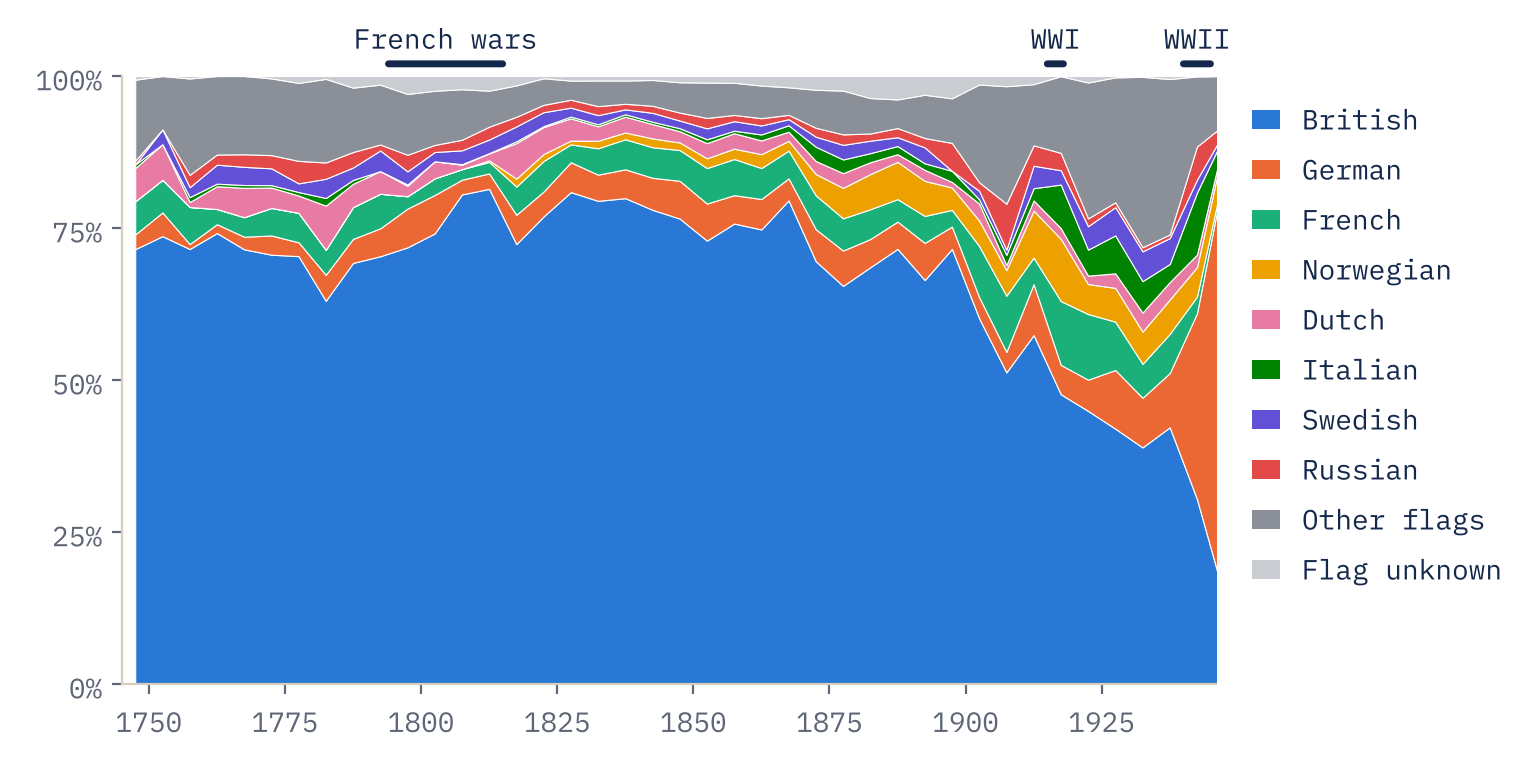
Then the twentieth century rearranges everything. In the First World War, German submarines sank neutral ships as well as Allied ones, and neutral Norway lost heavily: Norwegian ships were 10% of the wrecks I placed from 1914 to 1918, against 4% in the half century before. In the Second World War the largest flag is German, at 33%, ahead of British at 30%. Most of those German losses (71%) were under a naval ensign: minesweepers, patrol boats, U-boats and transports, lost everywhere from the Arctic to the Black Sea, but most often in the Mediterranean.
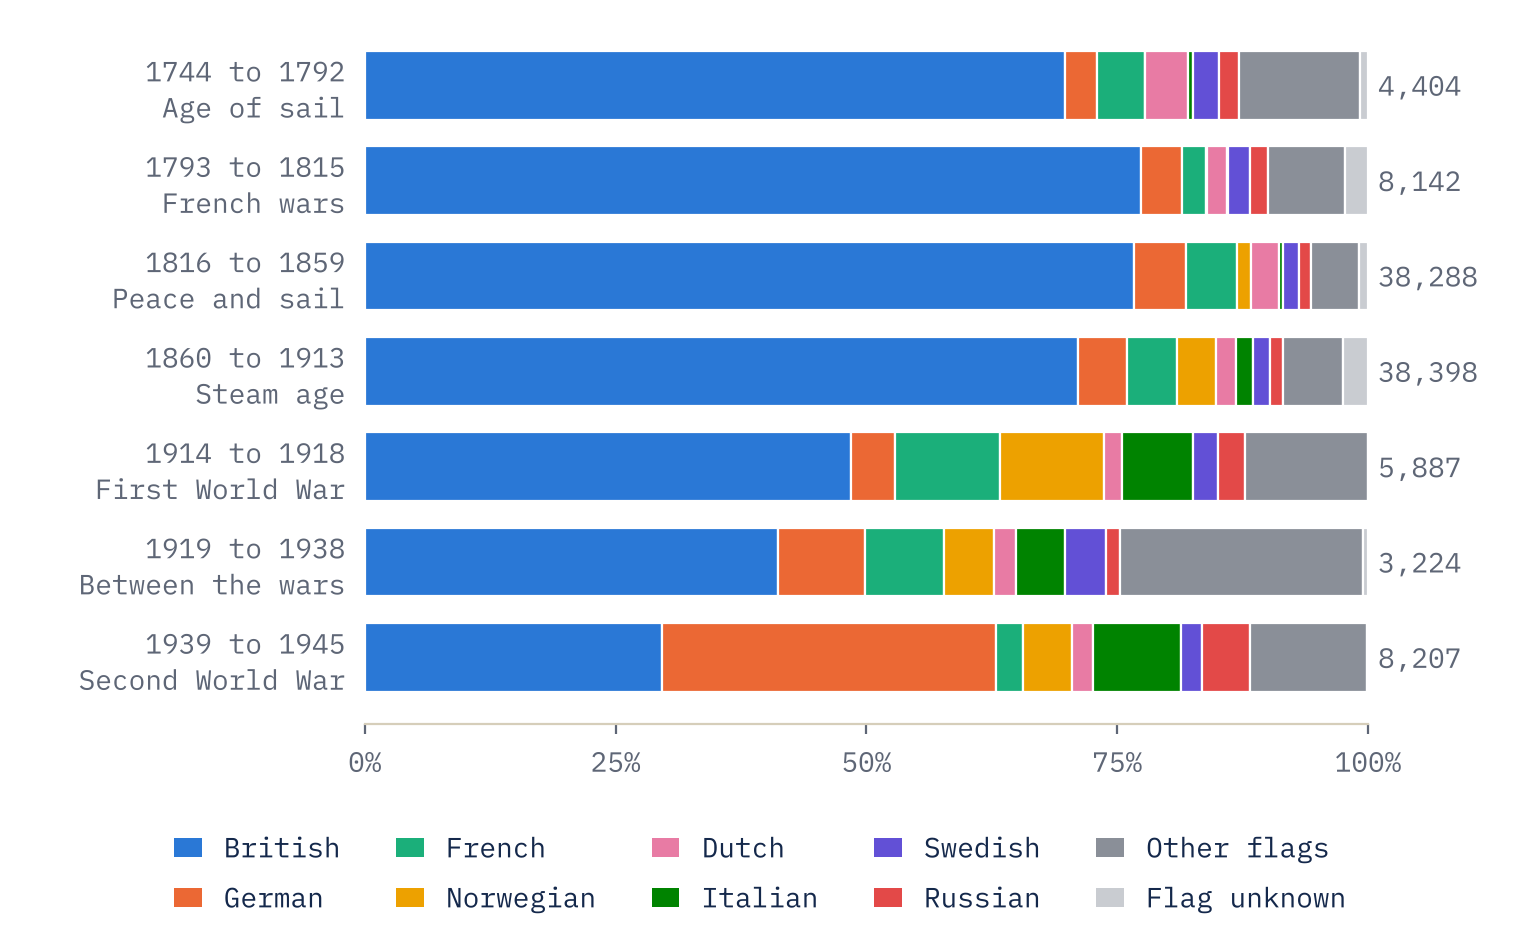
In two centuries of the record, only one war puts any flag but the British at the top of the list of losses in Europe’s seas: the Second World War.
Off whose coast?
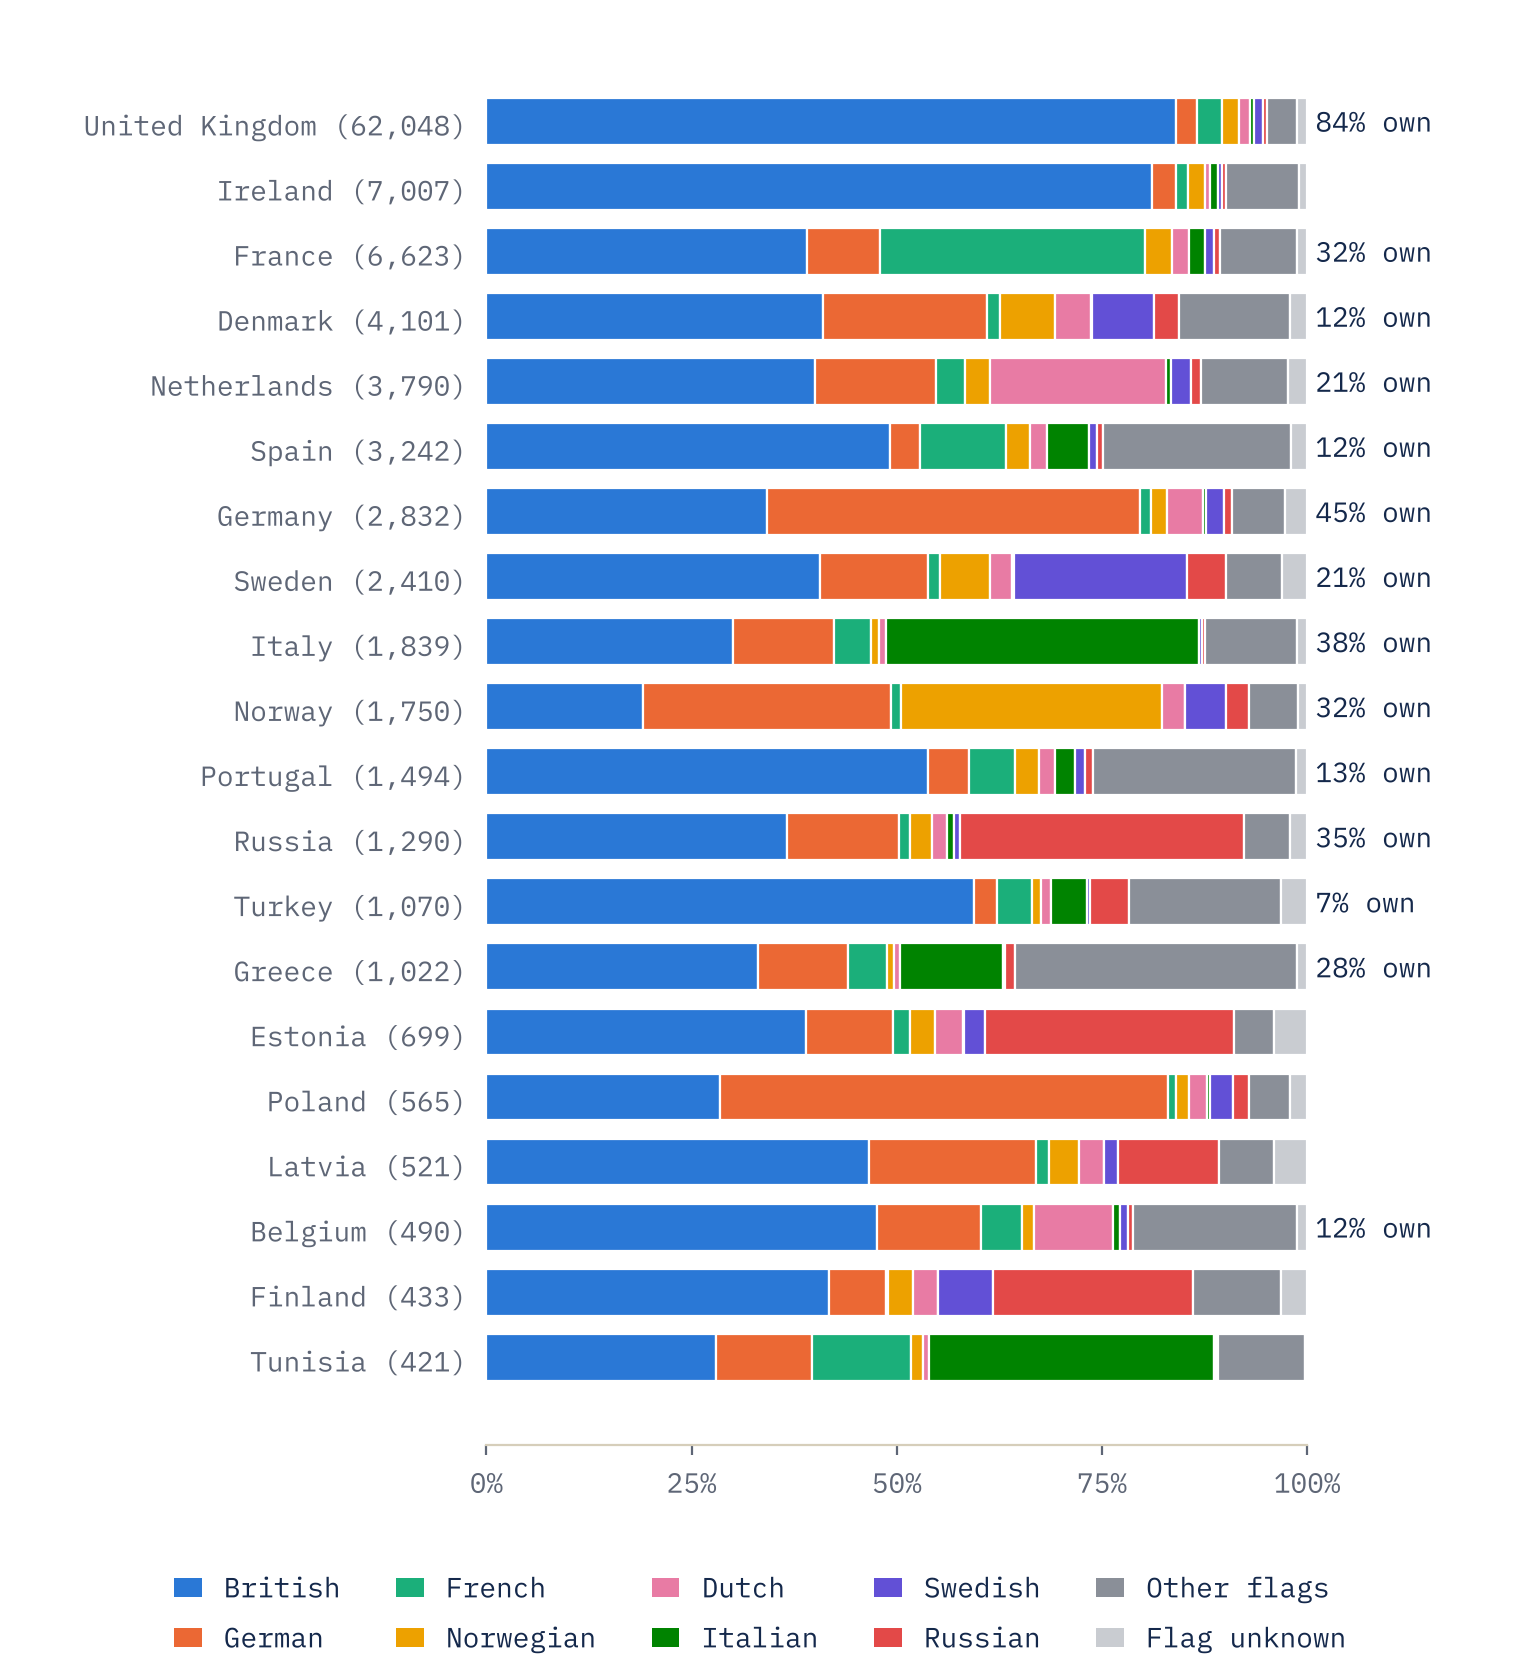
Grouping wrecks by the country whose coast is nearest gives one more view. Off other countries’ coasts the British flag is still the most common on 13 of the 18 coasts with at least 400 wrecks. Off France, 39% of the wrecks were British and 32% French; off Spain, 49% British and 12% Spanish. The exceptions are Germany, where German ships lead (45%), Italy (Italian, 38%), Norway (Norwegian, 32%, with German ships close behind), Poland’s old Prussian coast and Tunisia.
Whose record is this?
The big caveat is that this is a British record. Lloyd’s List was a London paper, and the papers that fed it were British. They saw British ships, British coasts and the ports British ships used far better than a Swedish schooner lost in the Gulf of Bothnia. So the 68% is a share of the record, not of all the ships that were lost. What I trust more are the contrasts: between seas, and between eras. Those line up well with what we know about who traded where, and with the wars.
The record is also uneven over time. It is thin in the eighteenth century and between the wars (161.2 wrecks placed a year from 1919 to 1938, against 782.5 from 1816 to 1913), which is why I compare shares rather than counts.
How I did this
I parsed every entry on the “List of shipwrecks” pages from 1700 to 1945 into ship, flag, date and description, extending the parser from my lighthouse study. For each description I cut away the voyage (“on a voyage from Riga to Hull”), later events such as refloating or towing, and other ships named in brackets, then placed the wreck at the coordinates given in the list if there were any, at the Wikidata position of the ship’s wreck where that agreed with the text, or else at the first linked place that was not a whole sea or country. 82,194 entries could not be placed. Wrecks more than 50 km inland, on lakes, or more than 60 nautical miles from the place named were left out. Each wreck’s sea is the nearest Natural Earth sea area, grouped into ten, and I grouped 232 different flag names into national groups that hold across changes of state, such as Prussia and the Hanseatic cities into German.
To check the placing, I read 100 random entries against the place chosen: 92 were right, 5 were at the centre of the right county, and 3 were wrong (two of those are now excluded by the far-offshore rule and one fixed). Where a description names a sea, it matches the sea I assigned in 92% of cases.
Notes and sources
- Wreck records: Wikipedia contributors, Lists of shipwrecks (CC BY-SA 4.0), largely compiled from Lloyd’s List and contemporary newspapers.
- Coordinates of places linked from the lists: Wikipedia, via the MediaWiki API (CC BY-SA 4.0). Wreck positions: Wikidata (CC0).
- Sea areas, coasts and map land: Natural Earth (public domain).
- Companion study: Did Lighthouses Work?
- Paper, data and code: Zenodo and GitHub. Derived data and text CC BY-SA 4.0; code MIT.
- I wrote the text, with drafting and editing assistance from Claude (Anthropic), which also helped prepare the analysis code. I reviewed and checked all text and results.

