
In 1086 the Conqueror’s commissioners counted England’s households, village by village. I set every place they named against the 2021 census to see whether size then still predicts size now. Mostly, it does not.
Most of my research is about attention and power in the present: which parties, posts and places get seen. But Domesday Book poses a question I could not resist. In 1086 the king’s commissioners recorded, manor by manor, the villagers, smallholders and slaves who worked the land, the plough teams and mills, and what each estate was worth. They named 14,334 places, and most of them are still on the map.
That makes it a rare natural experiment. If size in 1086 still shaped England today, the big villages of Domesday would be the big towns of now, and the small ones would still be small. So I tested it, parish by parish, across 935 years. The short answer is that Domesday is not destiny.
Every place, then and now
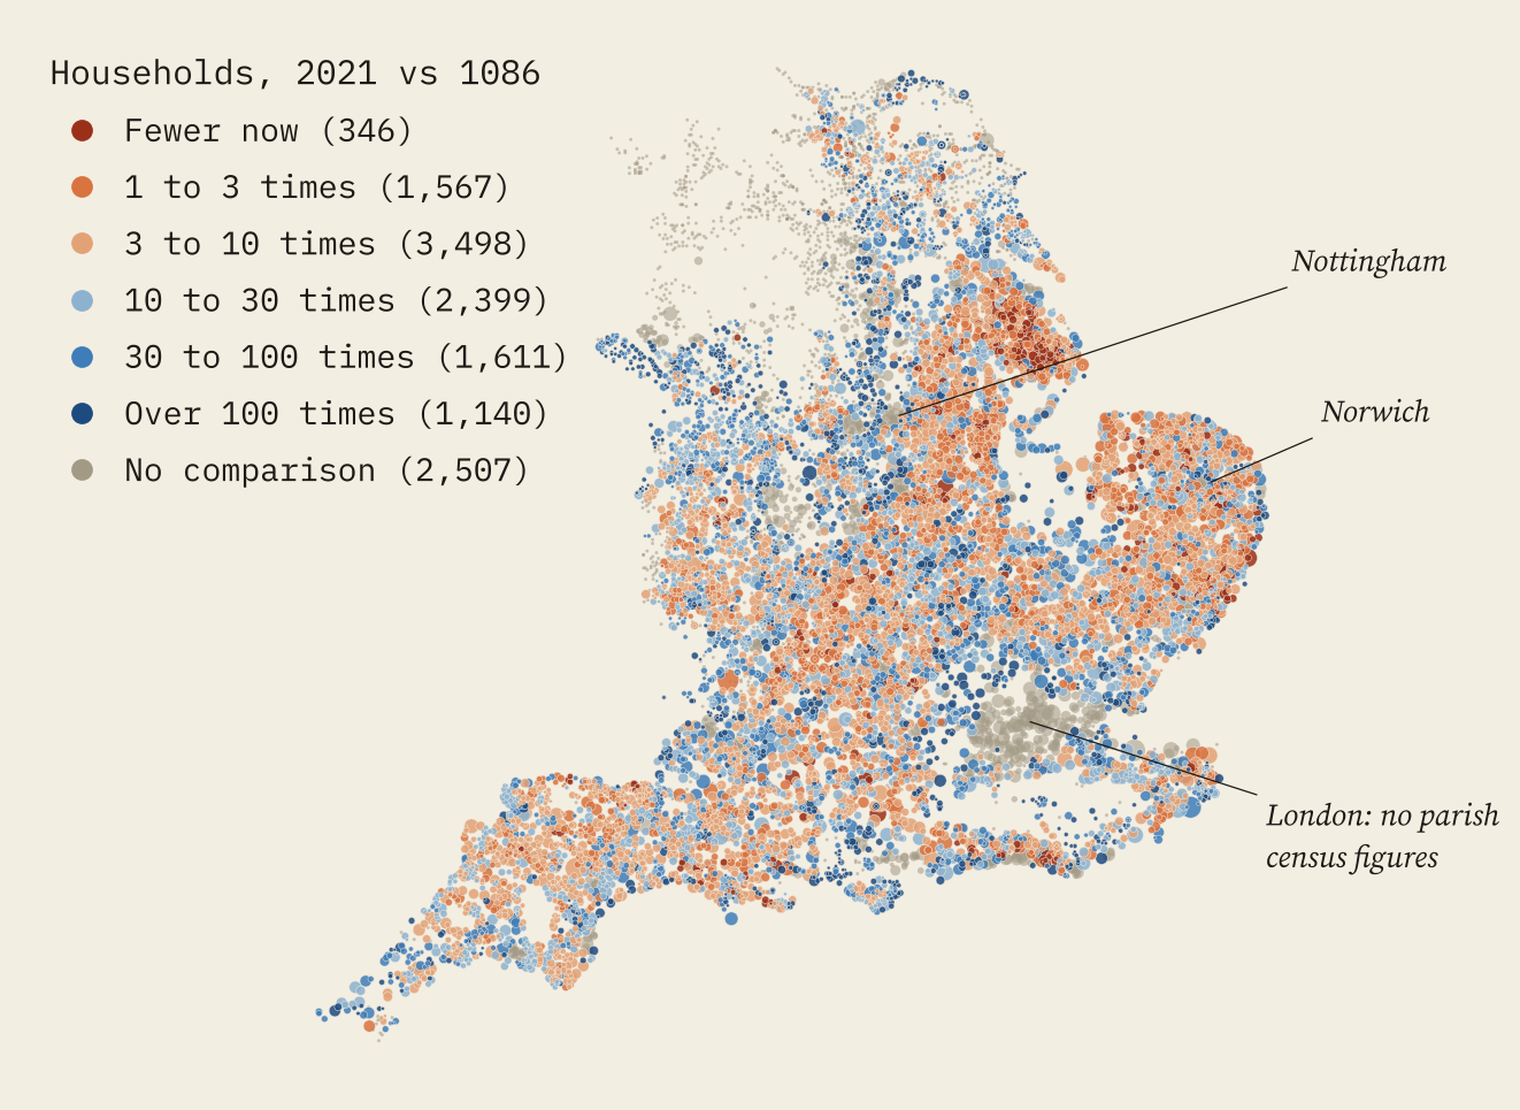
Each dot is a place named in Domesday Book. The typical parish has about 9.5 times as many households now as it had in 1086. Orange dots grew less than that, blue dots grew more, and the darkest red ones have fewer households today than the commissioners counted.
Look at the grey first, because it matters. The census figures I used exist only for civil parishes, and most big towns and cities are not parished. So most of London, Norwich, Nottingham, Derby, Canterbury and many other towns have no 2021 figure and drop out of the comparison. That is 185 areas holding 9.4% of the households of 1086. What follows is a story about rural England and its small and middling towns, not about the great cities.
A weak inheritance
Many modern parishes hold more than one Domesday place, so I added up the households of every Domesday place inside each parish and set that against the parish’s households in 2021. That gives 6,376 parishes with a figure at both dates.
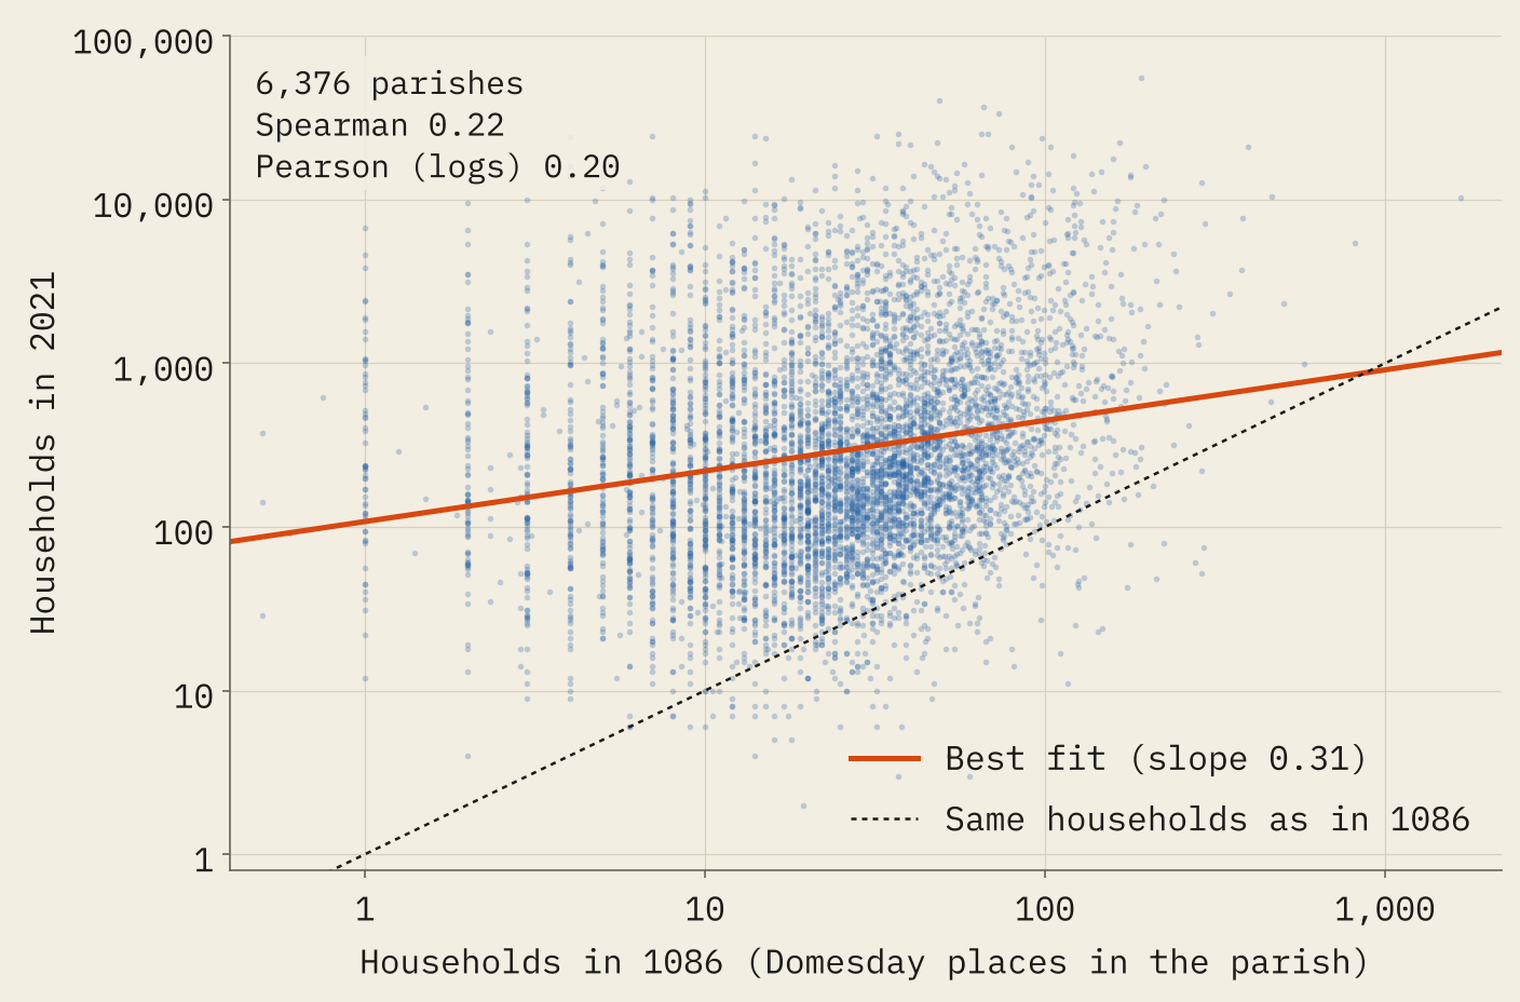
The rank correlation between the two is 0.22, where 1 would mean the same order at both dates. On log scales, size in 1086 explains about 4% of the variation in size today. The link is real and it points the right way: bigger then means bigger now, on average. But it is faint.
Put another way, a parish with ten times as many households as another in 1086 has, on average, only about twice as many today. Of the 647 parishes in the biggest tenth in 1086, just 139 (21.5%) are in the biggest tenth now. Chance alone would put about one in ten there. Meanwhile 60 of the 743 parishes in the smallest tenth have climbed into the top tenth.
Bigger then means bigger now, on average. But knowing a parish’s size in 1086 tells you very little about its size today.
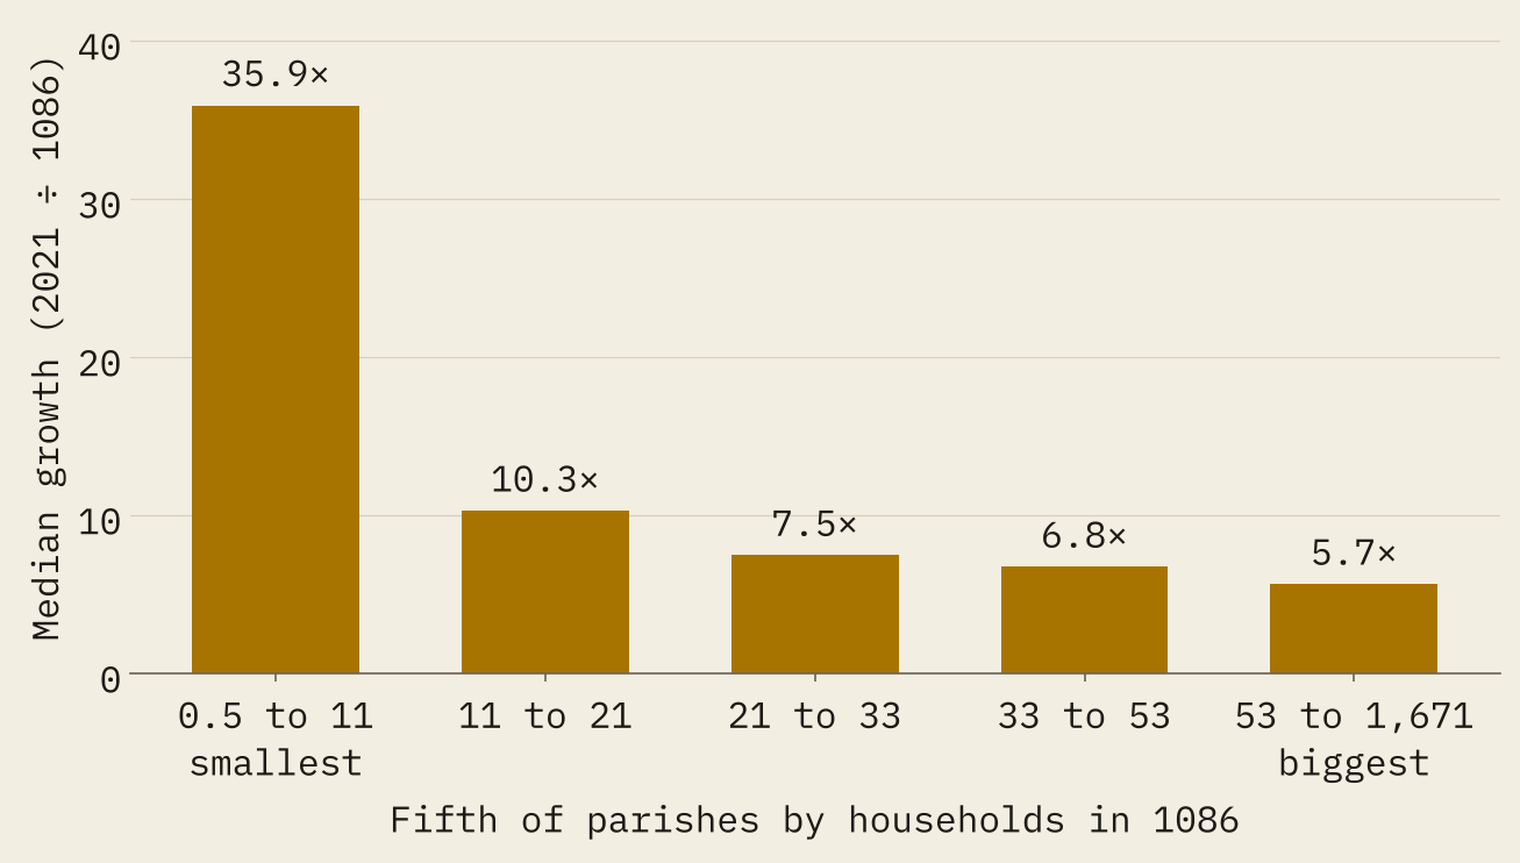
Almost everywhere grew. Only 214 parishes (3.4%) have fewer households now than Domesday recorded. And the small grew fastest: the smallest fifth of parishes grew by a median of 36 times, the biggest fifth by 5.7 times. Some of that is what noisy counts alone would produce, since a place Domesday undercounted looks small in 1086 and then seems to grow fast. So I would not lean on the exact numbers. But the picture does not depend on them.
I checked the result several ways and it barely moves. Without Yorkshire, whose record is thin, the rank correlation is 0.22. Using only parishes where every Domesday place has a household figure, 0.23. Against 2021 residents rather than households, 0.22. For the 3,862 Domesday places that sit alone in their modern parish, so no adding up is needed, 0.21.
Fallen giants
Of the 4,058 parishes with at least 20 households in 1086, 185 have fewer households today. They cluster in the east: 61 are in Lincolnshire, 23 in Suffolk and 21 in Norfolk.
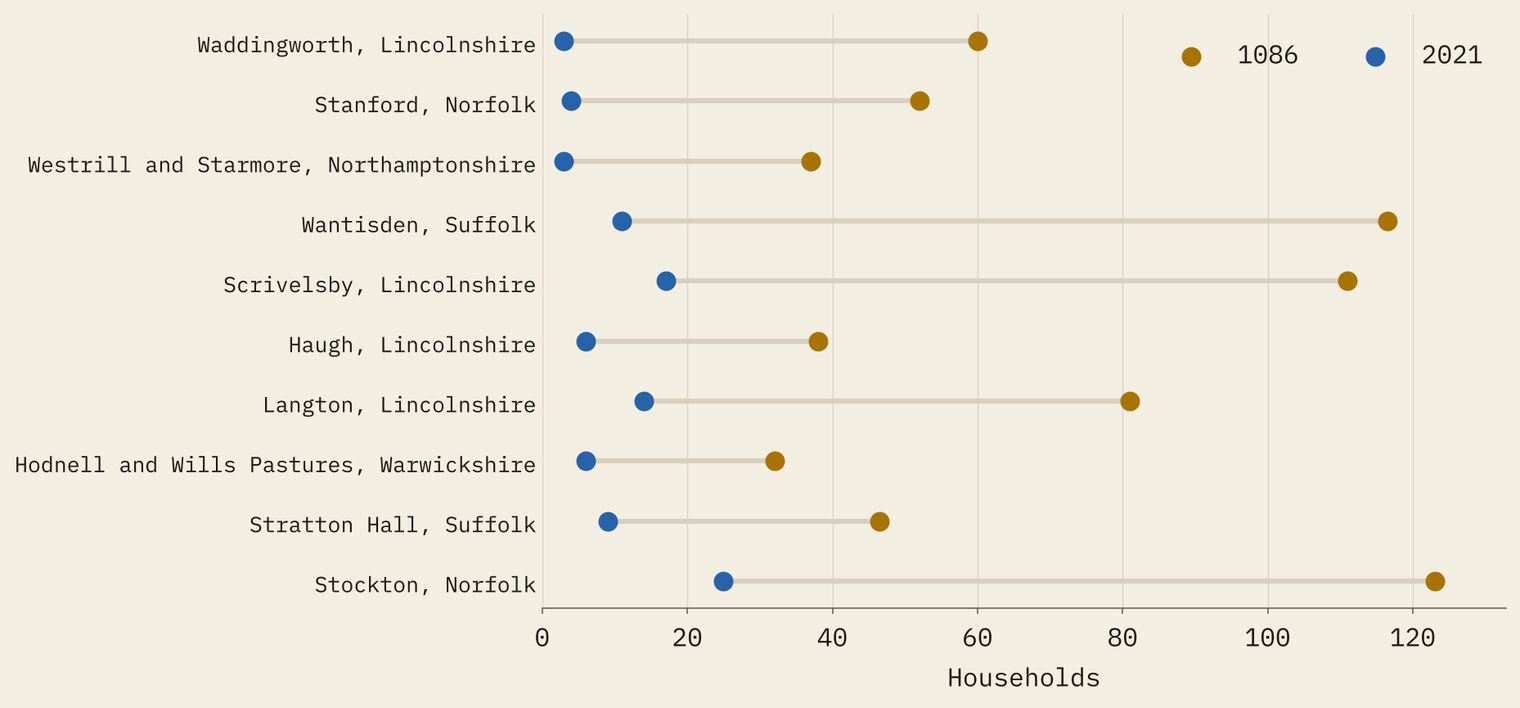
Waddingworth in Lincolnshire tops the list: 60 households in 1086, 3 in 2021, with 7 residents. A caution, though. Its 60 households come from two entries that each describe a holding of six carucates there, one of them disputed between two lords, so some of the same people may be counted twice. Even halved, the fall is steep.
Domesday nobodies
At the other end are the places Domesday barely noticed. The biggest riser is Bracknell, where the commissioners recorded 14 households at Easthampstead and the 2021 census counts 24,518. Crewe went from 15 to 23,730, and Shenley Brook End, now part of Milton Keynes, from 10 to 10,243. Macclesfield had just 4 households in 1086 and has 24,195 now.
Here the modern parish carries a modern name, and the Domesday place inside it may be a hamlet now swallowed by a town. That is part of the story: much of today’s population lives where Domesday recorded very few households. The missing cities would add more names to this list if they had parish figures.
Where 1086 still shows
Persistence is not the same everywhere. Within Rutland the rank correlation between parish size in 1086 and 2021 is 0.57, though from only 24 parishes. Within Sussex it is 0.01, which is no link at all. Of the 33 counties with at least 20 parishes, 6 reach 0.4 or more and 8 fall below 0.2.
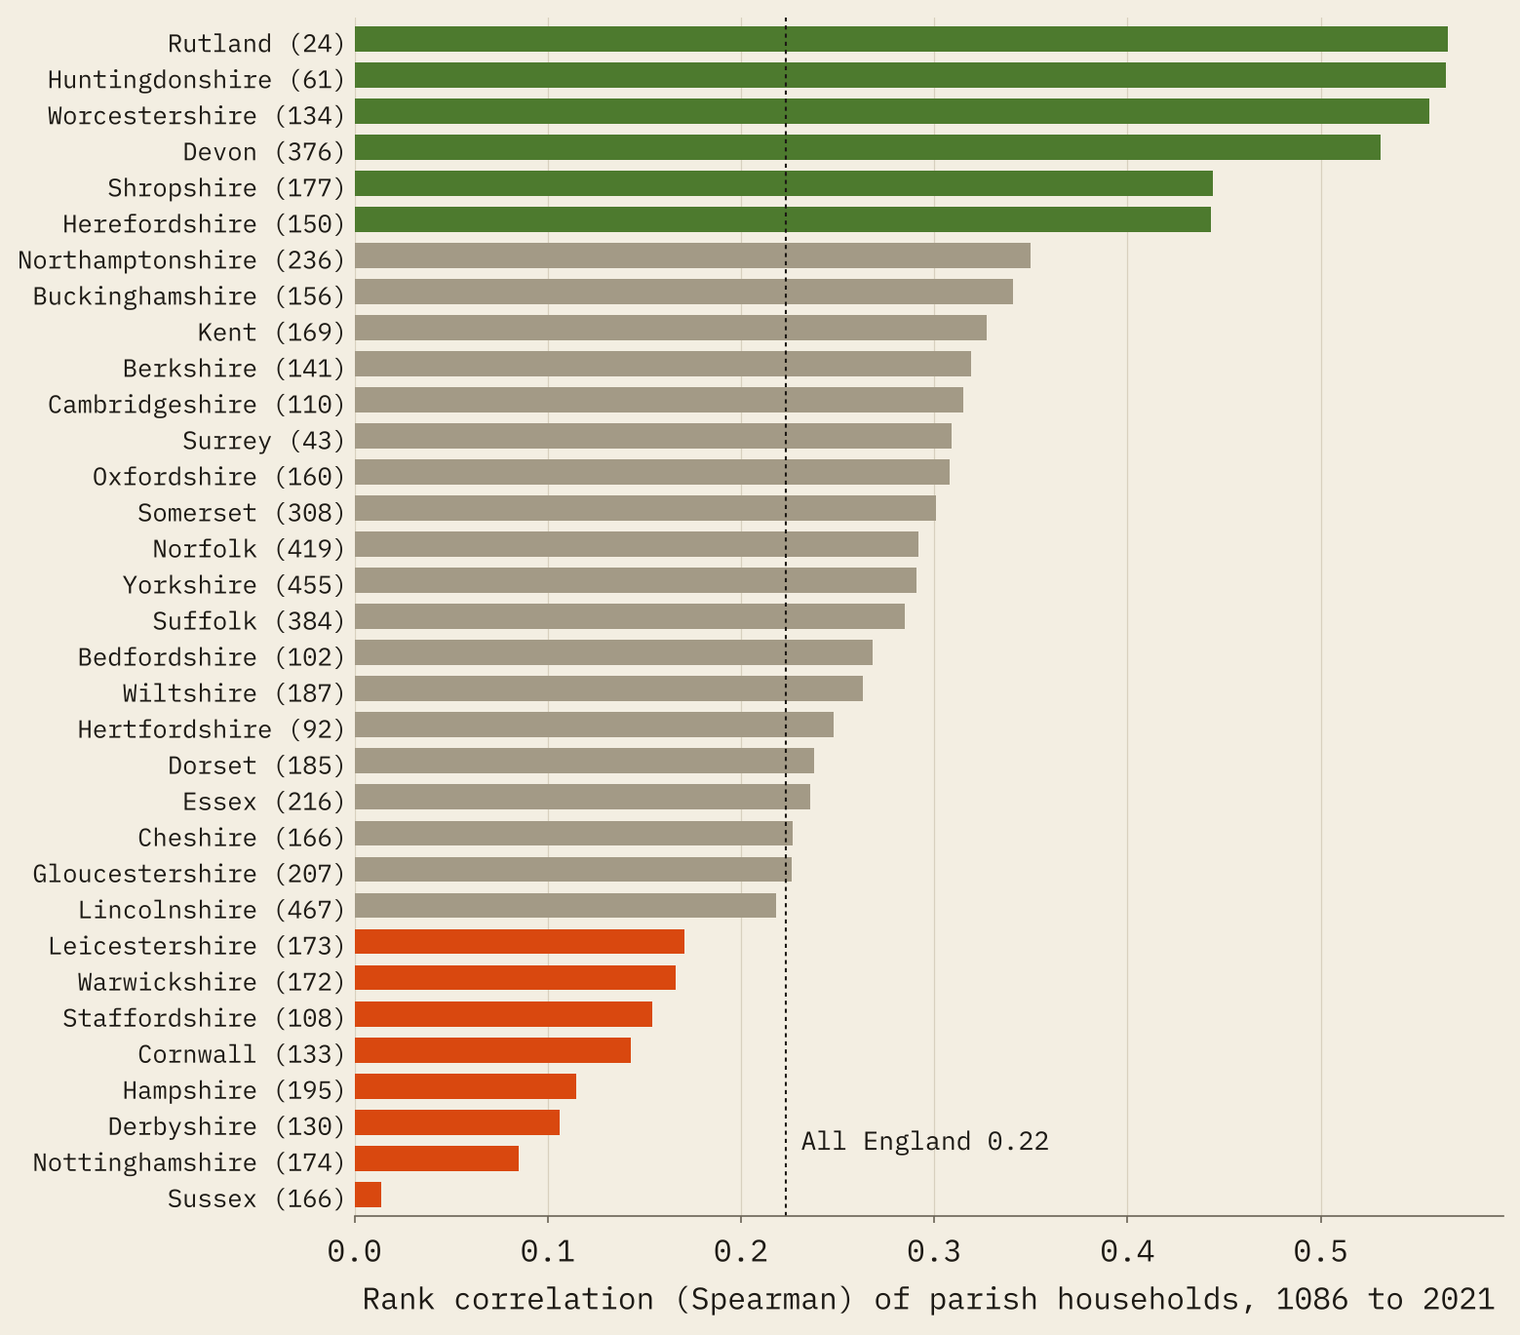
Zoom out and the pattern of 1086 is much clearer. Add up each county’s parishes and the rank correlation between county totals in 1086 and 2021 is 0.70. Which county a parish is in matters about as much as its own size: county alone explains 5.8% of the variation in parish households today, 1086 households alone 5.3%, and the two together 12.9%. Domesday still describes England in broad strokes. It just cannot pick out the winners.
Wealth, ploughs and mills
Domesday recorded much more than people. Perhaps the richest places of 1086, or the ones with mills and plenty of plough teams, were the ones set up to grow. They were not, much. Adding the value of each estate, its plough teams and its mills to the model takes the explained share from 5.3% to just 6.3%. Parishes with a mill grew by a median of 8.4 times, those without by 9.4.
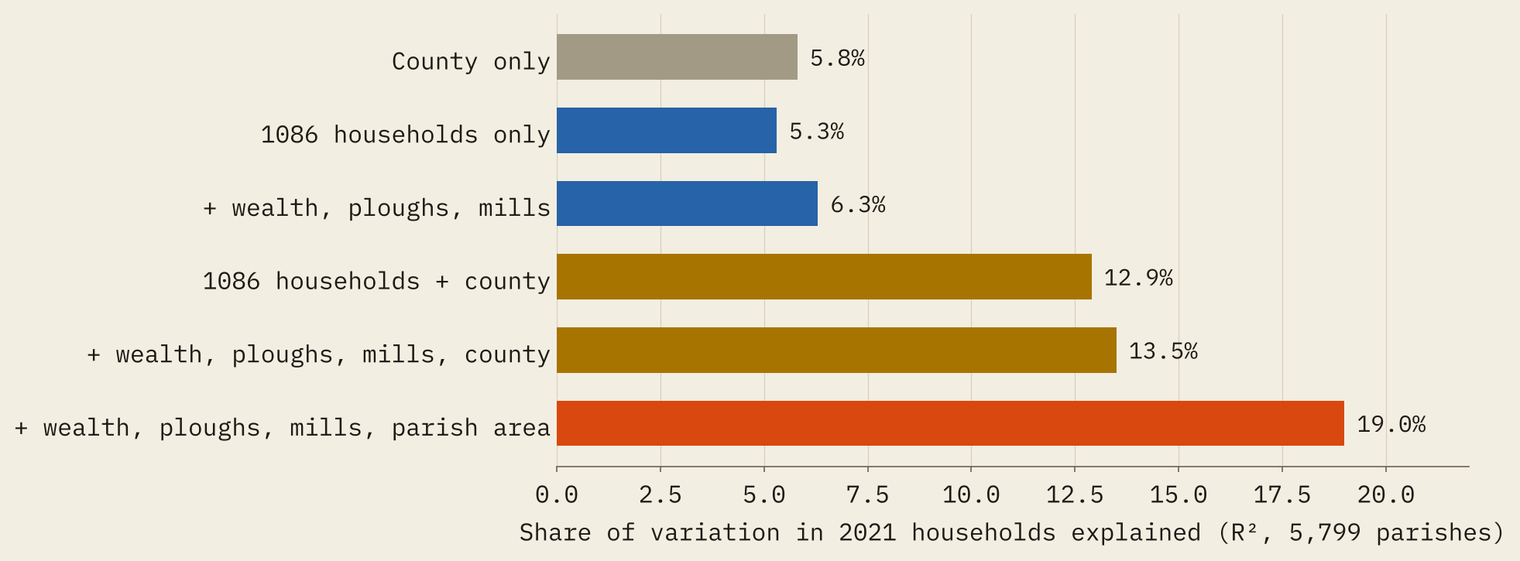
One modern fact beats them all: the area of today’s parish. Adding it lifts the explained share to 19.0%, and the weight on 1086 households falls from 0.38 to 0.13. Part of what looks like persistence is simply land. A large parish had room for many households then and has room for many now.
How I did this
The Domesday figures come from the Hull Domesday Project’s coding of the survey, through the realm-domesday repository, which links each place to the 2021 civil parish containing the centre of its 1 km grid square. Census 2021 households come from the ONS. When one entry describes several places I share its households equally among them, as the repository’s own then-and-now views do.
Domesday does not count people. It lists heads of households, so I compare households with households rather than guess at a multiplier. The survey is uneven: London and Winchester are not in it, the far north was largely not surveyed, and only 648 of Yorkshire’s 2,148 places have a household figure. The repository’s parish match agrees with Wikidata’s for 90% of places, so a place near a boundary can land in its neighbour. And the big unparished towns and cities, as the grey on the map shows, are left out.
Notes and sources
- Domesday data: Hull Domesday Project, Professor J.J.N. Palmer, George Slater and the University of Hull (data, CC BY-NC-SA).
- Joined data: the realm-domesday repository by embabel-worlds.
- Place records: Open Domesday by Anna Powell-Smith.
- Census 2021: Office for National Statistics, Open Government Licence v3.0. Contains OS data © Crown copyright and database right 2022.
- Paper, data and code: Zenodo and GitHub. Derived data and text CC BY-NC-SA 4.0; code MIT.
- I wrote the text, with drafting and editing assistance from Claude (Anthropic), which also helped prepare the analysis code. I reviewed and checked all text and results.

