
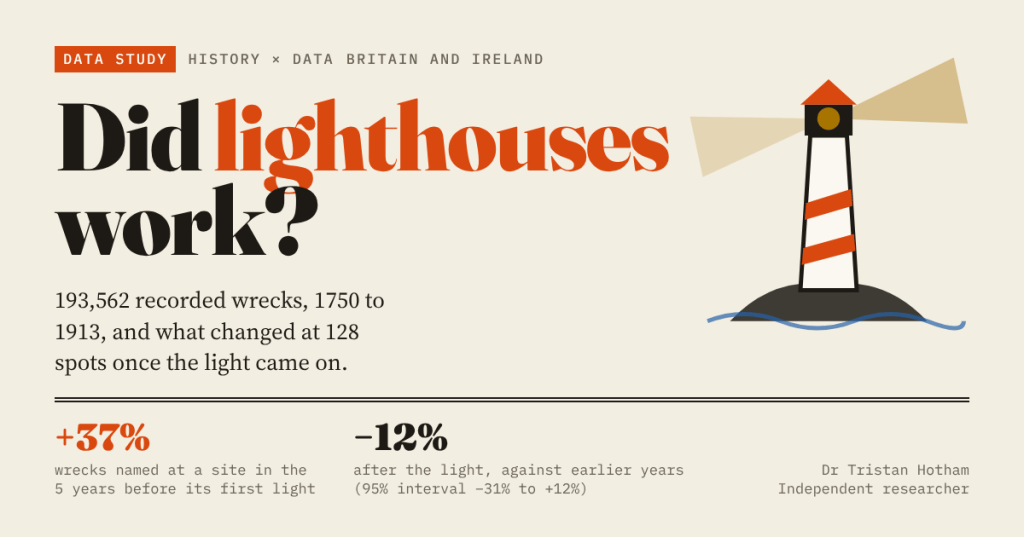
Between 1760 and 1900 the coasts of Britain and Ireland were ringed with new lights. I counted the wrecks recorded at each spot before and after its light was first lit. The wrecks came first.
Lighthouses were one of the great public works of the eighteenth and nineteenth centuries. New lights went up on rocks, headlands and sandbanks all round Britain and Ireland, some of them on reefs that took years to build on. The obvious question is whether they worked. Once a light was lit, did the wrecks at that spot stop?
I cannot count the wrecks that never happened. But Wikipedia’s volunteers have built something close to a register of the ones that did: month-by-month lists of shipwrecks, compiled largely from Lloyd’s List and the newspapers of the day. Most entries say where the ship was lost: “wrecked on the Gunfleet Sand”, “driven ashore at Flamborough Head”. So I parsed 193,562 entries for 1750 to 1913 and, for each lighthouse, counted how often the record names its rock, headland or sandbank, year by year.
The answer is less tidy than I expected. Wrecks named at a site rose by about 37% in the five years before it got its light. After the light, mentions were about 12% lower than in the earlier, quieter years, but that could easily be no change at all.
Lighting the coast
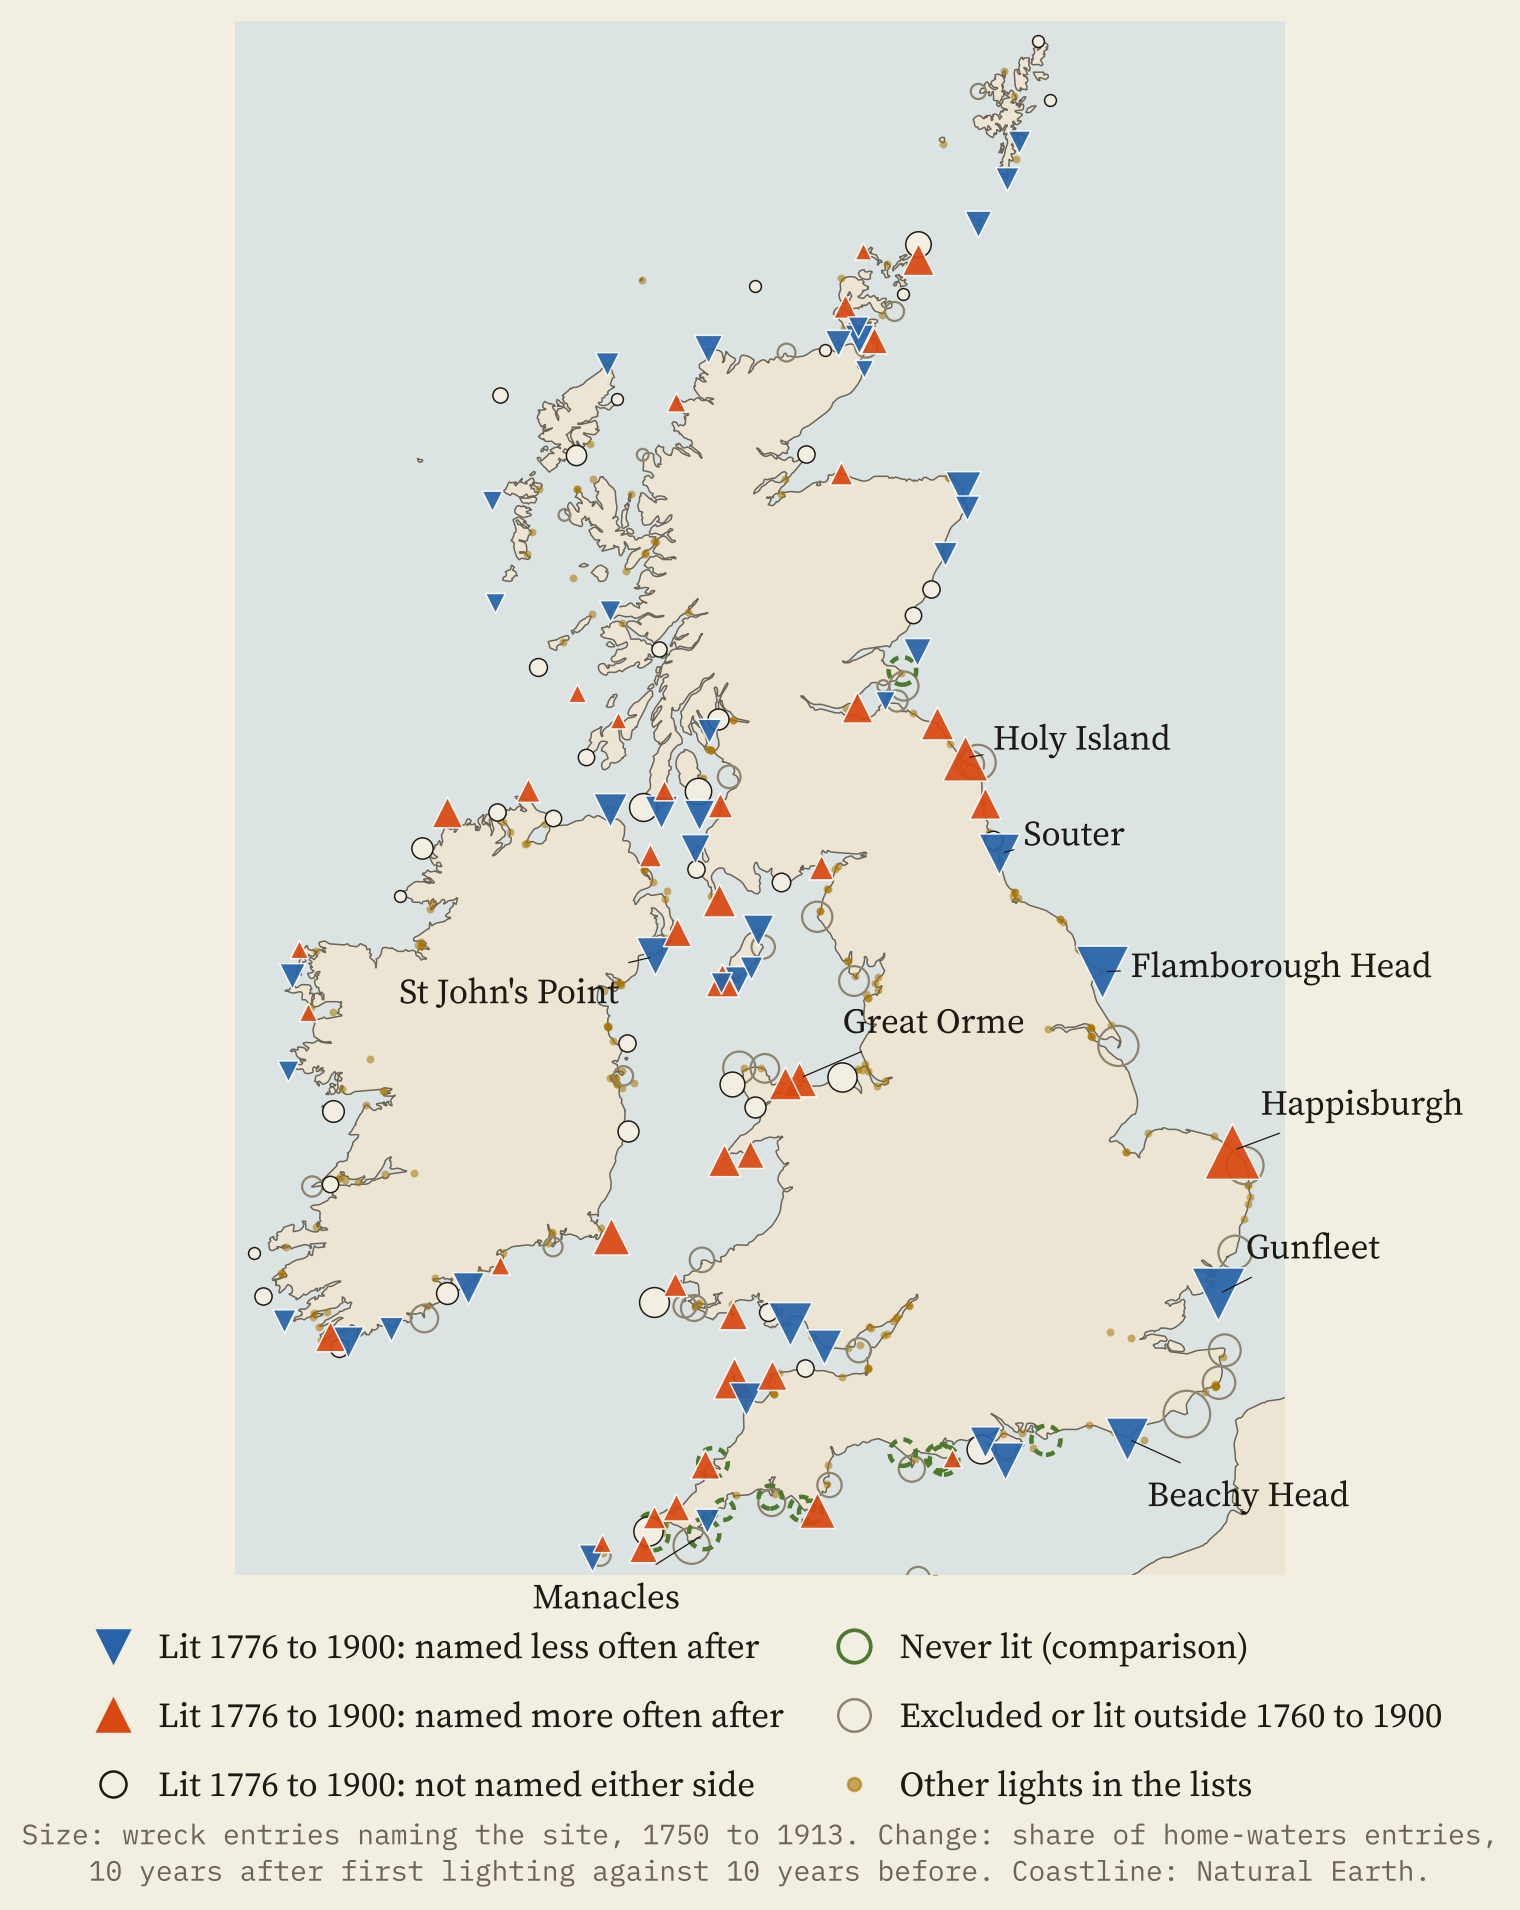
I used 128 lights first lit between 1776 and 1900 as test cases. For comparison I used 13 named hazards that never got a light in these years, such as the Manacles and the Runnelstone off Cornwall, and lights that had not been lit yet.
The first surprise is on the map. Blue and orange are almost evenly matched. Of the 87 test sites named at all in the twenty years around their first lighting, 44 were named less often after the light and 43 more often.
A list that grows and shrinks
Before going further, a warning about the record itself. It is not a steady instrument. In the 1760s the lists hold about 200 entries a year. In the 1850s there are 2,409, and 1880 has 3,844. Then the monthly pages stop. From 1891 there is one page per year, and the count falls from 2,785 entries in 1890 to 102 in 1891.
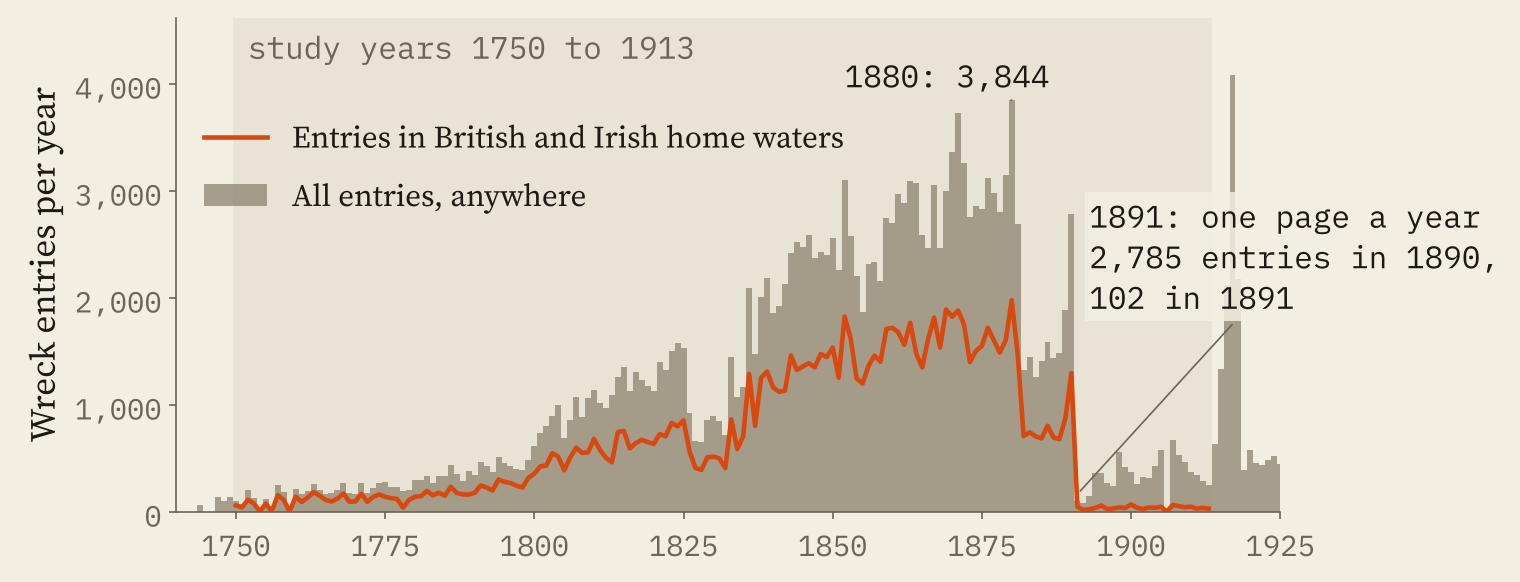
A place can look safer simply because fewer wrecks were written down. So I never compare raw counts across years. In the models every calendar year gets its own baseline, shared by lit sites and comparison sites, which soaks up changes in how much the record holds.
The simple count
Add up all 128 test sites. In the ten years before first lighting they were named in 551 wreck entries. In the ten years after, 450. Allowing for the size of the record each year, the rate after lighting was 0.76 times the rate before. The never-lit places, given the same dates, came out at 1.03. Over twenty years either side, though, the lit sites’ ratio was 0.96, and most of that gap closes.
Single sites tell both stories. The Gunfleet, a sandbank off the Essex coast, got its lighthouse in 1850: 171 wreck entries in the ten years before, 55 in the ten after. Souter, on the Durham coast by Whitburn, went from 59 to 32 either side of 1871. But at Happisburgh the light of 1791 was followed by more mentions of the Haisborough Sands, not fewer: 6 before, 19 after.
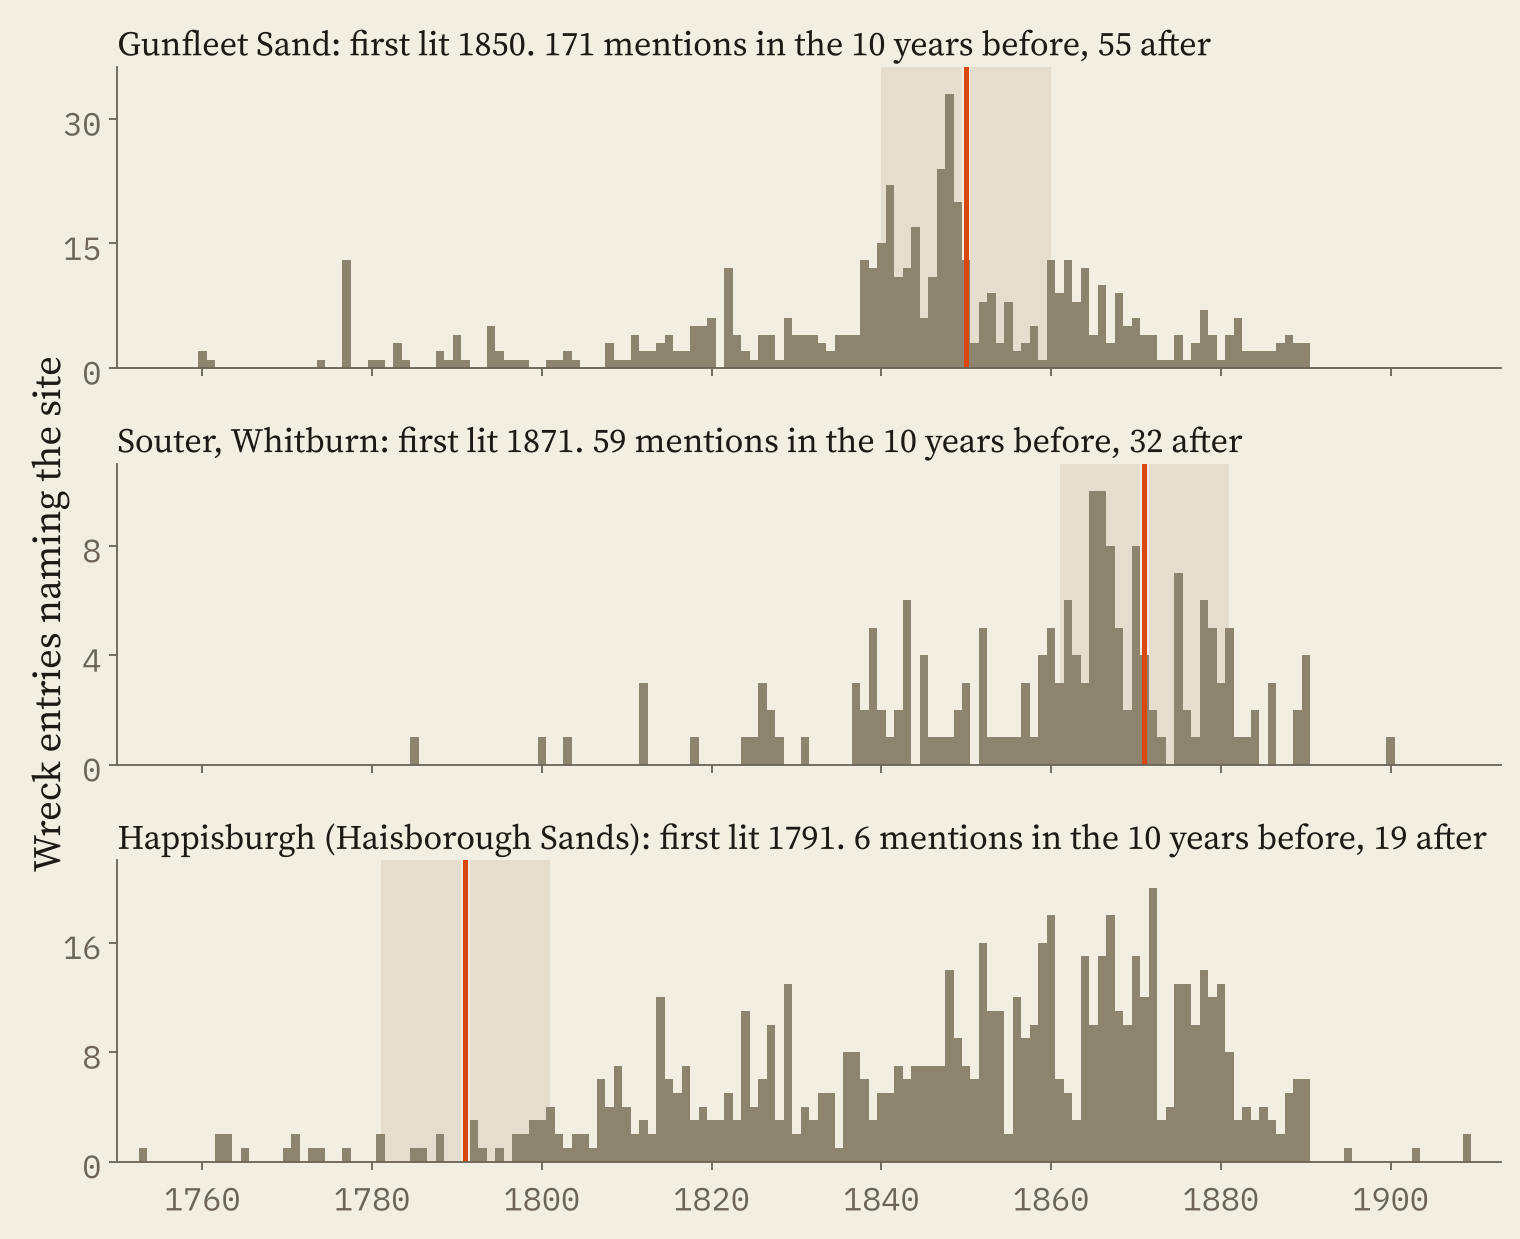
Look closely at the Gunfleet and Souter. The wrecks pile up in the years just before the light. That turns out to be the whole story.
The wrecks came first
Adding up before and after hides the shape. So I followed the test sites in five-year steps, each against the comparison places over the same calendar years, with every value relative to the five years just before the light.
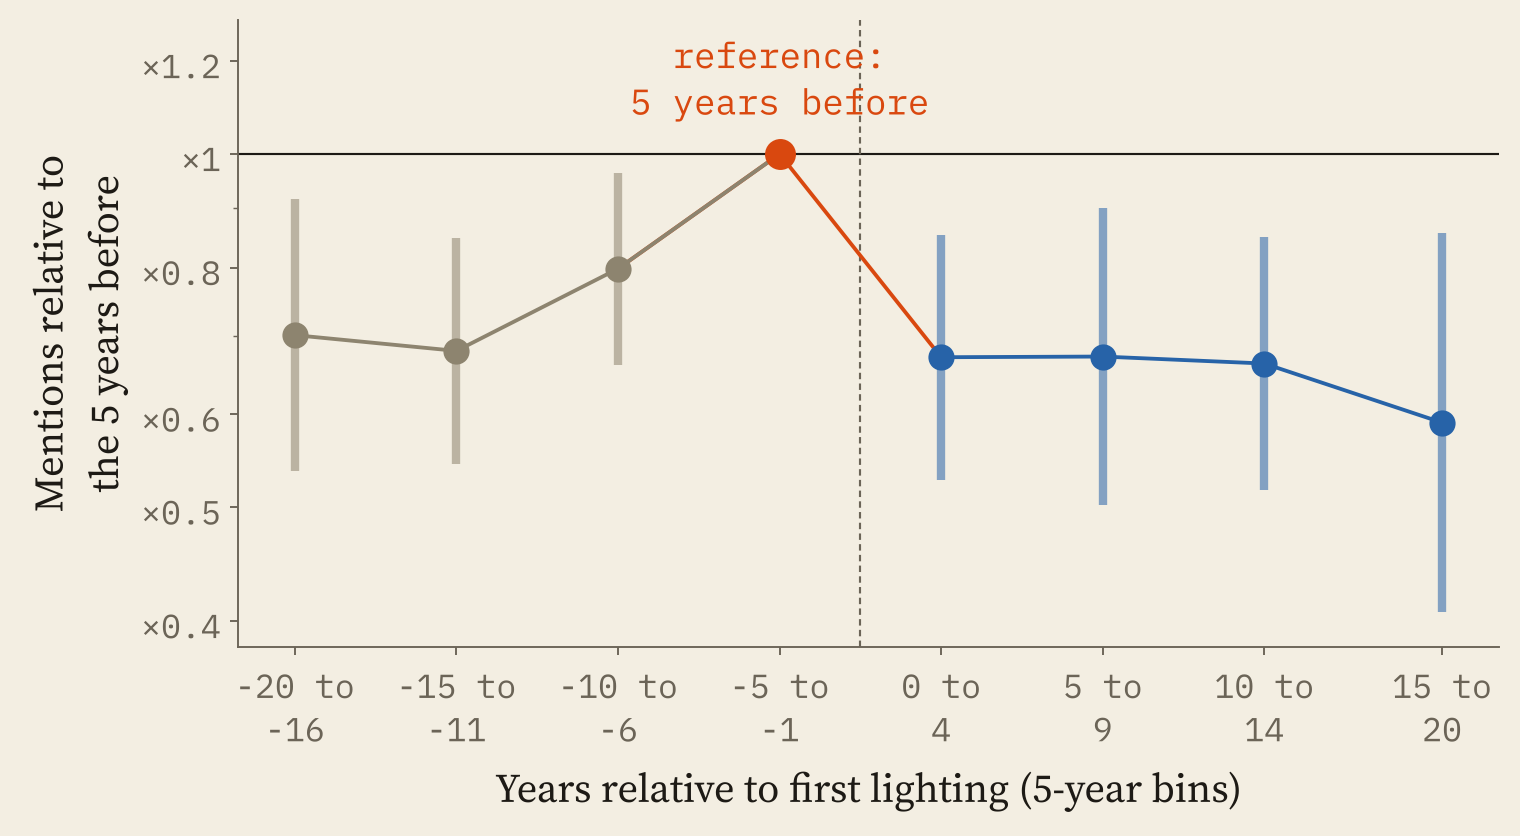
The striking thing is on the left. In the five years before a light was lit, its site was named 37% more often than in the fifteen years before that (95% interval 14% to 64%). It fits a simple story: a bad run of wrecks made the case for a light, and a few years later the light was lit.
After lighting, the line falls back. But it falls to about where it was before the run-up, not far below it. Measured against the years 6 to 20 before lighting, mentions after lighting were 12% lower, with a 95% interval from 31% lower to 12% higher.
The wrecks came first, then the light. After the light, wrecks at the spot went back to normal, and perhaps a little below it.
This is why a plain before-and-after comparison misleads. Compare the twenty years after with the twenty years before, run-up included, and you get a fall of 21%. Much of that is the run-up fading, which would probably have happened with no light at all. Statisticians call it regression to the mean: pick a place because it just had a terrible spell, and next time it will usually look better, whatever you do.
Could it be chance?
I tried the estimate many ways. Using only never-lit places as the comparison gives a 3% fall; only lights not yet lit, 10%; dropping the sites whose first-lit dates I corrected by hand, 12%. Leaving out any one test site keeps the ratio between 0.86 and 0.98.
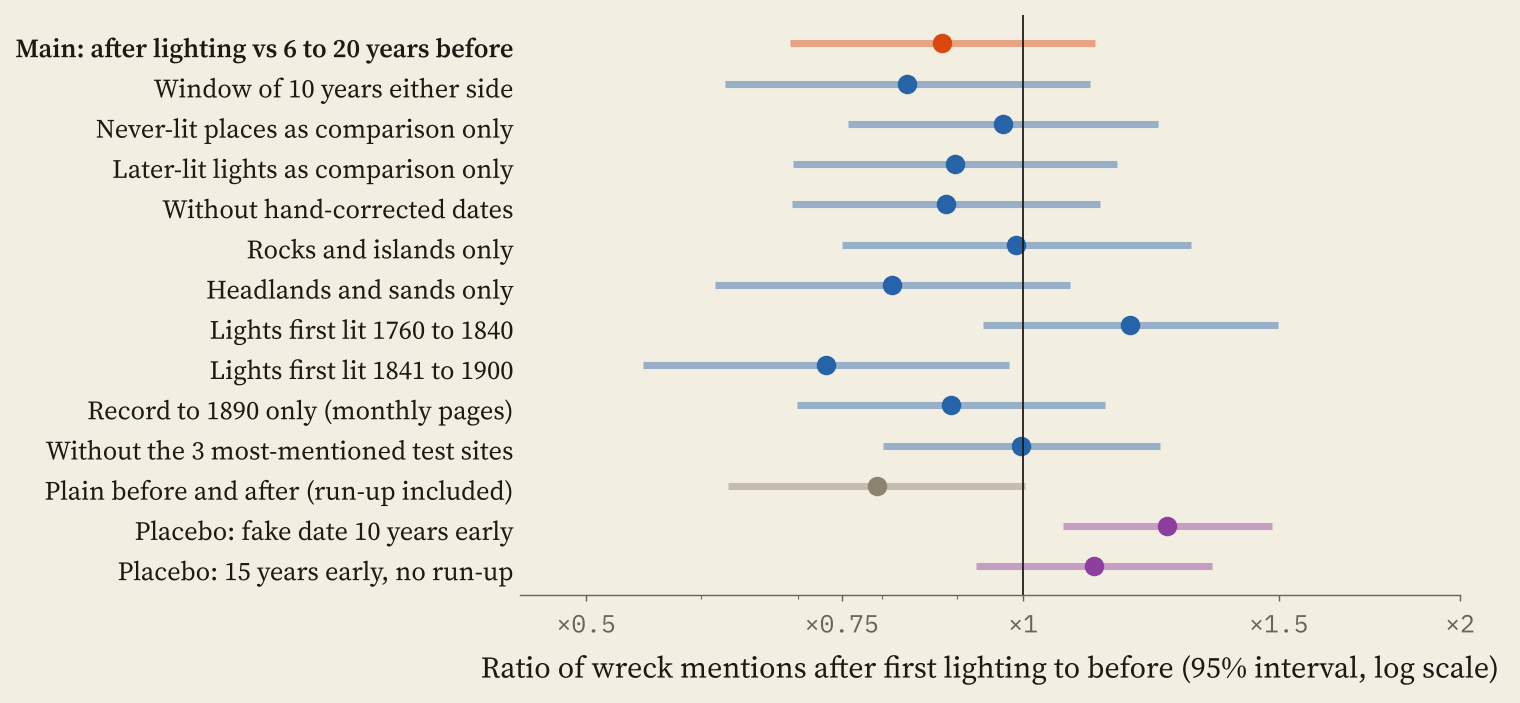
Two splits differ more. Lights first lit from 1841 to 1900 show a 27% fall, against a 19% rise for those lit from 1760 to 1840. I would not lean on that. The later lights were lit when the record was fullest, and I tried several splits, so one of them looking stronger is no surprise.
Then the placebos. If I pretend each light was lit ten years early, the method finds a “rise” of 26%, because the fake after-period contains the real run-up. Last, I dealt the real lighting years out at random among the test sites 200 times. 38% of the shuffled estimates were as low as the real one or lower. A real effect this size would be hard to tell from luck in data this sparse.
What this cannot show
Lights changed where ships went. A light lets ships pass closer, sail at night, or use a route they avoided before. More traffic past a lit headland could mean as many wrecks near it even if each passage was safer. These lists count wrecks, not voyages.
Dates are the other weak spot. The lighthouse lists often give the year of the current tower, not the first light at the site. I corrected 5 well-known cases by hand and kept 23 sites out of the estimates because an older light stood there before the record begins or before the date in my sources.
So this is not a verdict that lights did nothing. A light can save ships that would have been lost somewhere else along the coast, or make voyages faster and trade heavier. Wreck lists by place cannot see those gains. What they do show is that lights followed losses, and that a before-and-after story will flatter almost any fix made just after a disaster.
How I did this
I parsed every entry in English Wikipedia’s “List of shipwrecks” pages from 1700 to 1945 (236,326 entries), with the date, ship, flag and description, and used the years 1750 to 1913. The lighthouses come from the Wikipedia lists for England, Wales, Scotland, Ireland, the Isle of Man and the Channel Islands, combined with Wikidata. I wrote out by hand which hazard each light guards and the names a wreck report uses for it, and checked the British names against the Ordnance Survey’s gazetteer for same-named places elsewhere. A wreck counts for a site when its description names the site, after removing sentences about voyages and towing, other ships, and places mentioned only as a reference point more than 10 miles away.
For each test site I compared its years from 20 before to 20 after lighting with the comparison places over the same years, stacked these comparisons and fitted a Poisson model with site and year effects. The main estimate gives the five-year run-up its own term. Spot checks of 20 random wreck entries and 10 lighthouse rows found no errors.
Notes and sources
- Wreck records: Wikipedia contributors, Lists of shipwrecks (CC BY-SA 4.0), largely compiled from Lloyd’s List and contemporary newspapers.
- Lighthouses: Wikipedia contributors, lists of lighthouses such as List of lighthouses in England (CC BY-SA 4.0), and Wikidata (CC0).
- Name check: OS Open Names, Open Government Licence v3.0. Contains OS data © Crown copyright and database right 2026.
- Map coastline: Natural Earth (public domain).
- Paper, data and code: Zenodo and GitHub. Derived data and text CC BY-SA 4.0; code MIT.
- I wrote the text, with drafting and editing assistance from Claude (Anthropic), which also helped prepare the analysis code. I reviewed and checked all text and results.

