
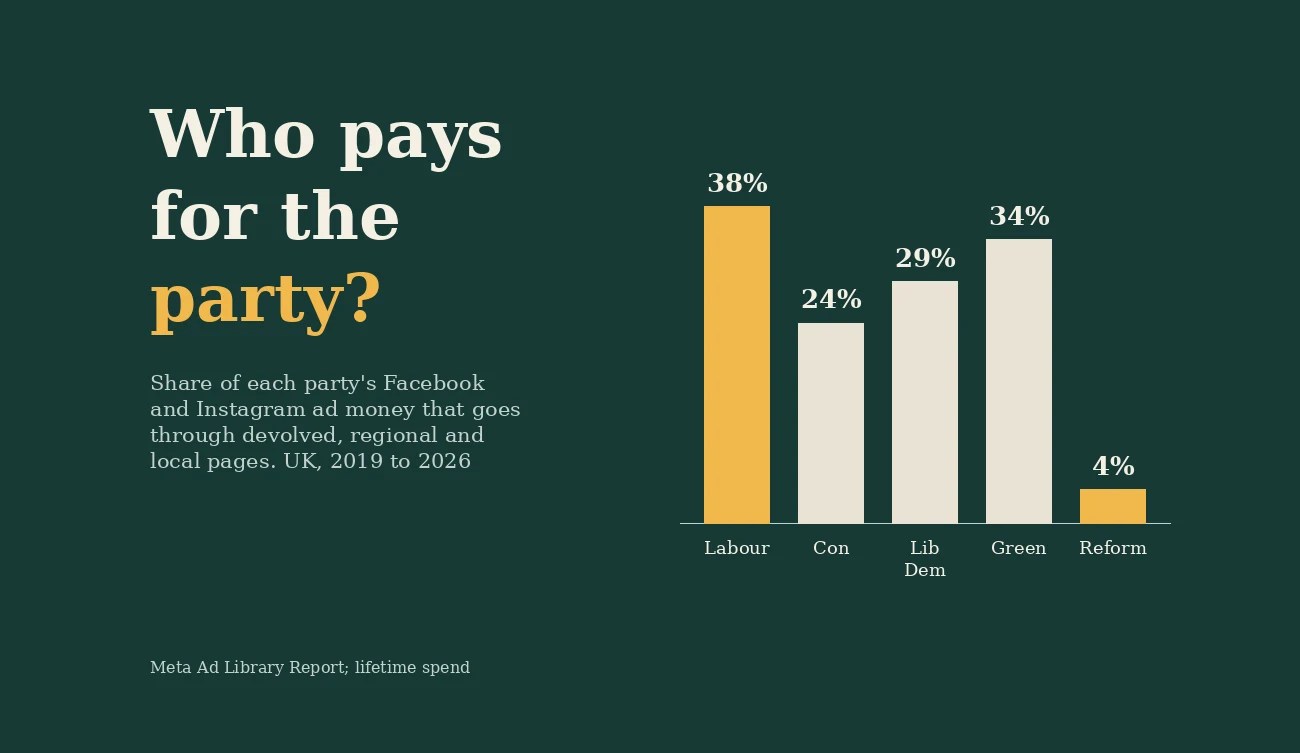
If you asked most people who pays for political ads on Facebook, they would say the parties. They would be wrong. When I opened Meta’s public record of every political and issue ad in Britain since October 2019, the ten biggest spenders were not parties at all. Most were charities and government bodies. The Labour Party’s page came eleventh.
The parties are there, though, and the way they spend is more revealing than how much. One party runs its advertising through over a thousand pages. Another puts more than half of it through a single page. A third relies on its leader. So I went through all of it, page by page, to see who pays for the party.
The preprint
Who Pays for the Party? The Structure of British Party Advertising on Meta, 2019 to 2026
Open access, free to read, share and cite. It uses Meta’s Ad Library Report for the UK: 90,565 advertisers, about £252 million and 1.5 million ads.
Cite as: Hotham, T. (2026). Who Pays for the Party? The Structure of British Party Advertising on Meta, 2019 to 2026. Preprint, Zenodo. https://doi.org/10.5281/zenodo.23415022
Where I got the data
Meta publishes a report of every advertiser that has run ads about social issues, elections or politics in the UK. It gives the amount spent and the number of ads, page by page. It has no dates, no targeting and no ad content, so it cannot tell you who saw what. But it covers everyone, for seven years, from 12 October 2019 to 11 October 2026.
I sorted the 3,531 pages that clearly belong to a party into five tiers: the national page, the leaders’ pages, the devolved nations (Scottish, Welsh and so on), the English regions, and the local and candidate pages. A random check of 60 of them found 58 correct and one that needed excluding. The list is published with the paper.
Parties are a small part of the money and a big part of the ads
All the party pages together spent £20.9 million. That is 8% of the total, but they ran 19% of all the ads. The typical party ad is cheap. Across the whole library an ad costs about £167. For party pages it is about £72.
The money is in charity and government campaigns: WWF, Greenpeace, the UK Government, UNICEF, Oxfam, Shelter and the Red Cross are all above any party.
Two ways to run a party
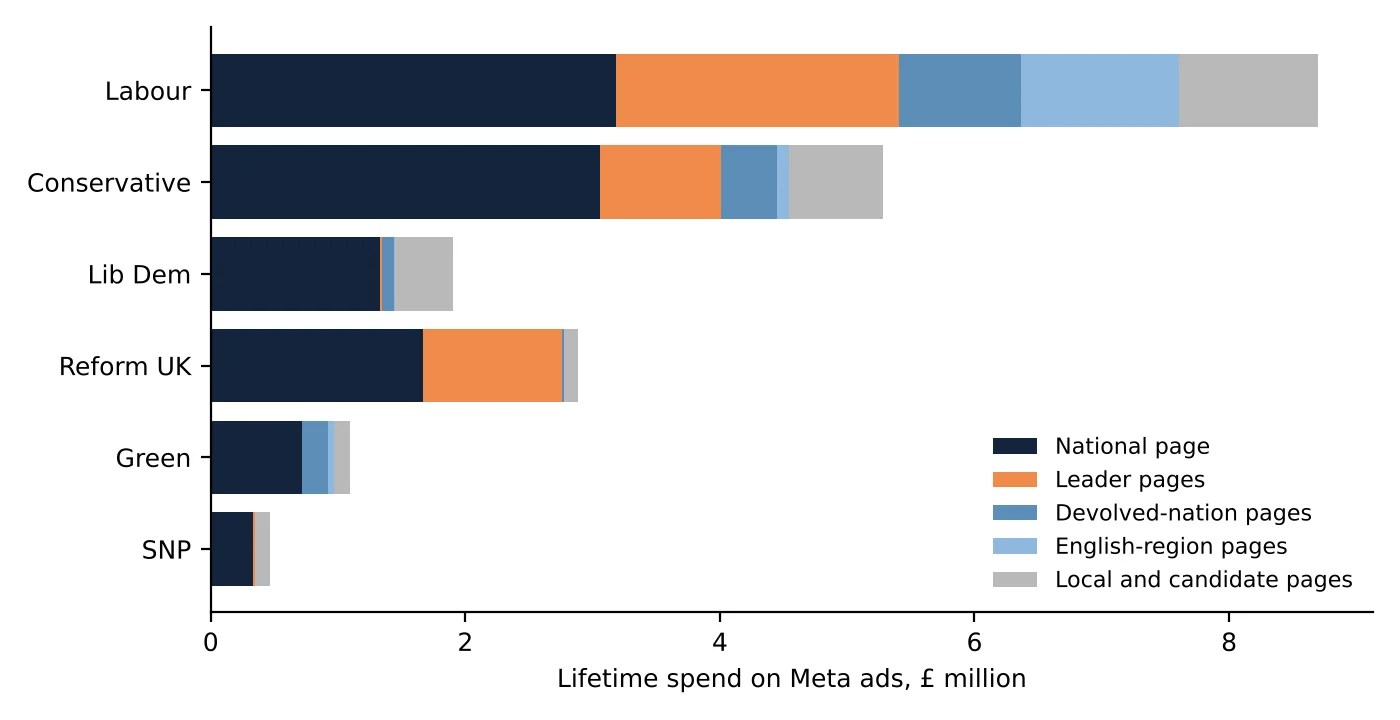
Labour and the Conservatives spent about the same through their main pages: £3.2 million and £3.1 million. After that they part company. Labour added £3.3 million through its devolved, regional and local pages, and £2.2 million through its leaders’ pages. The Conservatives added £1.3 million below the centre.
The gap is biggest in the English regions. Labour’s ten regional pages (London, the North West, the West Midlands and so on) spent £1.2 million. The Conservatives’ three spent £0.1 million.
Labour is the least concentrated of the big parties. The Liberal Democrats and the Greens are at the other end: about two-thirds of their money goes through the national page.
Leaders, and one party with no local tier
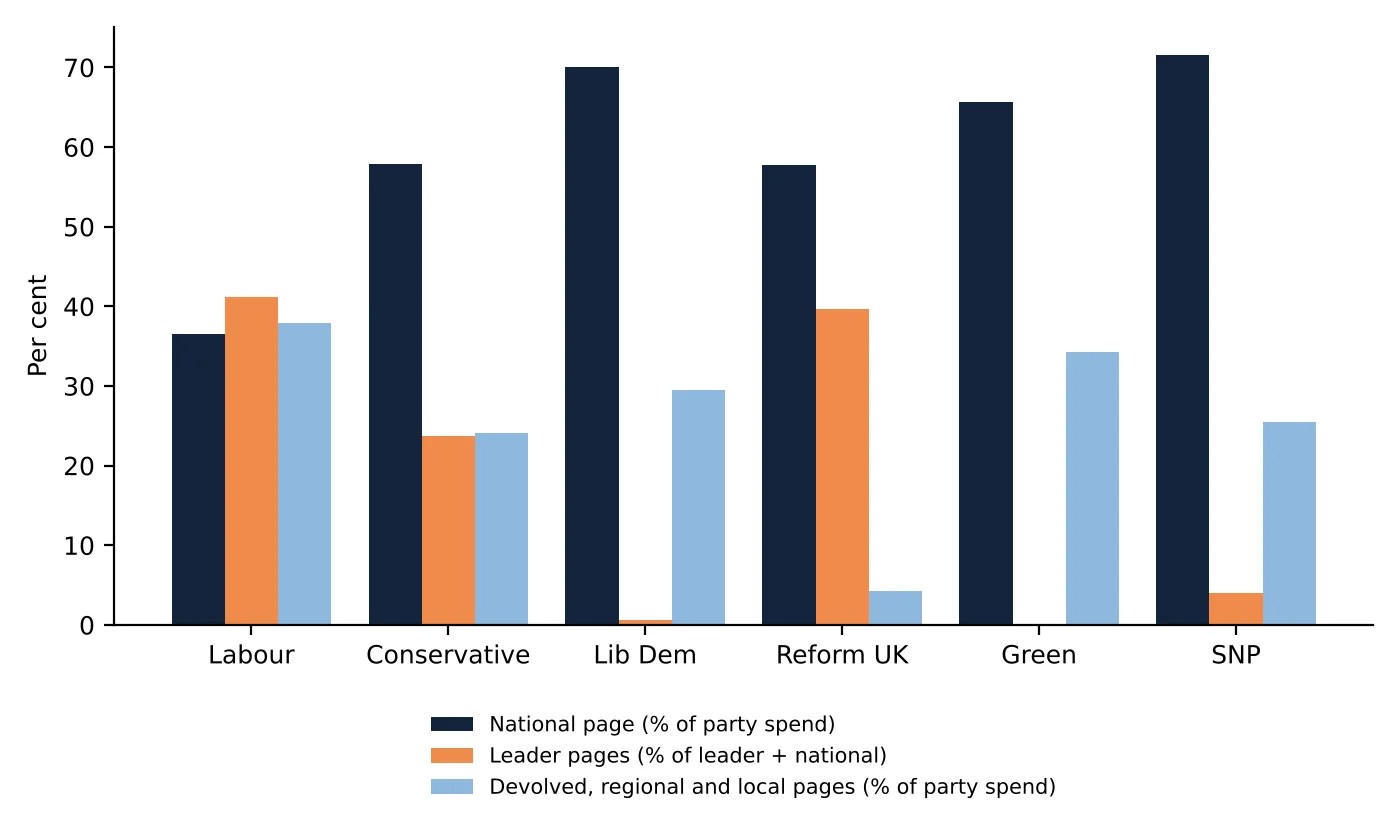
Keir Starmer’s own page has spent £1.3 million. Nigel Farage’s has spent £1.1 million. Of the money that Labour spends through its leader and national pages, 41% goes through leaders. For Reform UK it is 40%. For the Conservatives 24%. For the Liberal Democrats it is under 1%.
Reform UK is the most top-heavy party. Between the national page and its leader’s page it spends almost everything. Its 256 local pages account for 4% of its money.
Where the money was shown
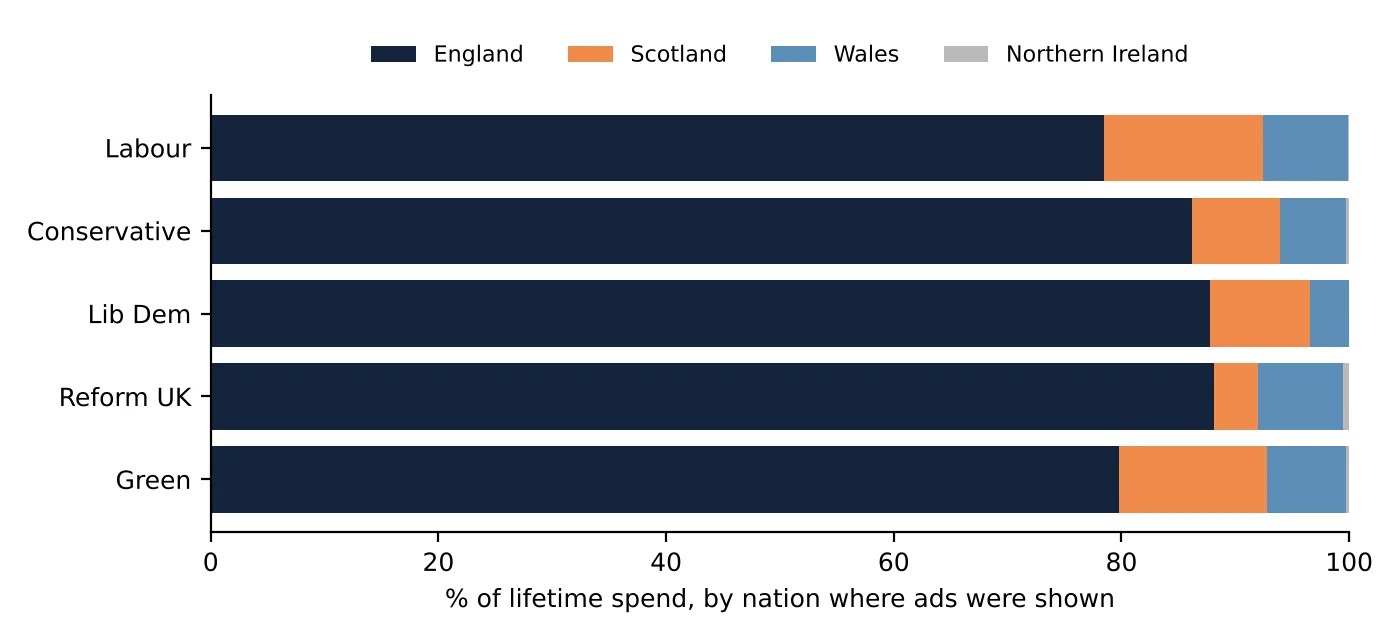
Across all political ads, 82% of the money was shown in England, 10% in Scotland, 6% in Wales and 2% in Northern Ireland. Scotland has about 8% of the population, so it gets more than its share.
Labour spent 14% of its money in Scotland. The Conservatives spent under 8%. Reform UK spent 88% in England and 7.5% in Wales.
The caveats
The report gives lifetime totals, so I cannot tell you what any one election looked like, and it says nothing about who saw the ads or what they said. Meta hides the smallest advertisers (anyone spending £100 or less), so the true totals are a little higher. And I sorted pages by their names, which will miss candidates whose page names do not mention a party. I think those misses fall evenly across parties, but I cannot prove it.
I also do not know why Labour is more spread out. It may be that Labour has devolved sections and many local parties who can run their own pages. That is my guess, and the data cannot test it.
The next step is dated data, which would show whether the pattern holds at particular elections. A companion paper, on whether parties pay for the pages that already draw an audience, is out at the same time.
I wrote the text, with drafting and editing assistance from Claude.
The views in this post and the paper are my own.

