
In 2015 the number of people seeking asylum in Europe rose to levels not seen for decades. Arrivals built from about June, and by September the story was on every front page. Radical right parties, for whom immigration is the central issue, were widely expected to gain.
I wanted to know whether that showed up on Facebook first. Social media are sometimes treated as an early warning: if voters are shifting, perhaps you can see it in what they like, comment on and share before it reaches the polls. So did engagement with radical right parties’ pages rise ahead of the crisis, or ahead of their poll ratings? Mostly, no. Engagement did rise, but with the crisis, not before it.
The paper
Ahead of the Crisis? Radical Right Parties on Facebook and the 2015 Refugee Crisis in Europe
Read the paper (open access)
What I looked at
The data are monthly totals from public Facebook posts by official party and party leader pages in 20 European countries, from July 2014 to June 2016, collected through CrowdTangle, Meta’s tool for tracking public pages, which closed in 2024. I kept the 140 pages that posted steadily through the period: 3,318 page-months in all.
To decide which parties count as radical right, I used the PopuList, an expert classification of European parties. That gave 15 radical right pages in 9 countries: Belgium, Denmark, France, Hungary, Slovenia, Spain, Sweden, Switzerland and the UK. The PopuList’s group is broad. It includes Hungary’s governing party Fidesz and its leader Viktor Orbán, and New Slovenia (NSi), which other classifications place outside the radical right. So I also report a smaller core set without those three pages.
Each radical right page is compared with itself at the start of 2015 and with the 68 other party and leader pages in its own country in the same month. That way, anything that lifted all pages in a country, such as an election or simply more people on Facebook, cancels out. An interaction is any like or other reaction, comment or share.
Engagement per post rose, clearest from September 2015
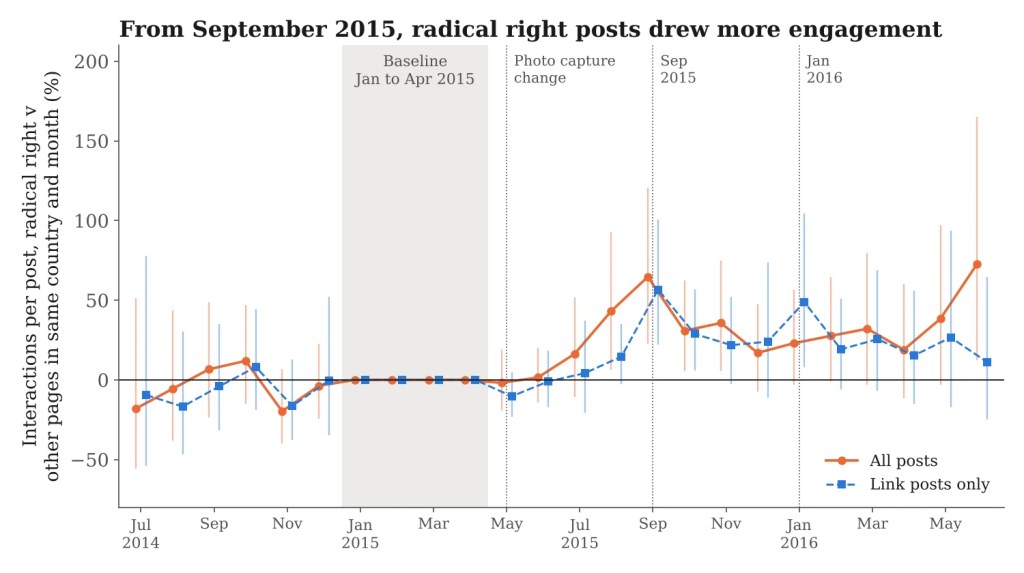
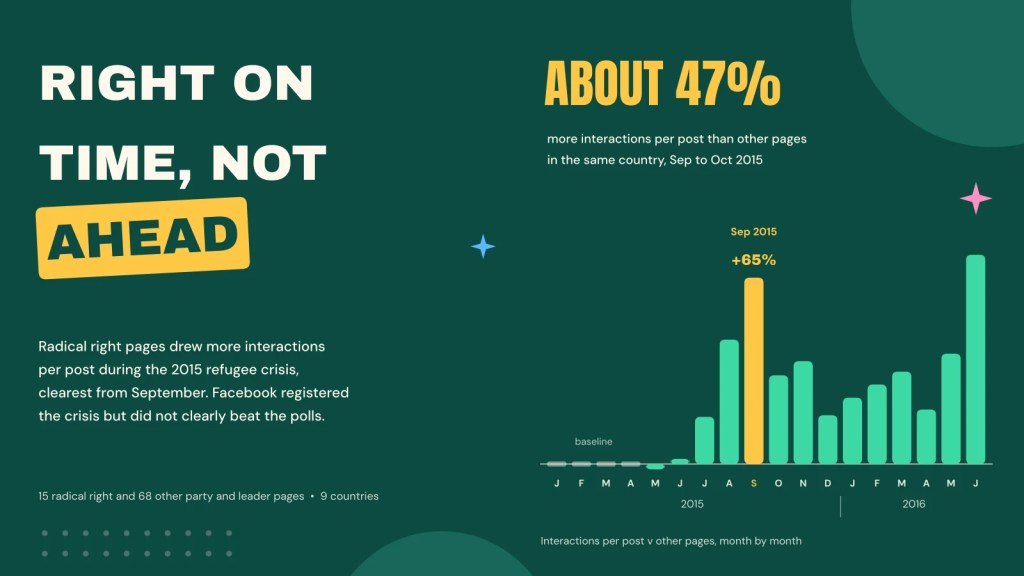
Compared with January to April 2015, radical right pages drew about 47% more interactions per post than other pages in their country in September and October 2015. Month by month, the gap was largest in September itself, at about 65%. It stayed higher afterwards, at about 26% to 42% through to June 2016, and did not grow again after the New Year’s Eve assaults in Cologne.
There was no sign of this before the crisis. In the second half of 2014 the gap was in effect zero (-5%), and so it was in May and June 2015.
What about the summer, as arrivals were building? In July and August radical right pages drew about 29% more per post. But I would not treat that as firm, and the reason is a quirk of the data.
A change in the data, and what survives it
In May 2015 CrowdTangle suddenly started capturing far more photo posts from these pages: from 826 in April to 3,181 in May, while link posts stayed flat. That change lands just before the crisis, so it could make the summer look different for reasons that have nothing to do with refugees.
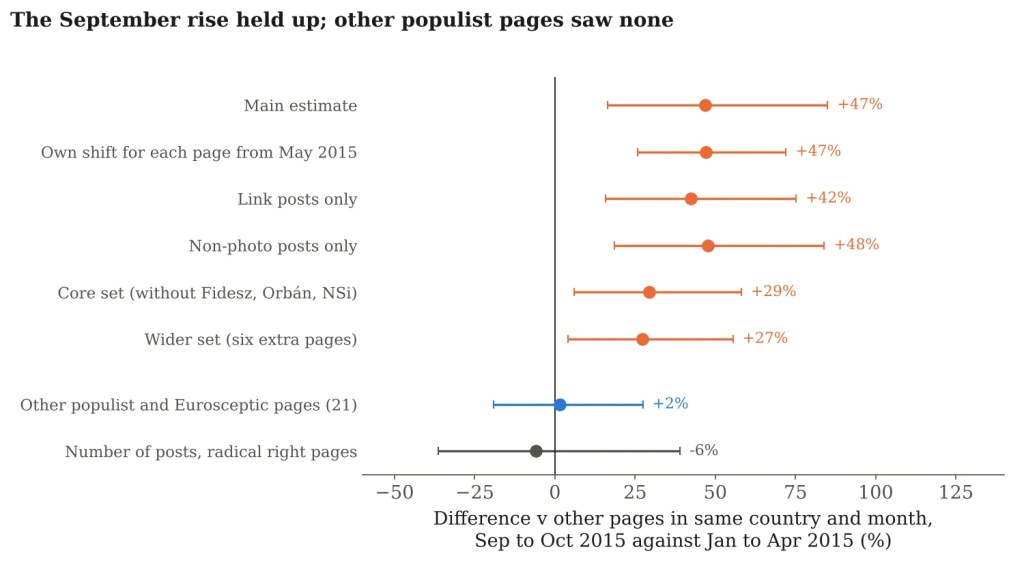
I checked this in several ways: giving every page its own shift from May 2015, dropping photo posts, and using link posts alone, whose capture did not change. The September and October rise survives all of them. In link posts it was about 42%. The July and August rise does not: in link posts it was close to zero (0.09 log points, not statistically significant). On the evidence that holds up, the rise came at the height of the crisis in September, not before it.
Facebook registered the crisis. It did not clearly run ahead of it.
More per post, not more posts
The rise came from engagement per post. Radical right pages did not post more than other pages during the crisis (-6% in September and October, in effect zero). Total interactions moved in the same direction but were already drifting upwards on radical right pages before 2015, so the per-post measure is the more reliable one.
It was also specific to the radical right. The 21 other populist and Eurosceptic pages in the data, from left and right, saw no similar rise: about +2% in September and October. And it was common but uneven: 12 of the 15 radical right pages rose. The biggest gain was on Viktor Orbán’s page, whose government was at the centre of events in Hungary.
That matters for the classification question. Without Fidesz, Orbán and NSi, the estimates are smaller: 0.18 log points in July and August (about 20%, not statistically significant) and 0.26 in September and October (about 29%). The core result holds, but it is weaker.
Facebook did not clearly lead the polls
The second question was about timing. For six countries I could match a party’s share of all Facebook interactions on party pages in its country with its poll ratings, using 873 polls from published tables. For each series I noted the month it first got halfway from its spring 2015 level to its peak.
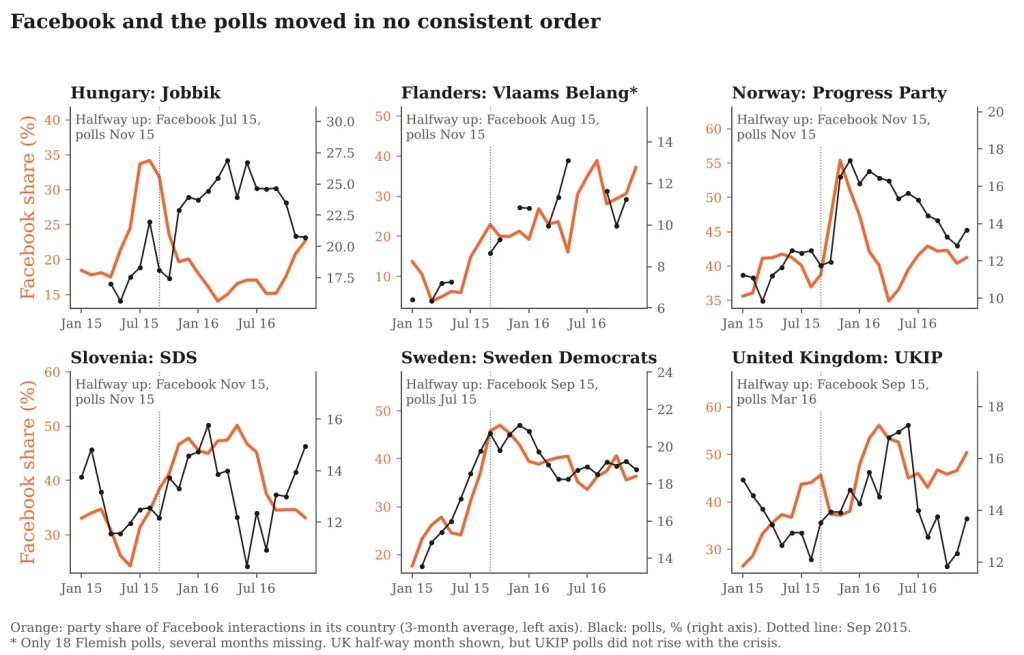
There is no consistent order. Facebook moved earlier in Hungary (Jobbik’s share got halfway up in July 2015, its polls in November) and in Flanders (August against November). In Norway and Slovenia the two moved together, around November 2015. In Sweden the polls moved first: the Sweden Democrats were already rising in the spring, getting halfway in July, while their Facebook share got there in September. In the UK, UKIP’s polls did not rise with the crisis at all.
These timings are fragile. The halfway month depends on the baseline, the peak and the smoothing, so a month or two means little. Flanders rests on just 18 polls with several months missing. When I pooled the countries, the two series mostly moved together in the same month, perhaps because both were responding to the same news. The honest summary is that Facebook registered the crisis but did not clearly run ahead of the polls.
The caveats
The radical right group is small, fifteen pages, and varied. It includes a governing party and its leader, and the results are weaker without the pages whose classification is most disputed. Several well-known parties are missing because their pages did not post steadily enough, or because the data lacked them.
The checks for the change in photo capture cannot rule out a change that hit radical right pages differently, which is why I do not lean on the summer estimates. Interactions are not reach, and they can come from anyone, anywhere. Elections, the Paris attacks in November 2015 and the run-up to the UK’s EU referendum all overlap with the period. The polls are transcribed from published tables and cover only six countries. None of this says what caused what, or anything about voters’ views on migration: these are patterns in engagement with party pages.
The paper is a preprint and has not been peer reviewed. I wrote the text, with drafting and editing assistance from Claude. The views in this post and the paper are my own.

