
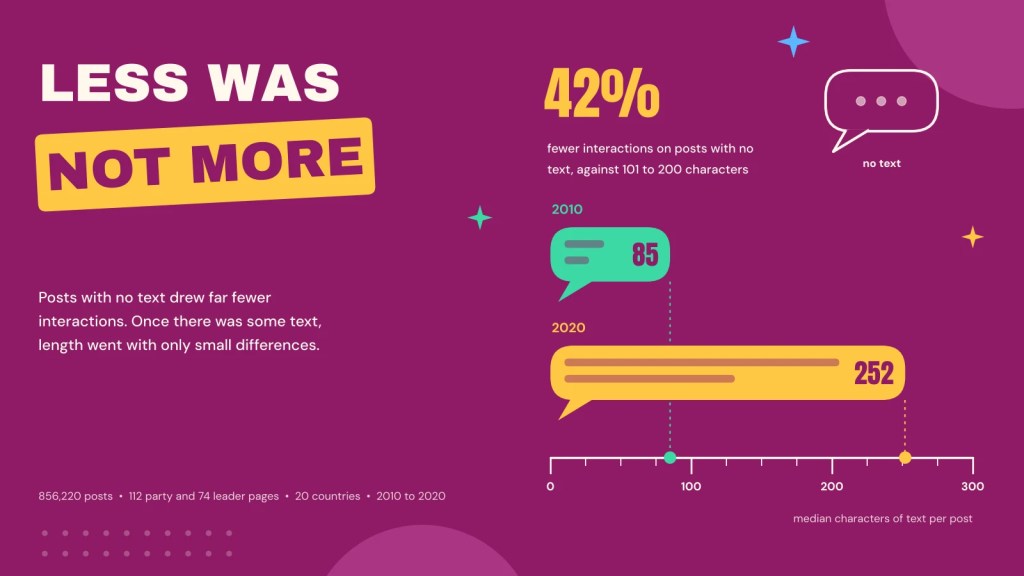
There is a piece of social media folk wisdom that short posts do best. People scroll fast, and Facebook folds long text away behind a link to read more. So I expected party posts with less text to draw more likes, comments and shares.
That is not quite what I found. Across a decade of posts by Europe’s parties and party leaders, the posts that stood out were the ones with no text at all, and they drew less, not more. Once a post had some text, how long it was went with only small differences, and the longest posts did a little better, mainly in shares.
The paper
Less Is More? Post Length and Engagement on the Facebook Pages of European Parties and Leaders, 2010 to 2020
Read the paper (open access)
What I looked at
The data are 856,220 public Facebook posts from 112 party pages and 74 party leaders’ pages in 20 European countries, January 2010 to September 2020. I collected them for my PhD through CrowdTangle, Meta’s tool for tracking public pages, which closed in 2024.
Length here is simply the number of characters (letters, spaces, emoji) in the text a page wrote above its link, photo or video. It does not include the headline of a linked article. About 12% of posts had no text at all. I never read or quote the posts: only their length is used. An interaction is any reaction, comment or share.
Posts got much longer
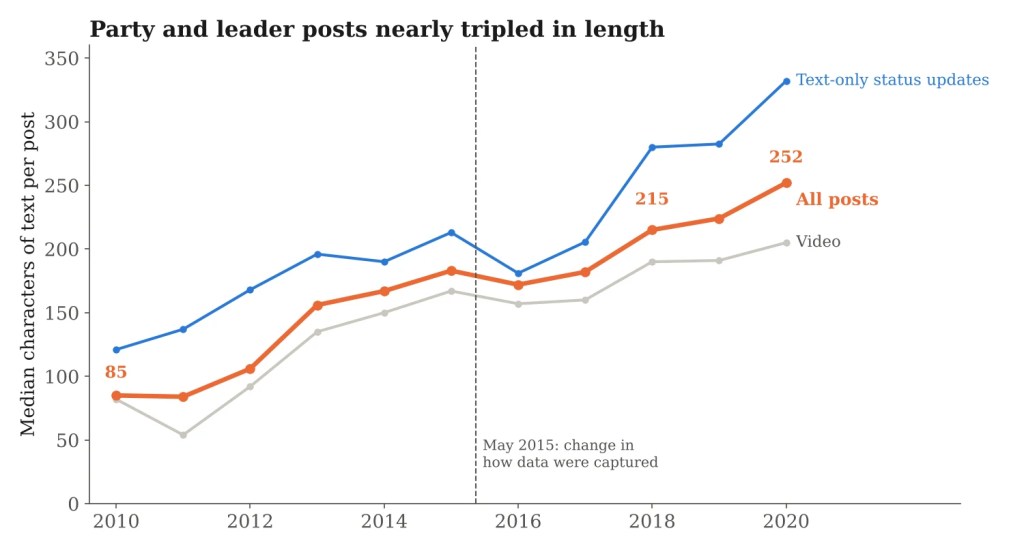
In 2010 the median post had 85 characters of text, about one short sentence. By 2014 it was 167, by 2018 215 and by 2020 252. Posts of more than 800 characters went from under 1% of posts in 2010 to 12% in 2020.
This was not just new, wordier pages joining. Among 120 pages that posted regularly in both 2012 and 2019, the median also rose, from 85 to 251 characters. Text-only status updates were the longest kind of post (median 264 characters from mid-2015) and videos among the shortest (182).
Posts with no text drew far less
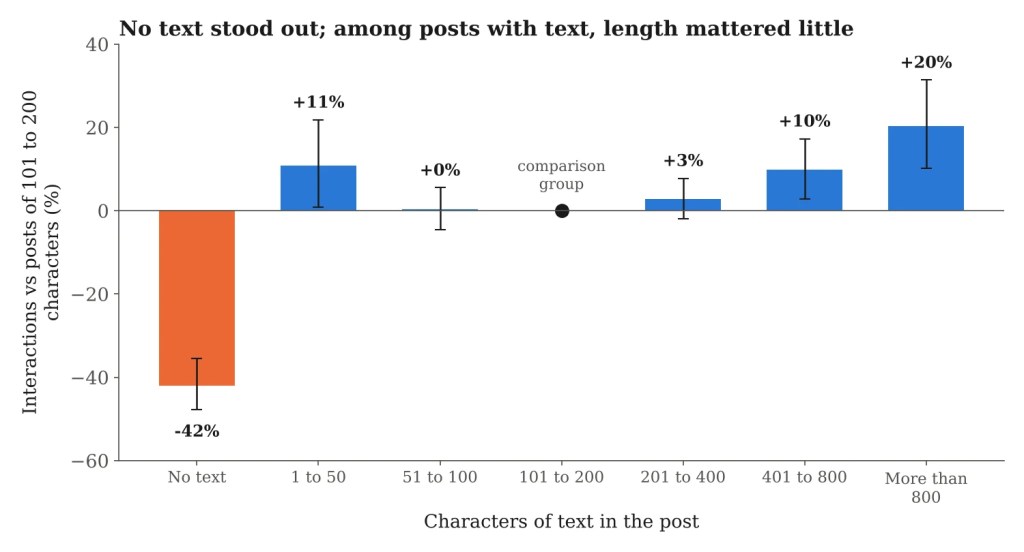
To compare like with like, I compared each post with other posts by the same page, of the same type (link, photo, video and so on), while also allowing for whatever lifted or dampened engagement in that country that month. I used posts from June 2015 onwards, because a change in how CrowdTangle captured photos in May 2015 makes earlier years hard to compare.
On that basis, posts with no text drew about 42% fewer interactions than posts of 101 to 200 characters. That held for every type of post: about 46% fewer for links, 37% for photos and 44% for videos. Comparing a post only with the same page’s other posts that month, the gap was about 37%.
Posts with no text are not a random group. Judging from their web addresses, about 46% of them passed on a photo, video or post from another Facebook page, against 7% of posts with text. That could explain the gap. But when I left out every post that passed on another page’s content, posts with no text still drew about 44% fewer interactions.
Whether a post had any text went with a bigger difference than how long the text was.
Among posts with text, length mattered little
Once a post had text, the pattern was mostly flat, with a slight rise at each end. Very short posts of 1 to 50 characters drew about 11% more interactions than the comparison group. Posts of 51 to 400 characters drew about the same. Posts of 401 to 800 characters drew about 10% more, and those of more than 800 about 20% more.
Put another way, a post with text that was twice as long went with only about 2% more interactions. Given that the median post nearly tripled in length over the decade, that is a small difference.
The exception was text-only status updates, where the words are the whole post. Status updates of 401 to 800 characters drew about 46% more interactions than those of 101 to 200, and those of more than 800 about 57% more. For links, photos and videos, where the text is a caption, length went with little difference.
Longer text went with more sharing
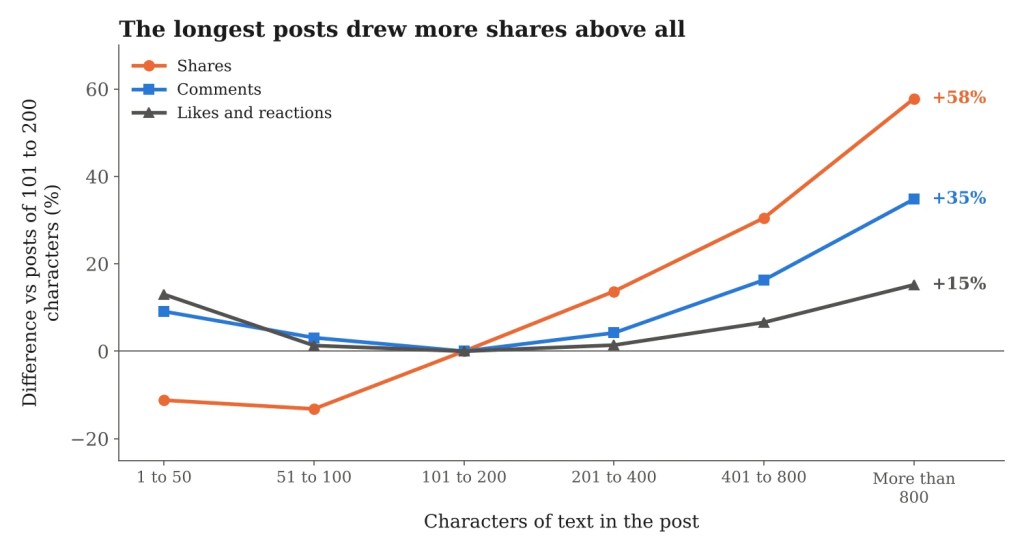
The kind of engagement changed more than the amount. Posts of more than 800 characters drew about 58% more shares than the comparison group, 35% more comments and 15% more likes and reactions. Relative to their likes, they drew about 37% more shares and 17% more comments.
At the other end, very short posts drew a few more likes but about 11% fewer shares, and posts with no text drew about 53% fewer shares relative to their likes. One reading is that longer text gives people something to pass on or argue with, while a short line invites a quick like. These data cannot show that directly.
Pages that wrote more did not draw more
Comparing pages with each other rather than posts within a page, those that wrote longer posts on average drew fewer interactions per post. But they also tended to have smaller followings, and once I took page likes into account, the difference was no longer clear. So I would not read anything into it.
I also checked whether the pattern changed over time. The link between length and engagement looked steeper before 2015 than after, but that change lines up with the 2015 change in data capture, so I cannot tell a real shift from a change in the data. From mid-2015 to 2020 there was no clear trend.
The caveats
These are associations, not effects. Pages choose how much to write, and they may write more for posts they think matter most, or leave text off posts they pass on in a hurry. Comparing posts within the same page and month helps, but it does not make two posts alike.
Some posts recorded as having no text may have had text that CrowdTangle did not capture, and my way of spotting passed-on content is approximate. Characters are a crude measure that ignores what the text said, its tone and its language. Facebook added reactions beyond the like in 2016, which changes what an interaction is. Interactions are not reach or persuasion, and they include critics and people abroad. I also looked at whether the pattern differed between party pages, leaders’ pages and populist pages; any differences were small and uncertain, so I leave them aside.
The paper is a preprint and has not been peer reviewed. I wrote the text, with drafting and editing assistance from Claude. The views in this post and the paper are my own.

