
A lot of people hoped social media would level the playing field, letting small parties reach voters without the money and media attention of the big ones. Others expected the internet to look much like offline politics, with the big parties on top. I wanted to see which picture fitted Finland in the 2010s.
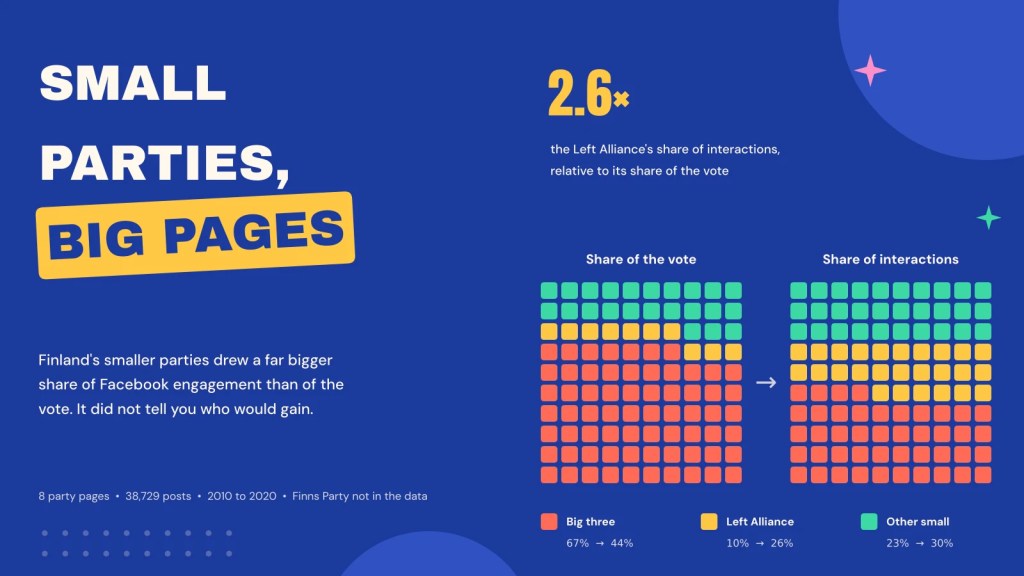
On Facebook, at least, the small parties looked big. The three largest established parties won about two-thirds of the vote among the parties I could study, but drew well under half of the engagement. The twist is that none of this told you who was about to win votes.
The paper
Small Parties, Big Pages: Engagement and the Vote among Finnish Parties on Facebook, 2010 to 2020
Read the paper (open access)
What I looked at, and what is missing
The data are 38,729 public posts from eight Finnish party pages, January 2010 to September 2020, with about 6.1 million interactions. I collected them through CrowdTangle, Meta’s tool for tracking public pages, which closed in 2024. An interaction is any reaction, comment or share.
I need to be upfront about a big gap. The Finns Party, the main challenger of the decade, is not in the data, and nor is its 2017 breakaway, Blue Reform. The Finns Party won between 17.5% and 19.1% at each parliamentary election. So every share in this post is a share among the parties that are in the data, which won about 79% to 85% of the vote at each election. Leaders’ and candidates’ pages are not included either.
There is a second wrinkle. In May 2015, just after that year’s election, CrowdTangle changed how it captured photo posts, and photos went from about 4% of posts before then to 27% after. Engagement also grew hugely over the decade: from about 15,000 interactions in the month before the 2011 election to 277,000 before the 2019 one. So I compare each party’s share of all interactions within the same period, and lean on June 2015 to September 2020. Earlier years are context only.
The big three drew far less than their vote
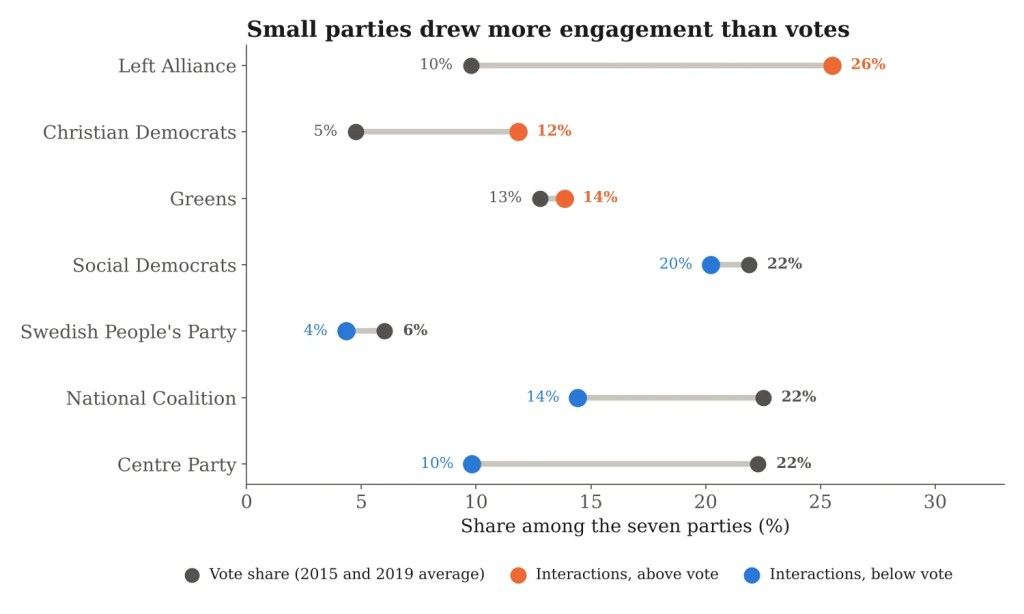
From June 2015, the Centre Party, the National Coalition and the Social Democrats together drew 44% of interactions on these pages, against 67% of the vote among the same parties. They also posted less, about 35% of the posts. The gap was largest for the Centre Party, which drew 10% of interactions against 22% of the vote. The Social Democrats came closest to their size.
This was not a one-off. The big three’s share of interactions was below their vote share in the month before every election from 2011 to 2019. Leaving photo posts out changes little: they still drew 43%.
Two small parties, two different routes
The Left Alliance was the standout. It drew 26% of interactions from June 2015, about 2.6 times its vote share of about 10%, and drew more than any other page in every year from 2016 to 2019. It posted a little more than the Social Democrats, but the main difference was the response: its median post from 2016 drew 229 interactions, the highest of the eight.
The Christian Democrats got there differently. They drew 12% of interactions, 2.5 times their vote share, mostly by posting a lot: about 105 posts a month from 2016, nearly twice as many as any other party, and 27% of all posts. Their median post drew just 44 interactions, the lowest of the eight. Their share of interactions rose from about 5% in 2016 to 16% in 2019.
Small parties looked larger on Facebook than at the ballot box. But Facebook did not tell you who was about to gain.
The Greens’ page faded while their vote grew
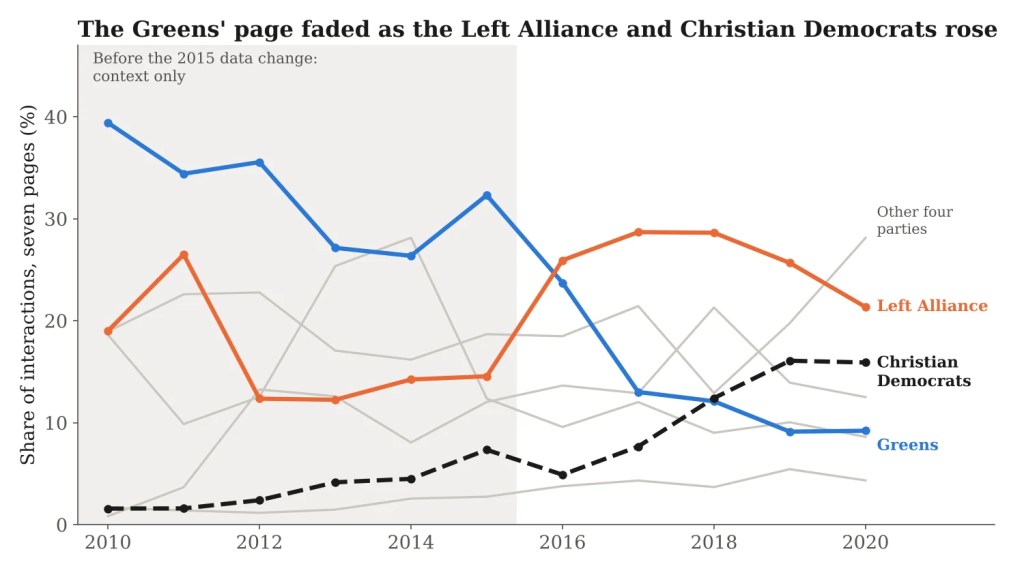
The party that gained most in 2019 was the Greens, from 8.5% of the national vote in 2015 to 11.5% in April 2019, and then 16.0% at the European election that May. You would not have guessed it from Facebook.
The Greens’ page drew about a third of interactions in the second half of 2015. Its share then fell year after year, to 24% in 2016, 13% in 2017 and 9% in 2019. This was a relative fall. The Greens posted less, from 71 posts a month in late 2015 to 37 in 2019, and their posts gained less engagement than everyone else’s. Their average post drew 219 interactions in 2016 and 283 in 2019, while the other pages’ average rose from 121 to 305. Roughly two-fifths of the fall came from posting less and three-fifths from weaker engagement per post.
The Greens still had the biggest page by likes in 2020, but it grew by only about 35% from 2016, against 133% for the Left Alliance. That looks like a page whose audience stopped growing. It says nothing about the party’s voters, whose number grew.
The month before the 2019 election
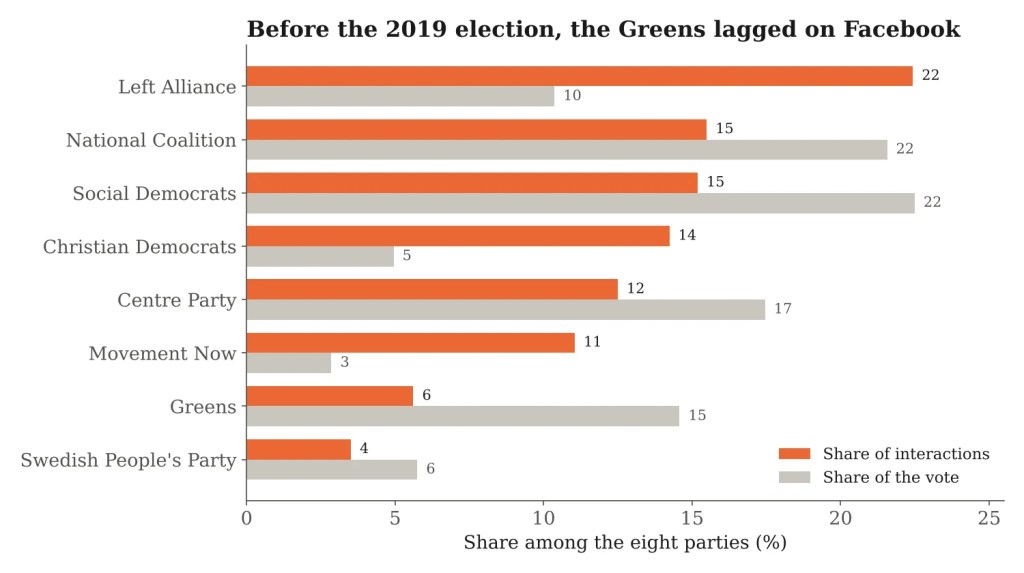
In the 30 days before the April 2019 election, the Greens drew 6% of interactions against 15% of the vote among these parties. The Left Alliance drew 22% against 10%. Its vote did rise a little that year, but its Facebook share had been high since 2016, so it was a steady feature rather than an early sign.
Movement Now, launched in April 2018 by the former National Coalition MP Harry Harkimo, is the clearest case of a newcomer drawing a burst of attention. It drew 11% of interactions with just 4% of the posts. It won 2.3% of the national vote and one seat.
Being in government made no clear difference
I also asked whether parties in government drew more or less engagement than in opposition, comparing each page with itself in other months. From June 2015, I could not detect a clear difference: the estimate was about 12% lower in government, but with a wide margin of error. Holding the prime minister’s office went with more engagement, but that rests on just two parties, and mostly on the Social Democrats in 2020, when Sanna Marin led the government through the pandemic.
The caveats
The biggest one is the missing Finns Party. If it were in the data, the small parties’ shares would be lower, and the big three’s gap might be larger. Leaders’ and candidates’ pages matter a lot in Finland’s candidate-centred system, and they are missing too.
The May 2015 change in photo capture cannot be dated exactly in Finland, because photo posts were already rising in that year’s campaign, so the earlier years are weak, especially 2011. Interactions are not support: they include critics, people abroad and possibly paid promotion. Five elections and one set of pages are too few to generalise, and none of this shows that Facebook caused anything. These are patterns, not causes.
The paper is a preprint and has not been peer reviewed. I wrote the text, with drafting and editing assistance from Claude. The views in this post and the paper are my own.

