
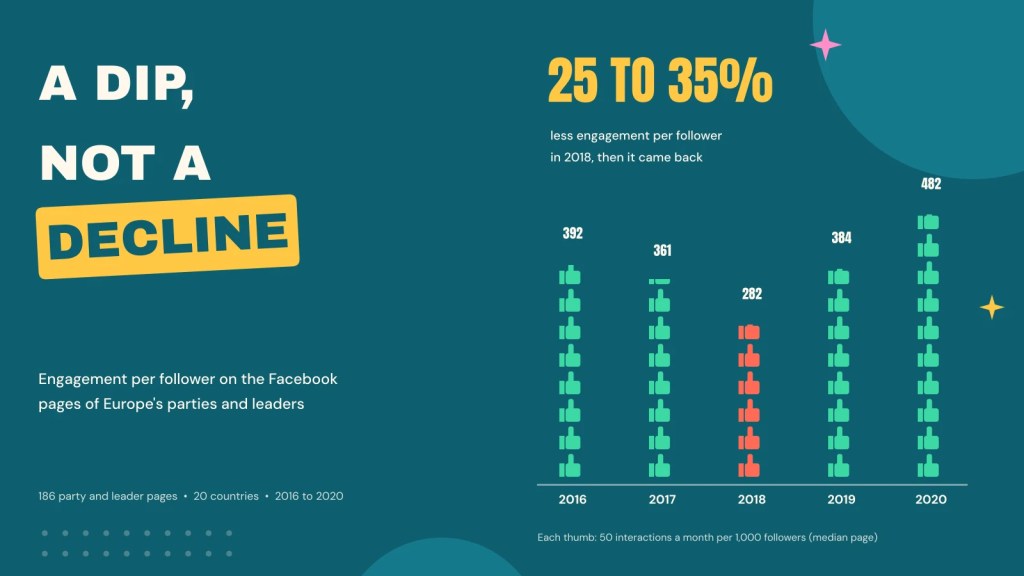
You often hear that Facebook slowly strangled the reach of pages: build an audience, and the platform shows your posts to fewer and fewer of them. I wanted to check that story for political parties.
Facebook does not publish reach. But it did record how many people liked a page each time the page posted. So I could measure engagement per follower, the likes, comments, shares and reactions a page got for each person following it. That is not reach, but it is the closest public signal there is.
The paper
A Dip, Not a Decline: Engagement per Follower on the Facebook Pages of European Parties and Leaders, 2016 to 2020
Read the paper (open access)
What I did
CrowdTangle, Meta’s tool for tracking public pages, which closed in 2024, recorded the page’s like count with each post. I used 506,179 posts from 112 party pages and 74 party leaders’ pages in 20 European countries. The counts barely exist before late 2015, so I start in 2016 and do not guess earlier ones. I compared each page with itself over time.
A dip, then a recovery
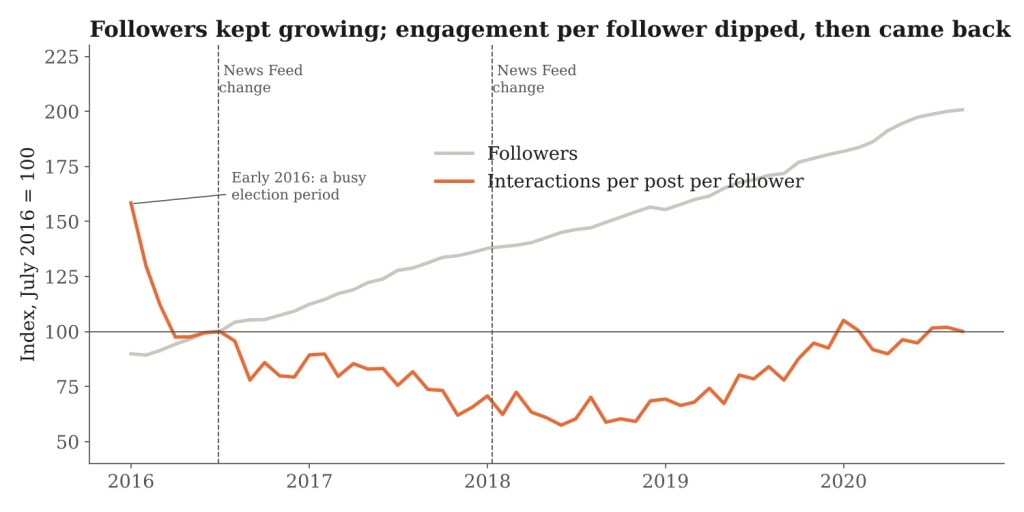
Engagement per follower fell by about 25 to 35% between 2016 and 2018. The exact figure depends on whether you count the unusually busy first months of 2016. It hit a low in mid-2018, then climbed back. By 2020 it was back at about its 2016 level.
The pattern showed up on most pages: about 78% of pages fell to 2018 and 75% rose after. It held on party and leader pages, for links, photos and videos, and across most countries.
Not a cliff edge
Facebook announced News Feed changes in June 2016 and January 2018, and warned pages their reach might fall. In these data there was no sudden drop at either date. The decline was slow and steady.
Not just bigger audiences
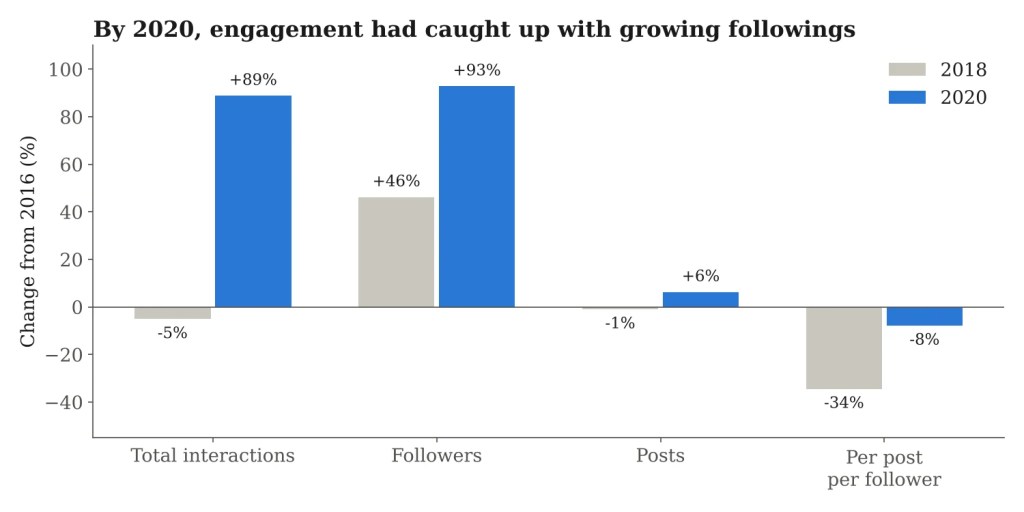
Could engagement per follower fall just because followings grew? Not really. Within a page, interactions rose almost one for one with followers. What happened was timing. By 2018 followers were up about 46% but total interactions had not grown. By 2020 interactions had caught up: both were up by about 90%.
Engagement per follower dipped and came back. It did not fade away.
The caveats
Engagement is not reach. A fall per follower could mean fewer people saw posts, or the same people reacted less. Page likes include people who never see a page’s posts. The best known fall in organic reach, around 2012 to 2014, happened before these counts exist, so I cannot test it. And 2019 and 2020 were busy political years, which may explain part of the recovery.
The paper is a preprint and has not been peer reviewed. I wrote the text, with drafting and editing assistance from Claude. The views in this post and the paper are my own.

