
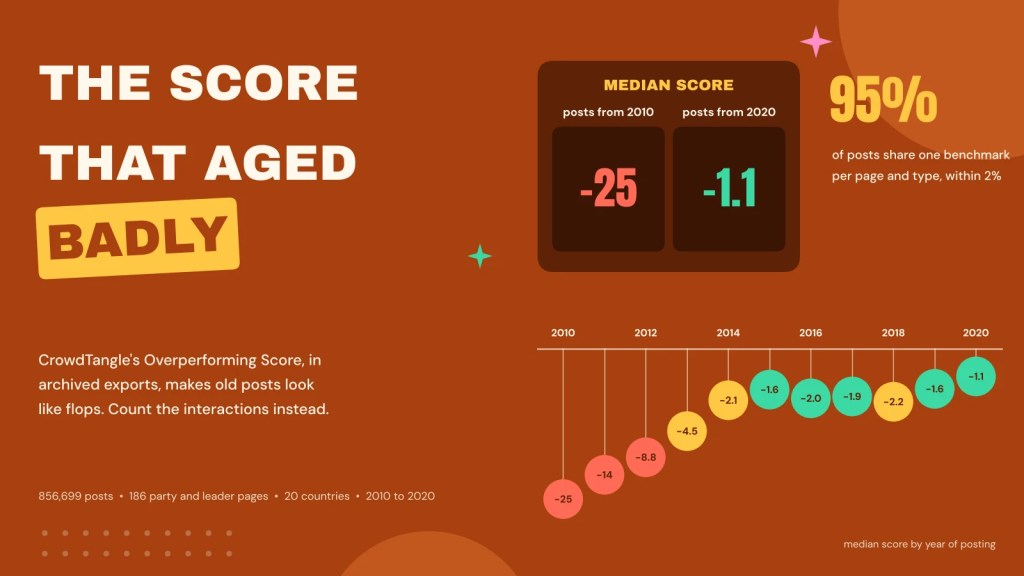
If you studied Facebook pages before 2024, you probably used CrowdTangle, and you probably still have a folder of its CSV exports. Each row carries a column called the Overperforming Score. It looks like a gift: a single number that says whether a post did better or worse than usual for its page, so you can compare small pages with big ones and 2012 with 2020.
I had that column for nearly 900,000 posts and wanted to know what it actually measured. The short answer: in an archived export, the score does not compare a post with what was normal when it was posted. It compares it with what was normal when the data were downloaded. That makes old posts look like flops, and it quietly removes the differences between pages that many studies care about.
The paper
Count the Interactions, Not the Score: What CrowdTangle’s Overperforming Score Measures in Archived Facebook Data
Read the paper (open access)
What the score is supposed to be
CrowdTangle, Meta’s tool for tracking public pages, closed in August 2024, but its exports live on in many research archives. Its help pages described the score like this. Take the page’s last 100 posts of the same type (photo, link, video and so on), drop the top and bottom quarter, and average the rest. That is the benchmark. A post with three times the benchmark scores 3. A post that falls short gets a negative score: a post with a quarter of the benchmark scores minus 4.
What the documentation never said is when “the last 100 posts” are counted for a post that is already years old when you ask for it. For a post from 2012 downloaded in 2020, that question decides everything.
My data are 856,699 posts from 186 party and party leader pages in 20 European countries, 2010 to 2020, exported in October 2020 for my PhD. An interaction is any like, comment, share or other reaction. The score was present for every single post, and it followed the documented sign rules. So far, so good.
Old posts all look like underperformers
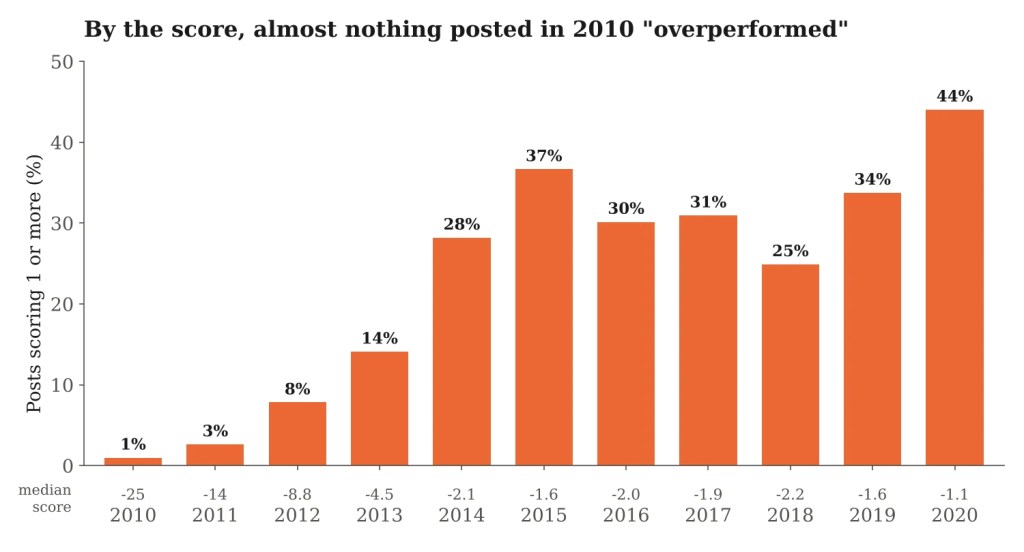
The first warning sign is how the score changes with a post’s age. The median post from 2010 scores -25. For 2012 it is -8.8, for 2015 -1.6, and for 2020 -1.1. Only 1% of posts from 2010 count as overperforming, against 44% from 2020.
If the score were comparing each post with its page’s recent posts at the time, you would expect about the same balance every year. Pages were not failing for a decade. What grew was the audience: Facebook pages drew far more interactions in 2020 than in 2010, and the score seems to be holding old posts up against that later yardstick.
One benchmark, set around the export date
You can work backwards from the score to the benchmark it used, because the formula is published. When I did, the benchmark barely moved within a page and post type. For 95.5% of posts it was within 2% of a single value for that page and type, and that held for 95% or more of posts in every year from 2010 to 2019. (In 2020 it was 75%, because many posts were only days or weeks old and had their own short-term benchmarks.)
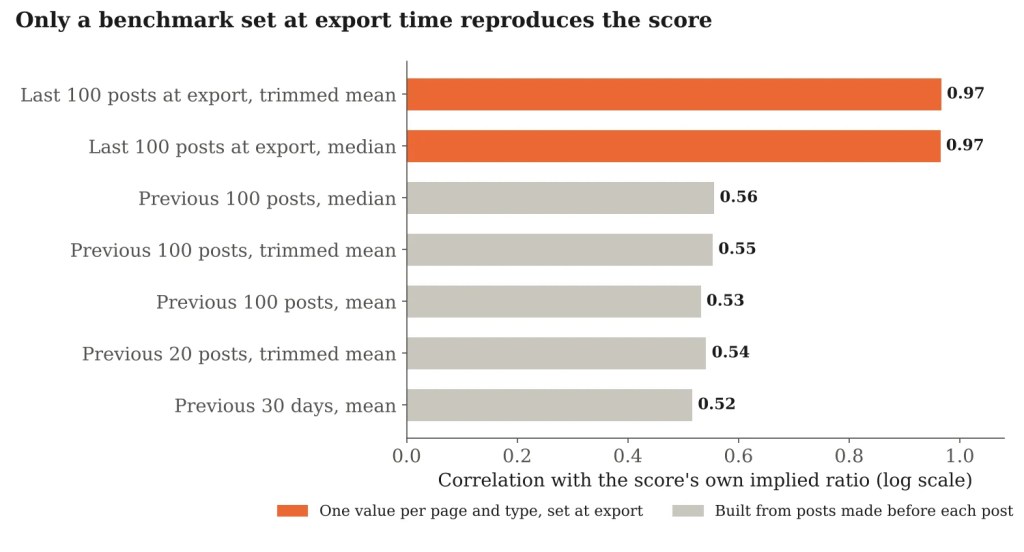
Then I tried to rebuild the score. Benchmarks made from the posts before each post, which is what most people assume the score uses, fit poorly: correlations of 0.52 to 0.56, and they get the sign right only about 70% of the time. A single benchmark from each page’s last 100 posts before the export fits closely, at 0.97, with the sign right for 94% of posts. My rebuild is not exact, and I cannot see CrowdTangle’s actual calculation, but the pattern is clear.
Within a page, the score is raw interactions in disguise.
That has a simple consequence. If every post of a page and type is divided by the same number, the score ranks those posts in exactly the same order as raw interactions. Among page types with at least 30 posts, the median rank correlation between the two was above 0.999. Within a page, the score adds nothing you could not get from the counts.
Between pages, the differences disappear
Across pages, the score does something more consequential. Because each page is divided by its own typical post around 2020, big and small pages end up on the same footing, whatever their audience was at the time. That can hide exactly the differences researchers want to study.
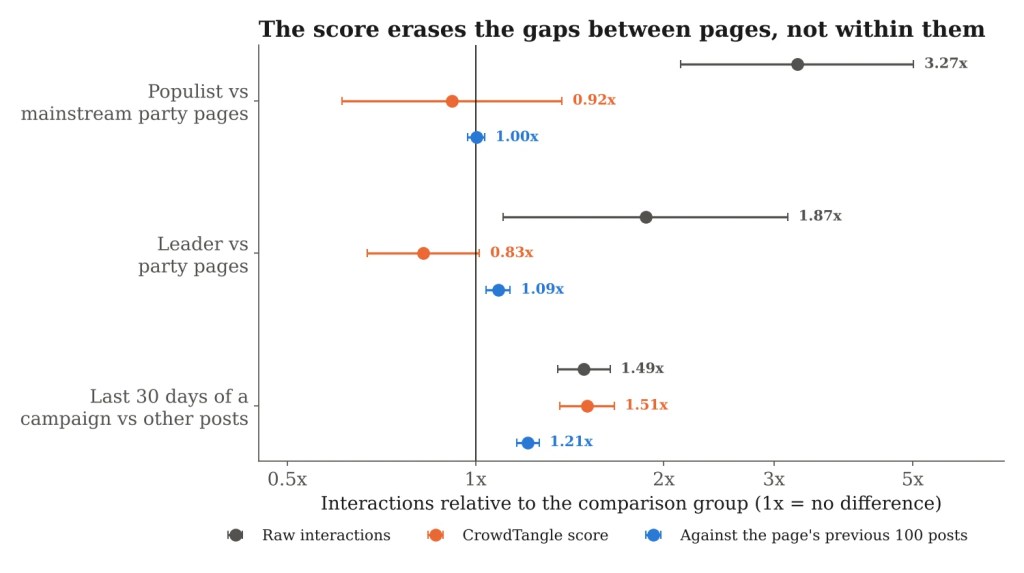
In raw interactions, posts by populist parties drew about 3.3 times as many interactions as mainstream parties’ posts in the same country and month. Measured with the score, the gap vanishes, at about 0.92 times. Leaders’ pages drew about 87% more than party pages in raw terms, and slightly less on the score, a difference I cannot tell apart from zero.
Neither answer is wrong. They are different questions. The score asks whether a page did well relative to its own later self; raw counts ask who drew more attention. Where the comparison is within a page, the two agree: posts in the last 30 days of an election campaign drew about 49% more interactions than the same page’s other posts, and 51% more on the score. Against each page’s previous 100 posts, the campaign lift is smaller, about 21%, because that benchmark itself rises as the campaign goes on.
What I would do instead
If you have inherited CrowdTangle exports, my practical advice for this kind of data is short.
Count the interactions. Compare raw counts within the same page and period, for instance with page and month fixed effects, so each page is compared with itself at the time. If you want a relative measure, build it yourself and say how: for example, each post against the trimmed mean of the page’s previous 100 posts of the same type. Be aware that such a baseline absorbs slow trends and campaign build-ups, so it answers a narrower question.
Report the export date, too. In posts from five UK pages that appeared in two exports three weeks apart, only 65% had the same score. The order of posts barely changed, but scores from different exports are not strictly comparable. And watch for oddities: rounding creates many ties, posts with no interactions get scores that depend only on the benchmark, and the scale runs from about minus 30,000 to plus 279, so averages of raw scores mislead.
The caveats
This is one archive: political pages in Europe, exported in October 2020. Other exports, or other versions of CrowdTangle’s method, may behave differently, and scores collected in real time, close to posting, may work as documented. In the live dashboard most posts people looked at were recent, so the two readings would largely coincide. My reconstruction of the benchmark fits far better than the alternatives but does not match its level exactly, and I cannot observe the calculation itself. The overlap between exports covers only five pages.
None of this says the score was badly designed for its original job. It says that, read back years later from an archive, it measures something different from what its name suggests.
The paper is a preprint and has not been peer reviewed. I wrote the text, with drafting and editing assistance from Claude. The views in this post and the paper are my own.

