
If Facebook had run British elections, UKIP would have won in 2015 and Jeremy Corbyn in 2017 and 2019. The polls, and the voters, had other ideas.
I have ten years of Facebook data for the main British parties and their leaders: 89,110 posts from June 2010 to October 2020, which drew 218 million likes, reactions, comments and shares. I matched it to the polls, month by month, and asked two questions. Who carries a party on Facebook, its leader or its party page? And does any of it tell you how the party is actually doing?
The preprint
Open access, free to read, share and cite. 16 pages, 10 figures, full methods and robustness checks. Not peer reviewed.
Cite as: Hotham, T. (2026). Who Carries the Party on Facebook? Leaders, Party Pages and the Polls in Britain, 2010 to 2020. Zenodo. https://doi.org/10.5281/zenodo.23263764
The short version
Some leaders were the party. Others barely showed up.
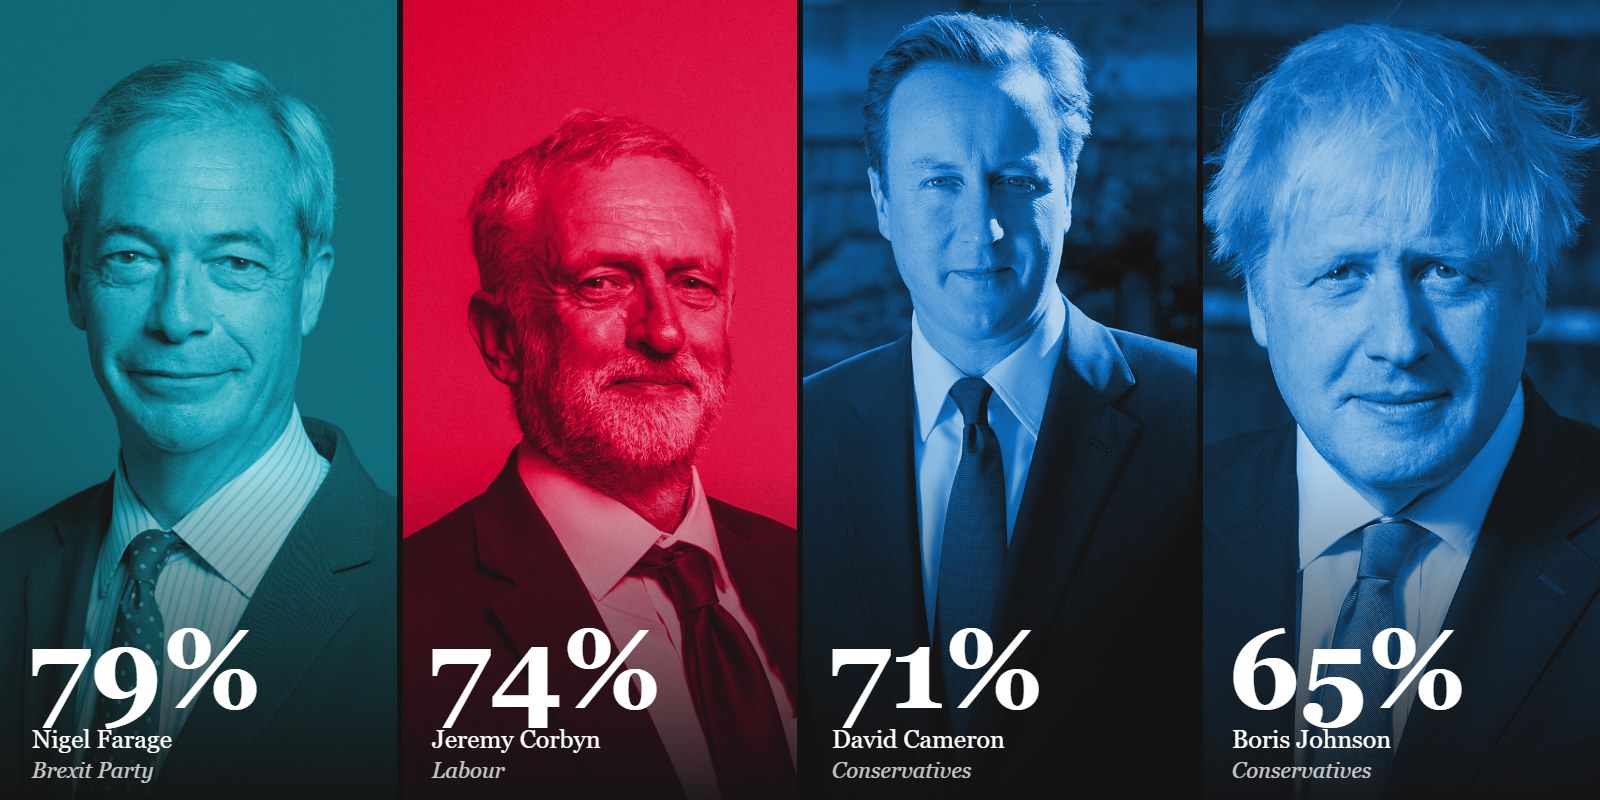
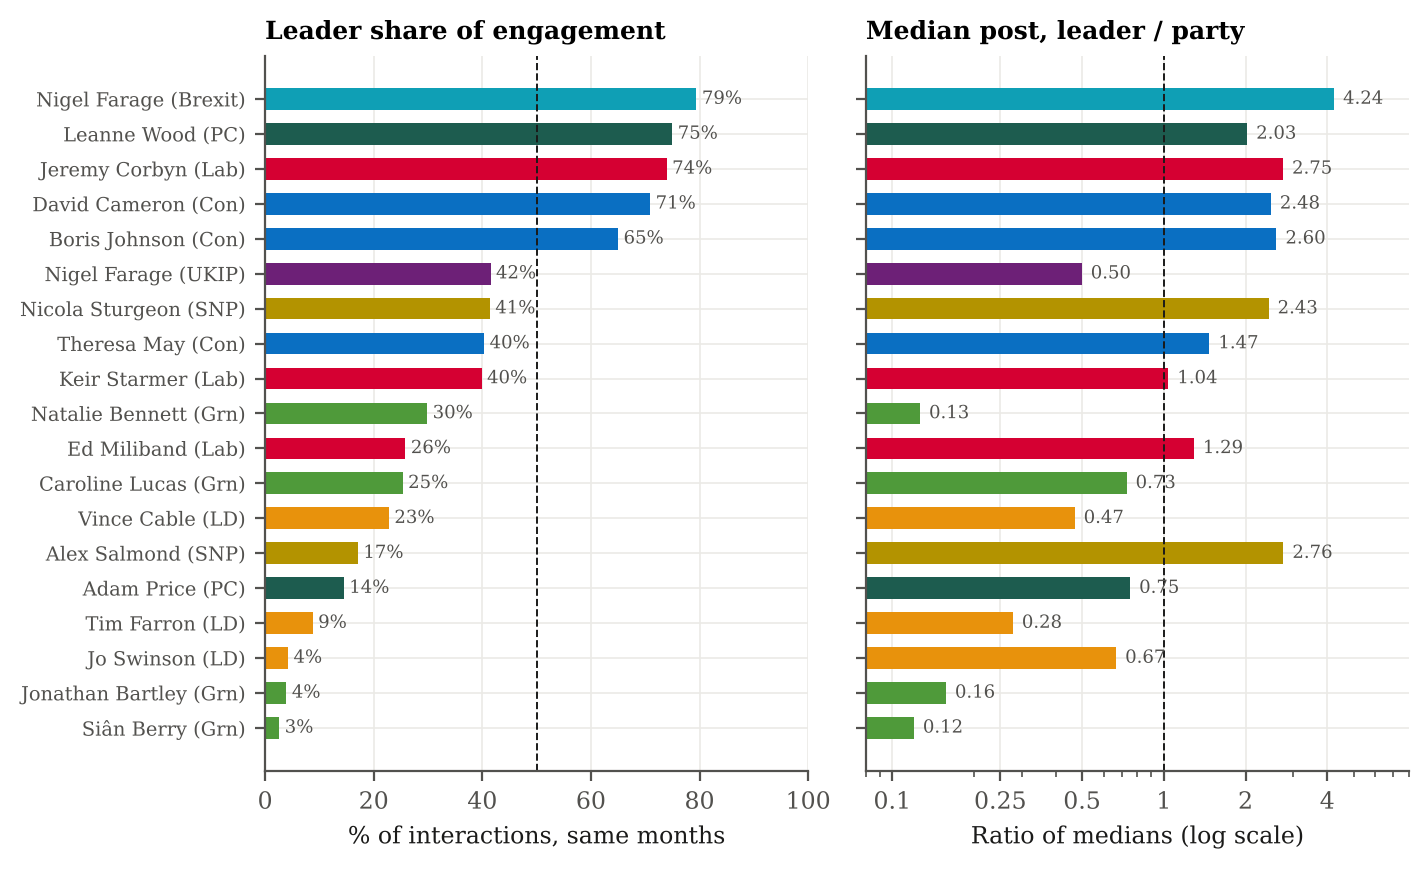
I matched each leader’s page to their party only for the time they led it, and added it to the party’s own page. The spread is huge. Nigel Farage took 79% of the Brexit Party’s engagement, Leanne Wood 75% of Plaid Cymru’s, Corbyn 74% of Labour’s and David Cameron 71% of the Conservatives’. At the other end, Liberal Democrat and Green leaders mostly took a quarter or less. Jonathan Bartley and Siân Berry took 4% and 3%.
This is about people, not a trend. Within the Conservatives the leader’s share went from 71% under Cameron to 40% under Theresa May and back up to 65% under Boris Johnson. Within Labour, from 26% under Miliband to 74% under Corbyn and 40% under Keir Starmer. Within parties there was no steady rise over the decade.
Facebook’s electorate is not the electorate
Count up each party’s share of all the interactions and compare it with the vote. In 2015 UKIP took 34% of interactions on these pages during the campaign and 13% of the vote. In 2017 Labour took 69% of interactions and 41% of the vote; in 2019, 55% and 33%. The Conservatives won all three elections with 25%, 18% and 32% of the interactions.
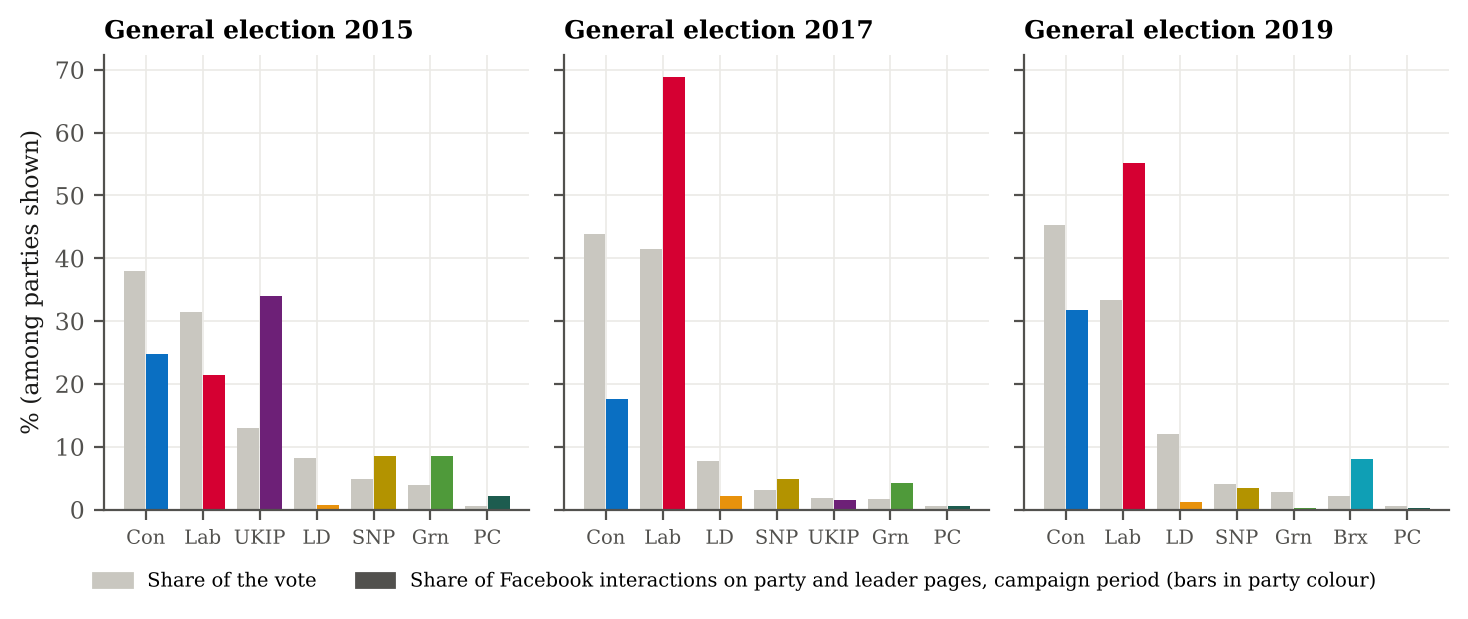
Facebook’s electorate would have put Jeremy Corbyn in Downing Street twice.
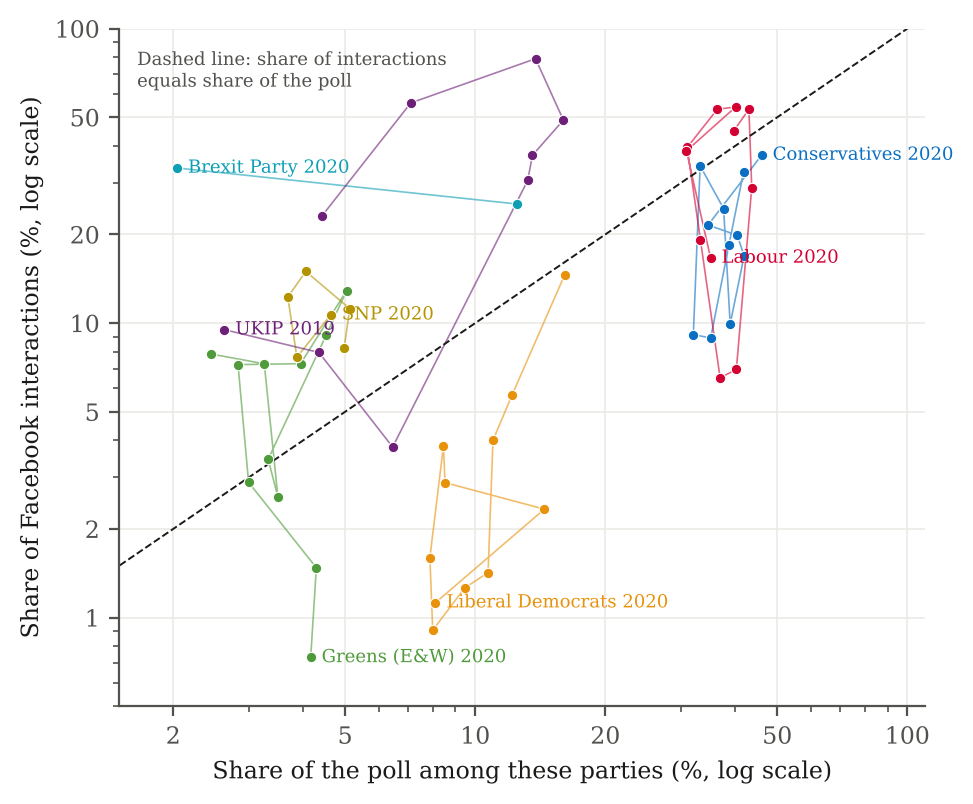
Across the whole decade the pattern holds. UKIP and the Brexit Party each took about a third of interactions in the months they were active while polling under 10%. The Conservatives took a fifth while polling 36%. Insurgents and the left had big, busy audiences; the party that kept winning did not.
But within a party, engagement does move with the polls
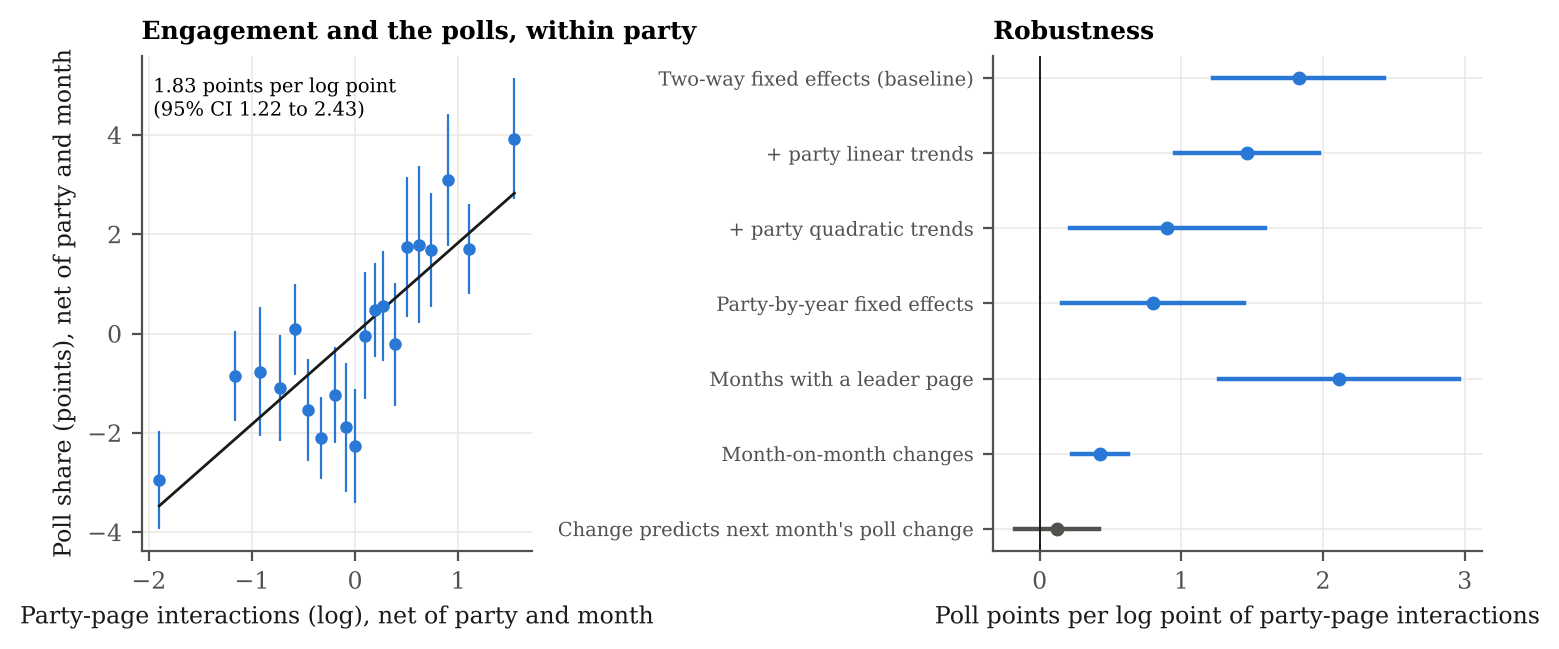
Comparing parties is hopeless. Comparing a party with itself works better. In months when a party’s page drew more engagement than usual, relative to everyone else that month, the party tended to poll higher. Month-on-month, a doubling of engagement went with about 0.3 points on the polls in the same month, and the link held within the same party and year. It was clearest for UKIP and Labour, and absent for the Conservatives and the SNP.
The catch is timing. Engagement moved in the same month as the polls. I found no sign that it moved first, so it is a thermometer, not a crystal ball. If you already have the polls, Facebook engagement adds little.
When the leader takes over the feed
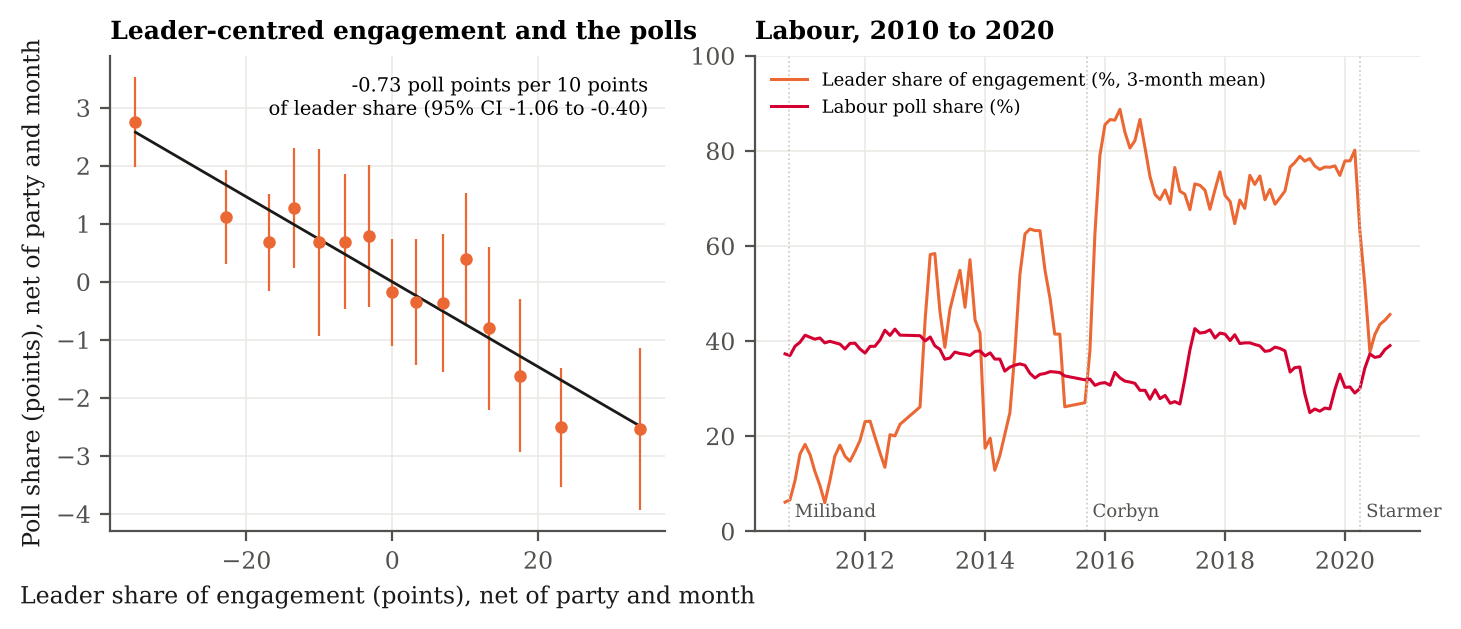
Here is the twist. The signal came from the party page. The leader’s page added nothing. And in periods when more of a party’s engagement went to its leader, the party polled lower: about 0.7 points for every 10 points of leader share.
Labour is the clearest case. Corbyn’s page took around three quarters of Labour’s engagement for most of his leadership, and stayed high as Labour’s polling slid through 2019. Under Starmer the leader’s share fell to about 40% as Labour recovered. The Brexit Party did something similar after its 2019 peak. One reading is that leader pages hold a loyal following that keeps engaging as wider support drains away. I want to be straight about the limits, though: this result rests mostly on Labour and the Brexit Party, and month-to-month changes in the share do not track the polls.
Campaigns belong to the party page
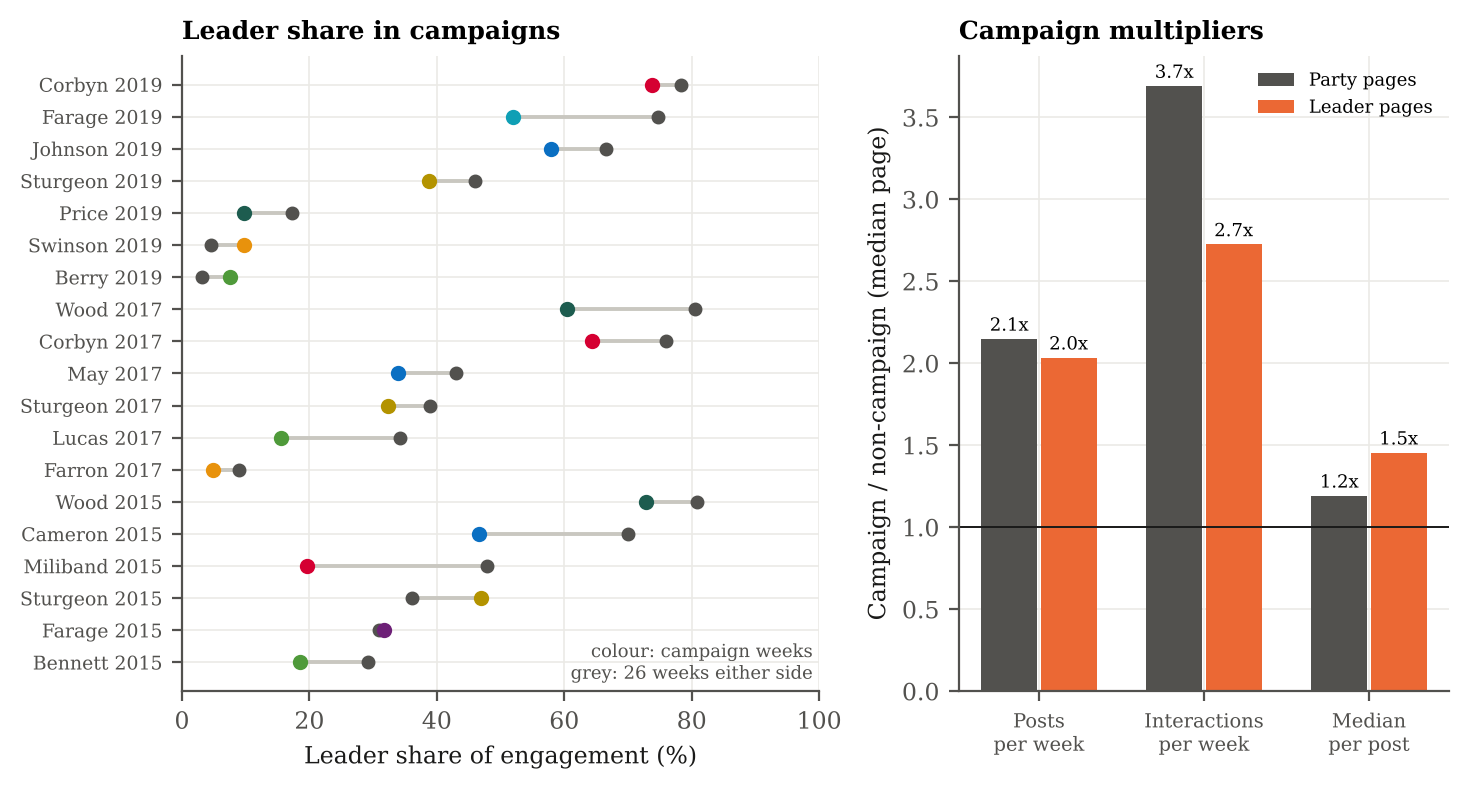
You might expect election campaigns to be all about the leaders. On Facebook, the leader’s share of engagement fell during campaigns, by about 6 points on average, and it fell in 15 of 19 leader campaigns. Cameron went from 70% to 47% in 2015. Ed Miliband went from 48% to 20%.
The reason is volume. Party pages roughly doubled their posting in campaigns and drew 3.7 times their usual interactions. Each leader post actually gained more than each party post, so the leaders did get more attention per post. The parties just drowned them out by posting so much more.
Two more things
A new leader is not a reset button. Across fifteen changes of leader, the party page’s engagement did not reliably rise afterwards. Johnson and Miliband brought big lifts; Sturgeon and Farage’s exit from UKIP were followed by falls.
People love leaders and argue with parties. On posts from 2016 onwards, love reactions made up a bigger share of a leader post’s interactions, while comments and shares made up a smaller one. Leader pages get affection. Party pages get debate and distribution.
Love reactions · party 3.7% → leader 5.3%
Comments · party 22.6% → leader 16.3%
Shares · party 16.1% → leader 12.7%
What I am not claiming
- Not that Facebook moved votes. Nothing here is causal. Engagement and polls moved together; I cannot say which drove which.
- Not that the data are complete. There are no pages for Nick Clegg or Ed Davey, Cameron’s page starts in 2013, and deleted posts are missing.
- Not that leader-heavy parties always do worse. That result rests mostly on Labour and the Brexit Party.
- Not that engagement never leads the polls. With monthly data I can rule out a lead of a month or more, not of a week or two.
This builds on my earlier preprints on Britain First’s Facebook page, the Leave and Remain campaigns on Facebook and YouTube attention and the 2016 US vote. Same habit each time: take the story people tell about online attention and see how much of it survives contact with the data.
The views in this post and the paper are my own.

