
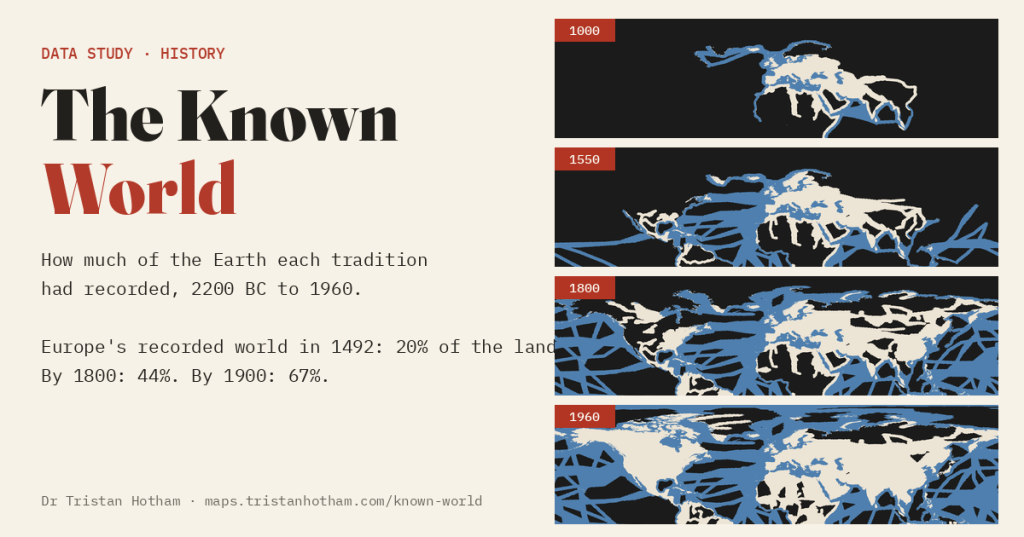
A dark world that lights up as travellers wrote it down. I mapped 681 journeys, from Austronesian canoes leaving Taiwan to the last crossings of Antarctica, to see how much of the Earth Europe, the Islamic world, China and Polynesia had each recorded, and when.
You may have seen the animation. A black globe, a date ticking upwards, and as each ship or caravan sets out the places it reached turn from dark to light: “world exploration from Europe’s point of view”. It is hypnotic. It also has two problems I could not stop seeing. Europe’s own neighbours stay dark for centuries after Greek and Roman writers had described them, and one tradition’s record is presented as if it were the world’s.
So I built my own, and tried to make it honest. I compiled 681 journeys with dated routes, from the Bronze Age Aegean to the 1950s. A place lights up when a journey whose account reached its readers passed close enough to describe it. Europe starts from the world the Mycenaeans and Minoans knew, not from nothing. Because much of the world was mapped by surveyors and settlers rather than explorers, Europe also gets a second layer of 52 regions, lit from the year their systematic survey was published or settlement became general, from the Mitchell map of the American colonies to the aerial survey of northern Canada; you can switch it off. And you can switch the point of view.
One thing first, because it matters more than any number below: every place on these maps was known to the people who lived there. Dark means only that no account in my gazetteer had yet carried it into one tradition’s written record. And almost nobody travelled alone: of my journeys, 72 name a local guide, pilot or interpreter, from the Gedrosian pilot Hydraces who guided Alexander’s fleet to Tupaia, the Tahitian navigator who sailed with Cook, Sacagawea with Lewis and Clark, and Salih bin Kalut, who took Bertram Thomas across the Empty Quarter.
A slow start and a long nineteenth century
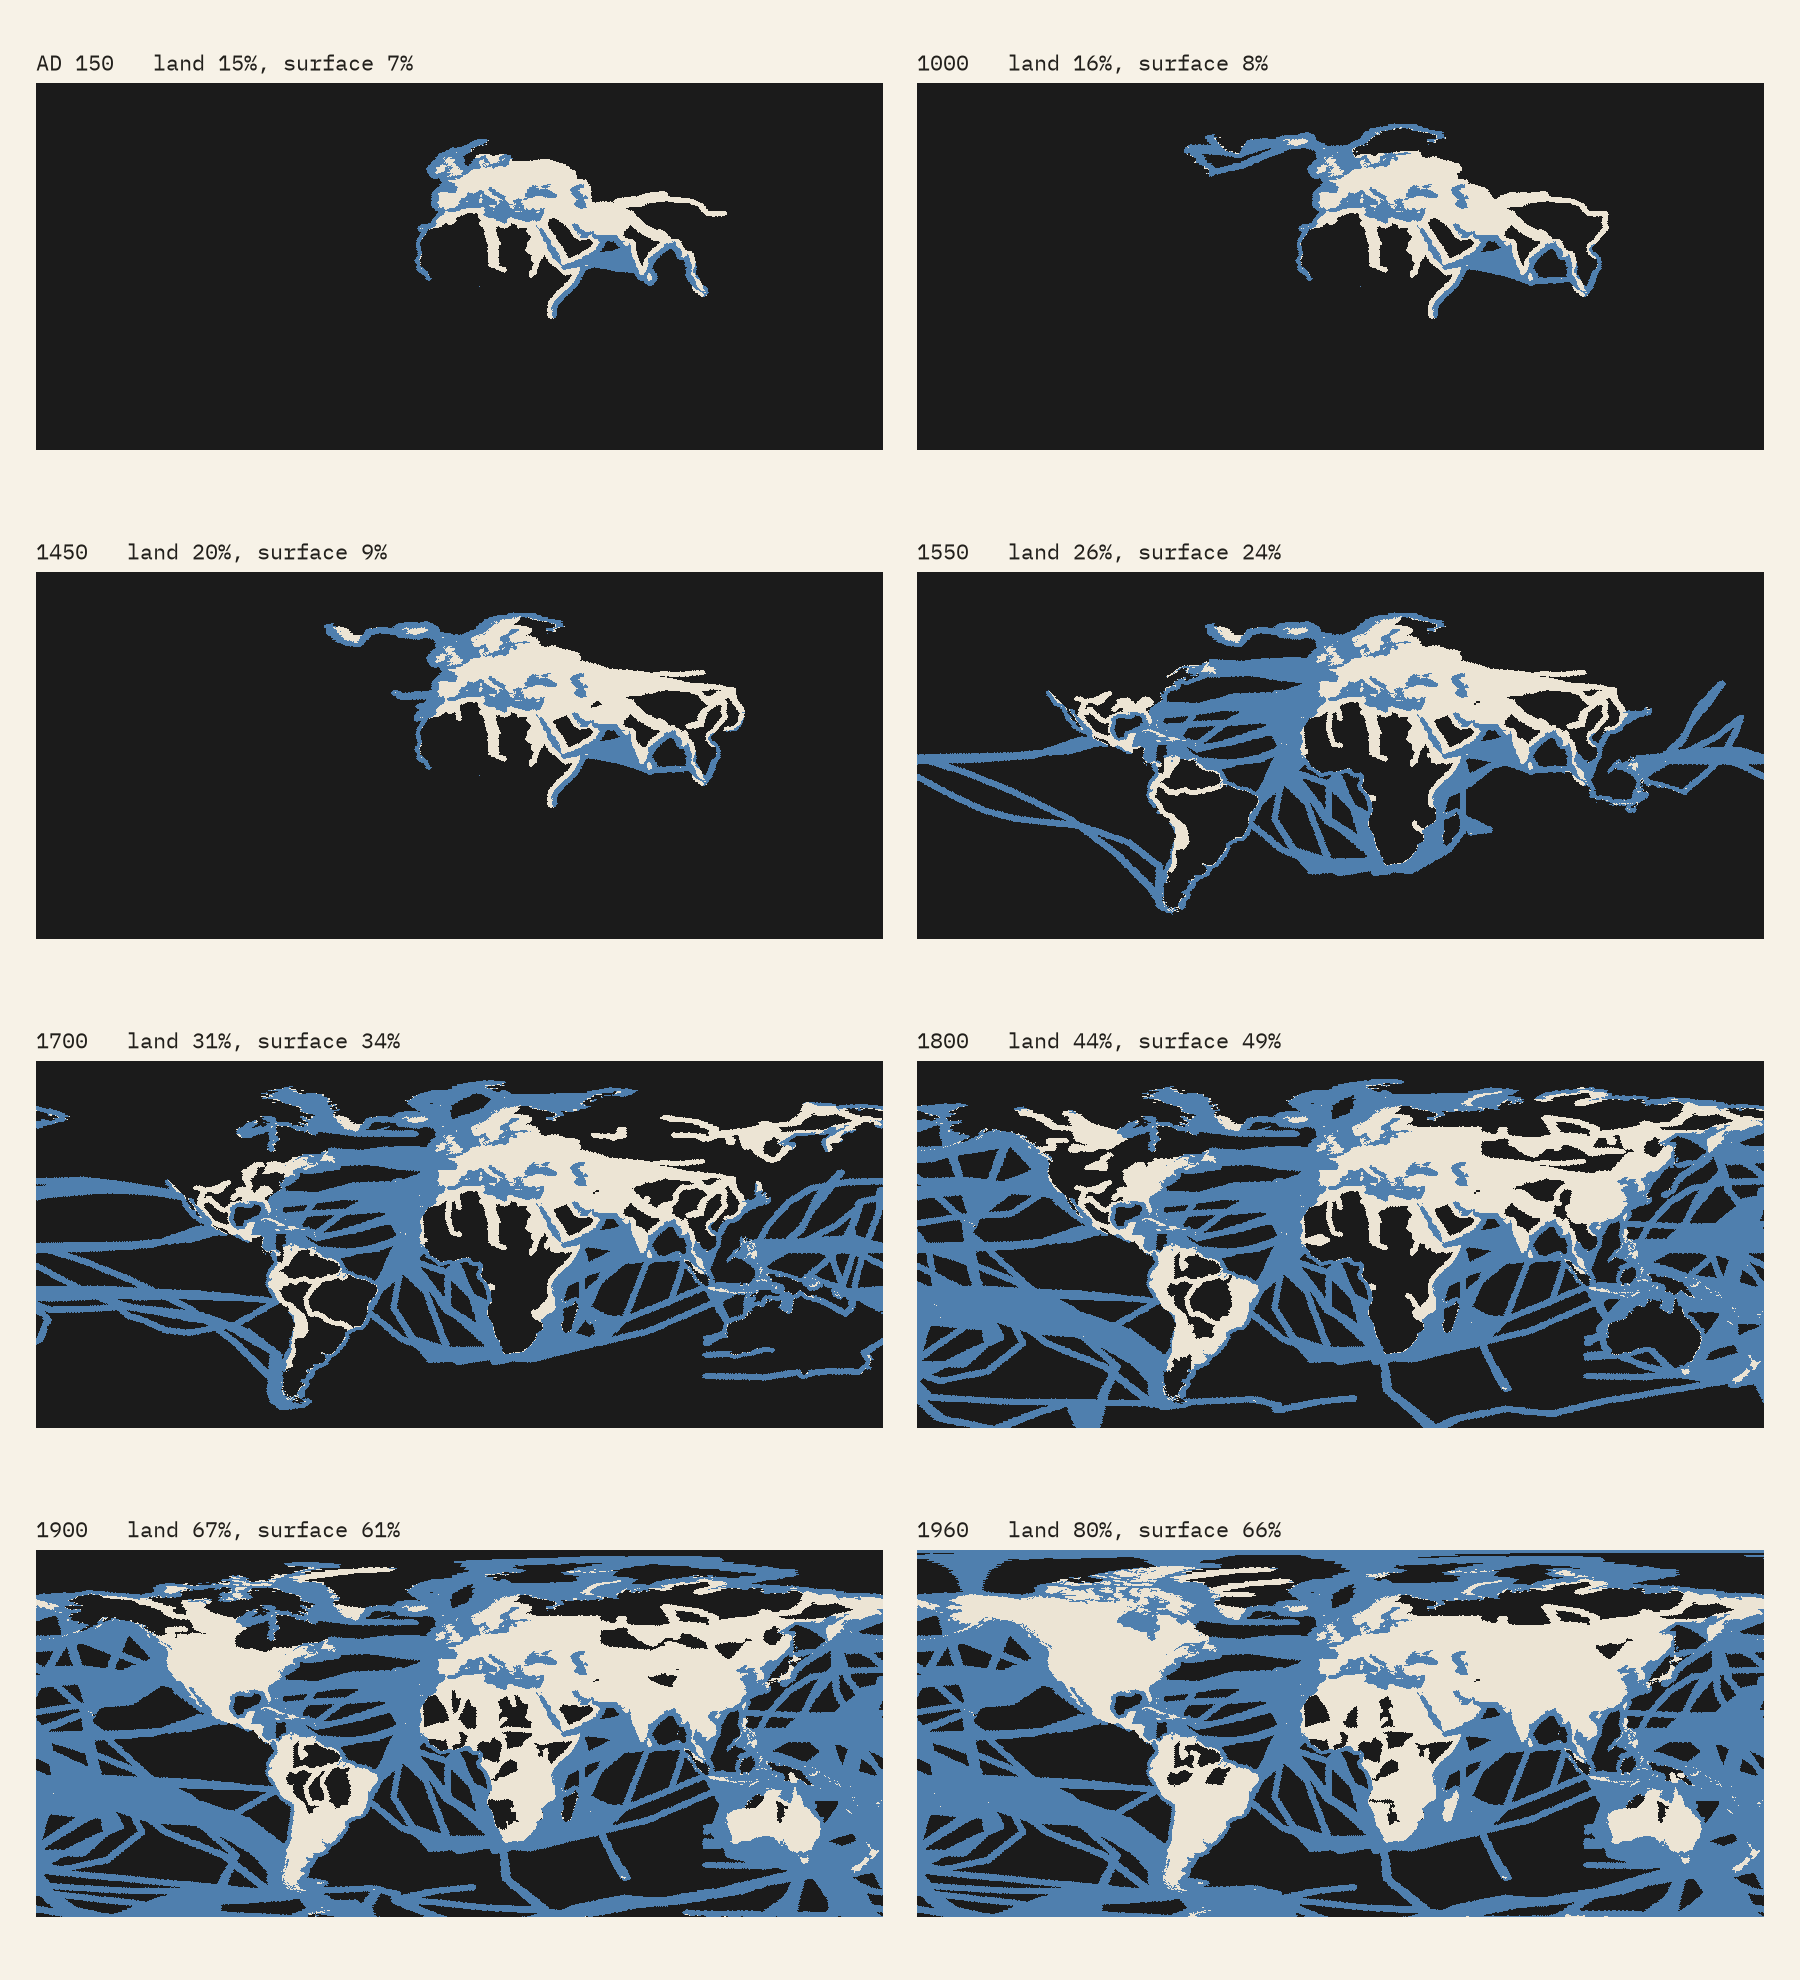
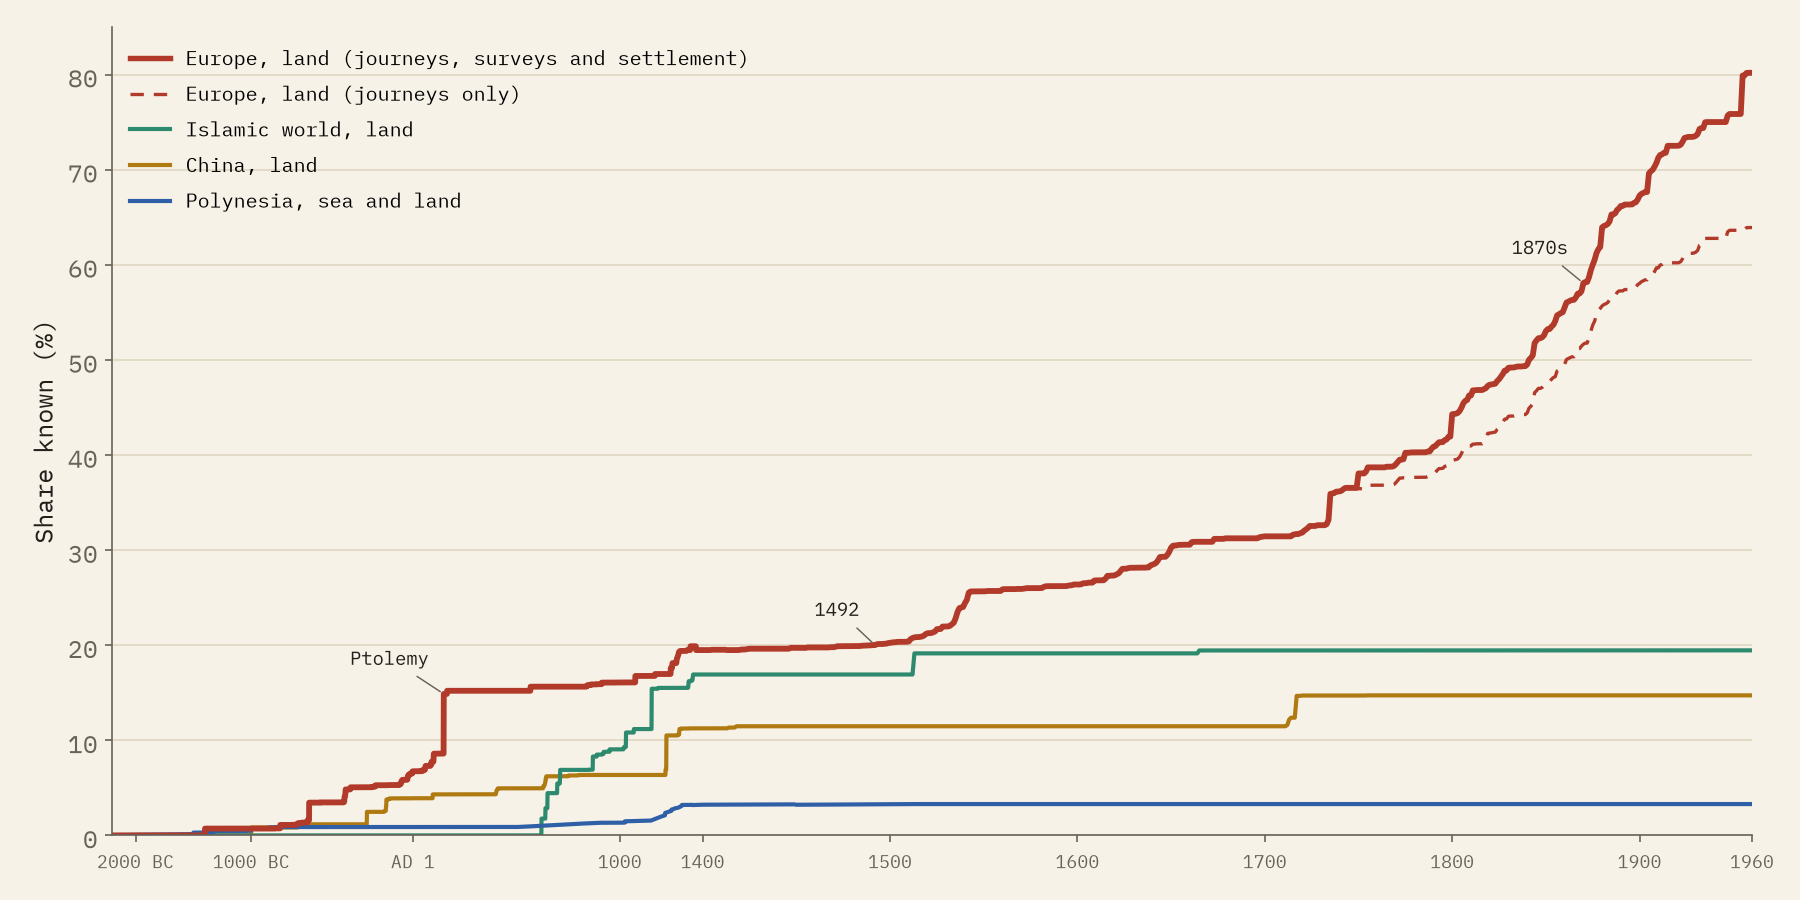
For Europe the first great step is Ptolemy. His Geography, written in Alexandria around AD 150, gathers what the Roman world knew from Ireland to the edge of China, and lifts Europe’s recorded world to 15% of the Earth’s land. Then almost nothing for a thousand years: in 1400 it is 20%, in 1492 20%.
After Columbus and da Gama the sea lights up first. Half of the Earth’s surface is lit for Europe by 1809, but half of its land only by 1841. The nineteenth century adds more land than any other, 23.0% of the world’s total, and the fastest single decade since 1400 is the 1870s, when the crossings of Africa by Livingstone, Stanley and others coincided with the surveys of India and the American West. Counting journeys alone, the curve flattens: 64% of the land in 1960, against 80% with surveys and settlement.
In 1492 Europe’s recorded world covered 20% of the land. By 1800 it was 44%; by 1900, 67%.
Four worlds, not one
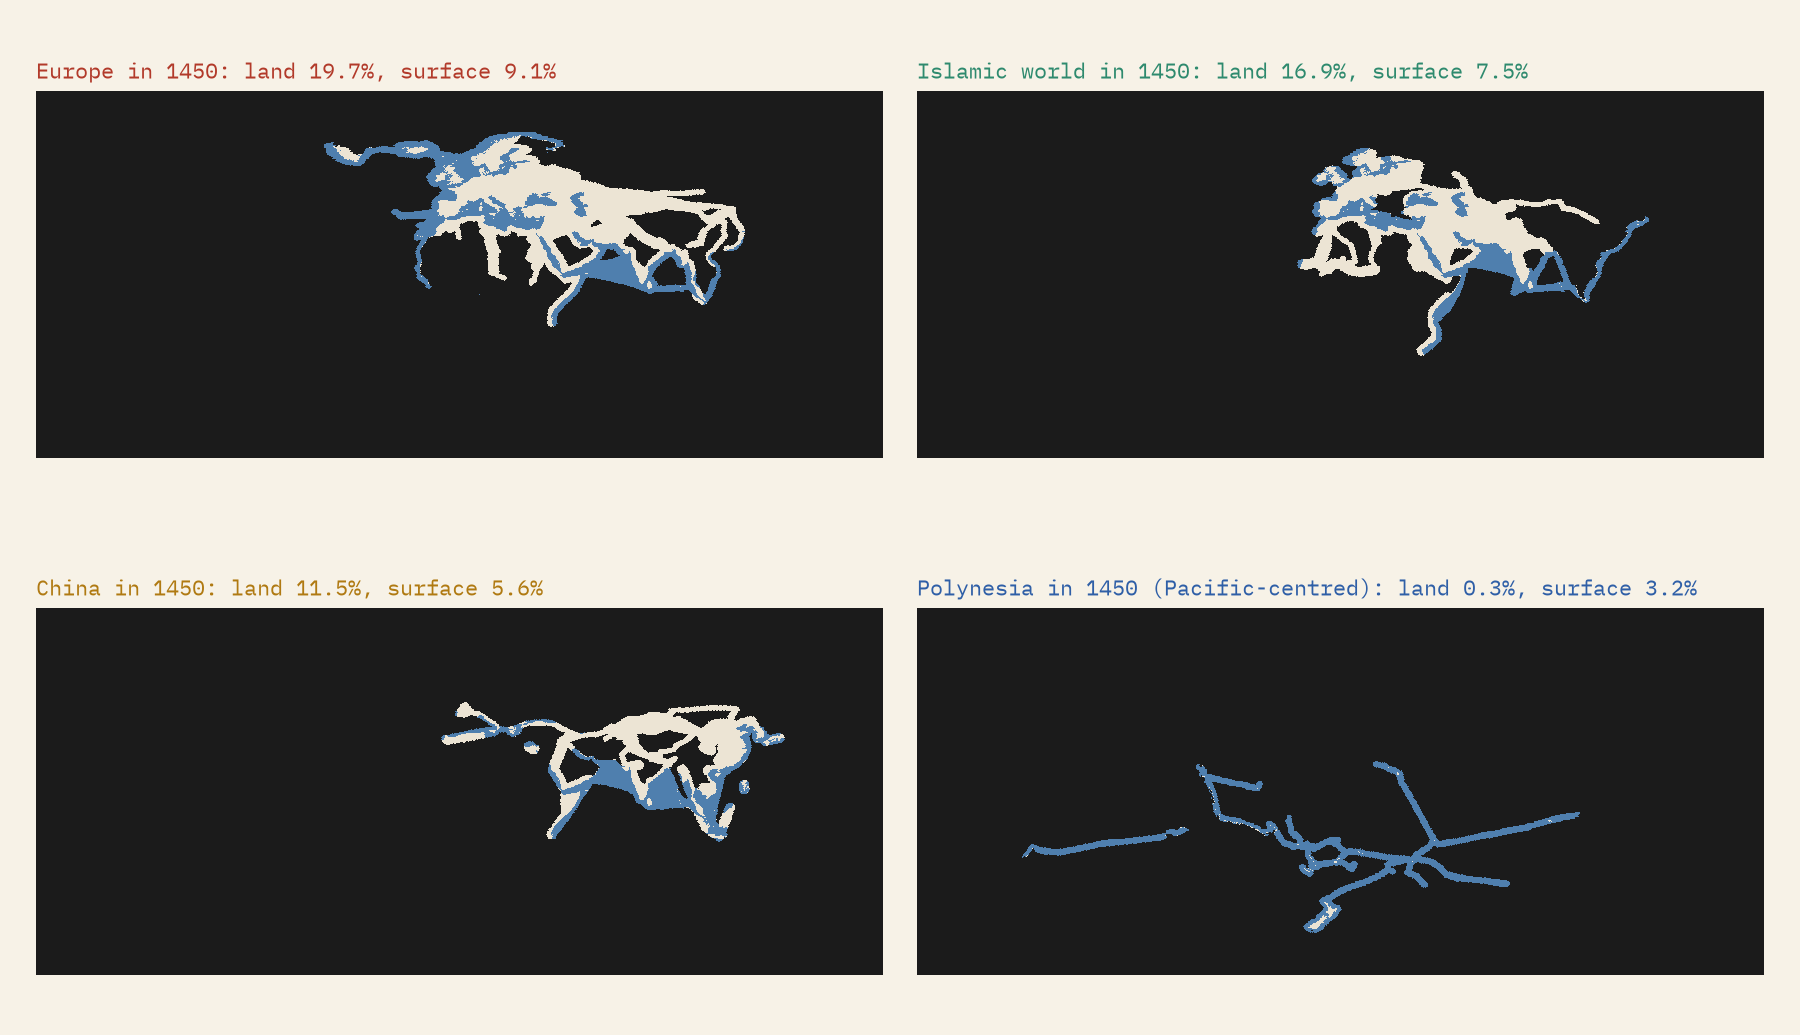
Switch the point of view and the world changes shape. The Islamic world’s geographers and travellers, al-Masudi, al-Biruni, al-Idrisi, Ibn Battuta, recorded 17% of the land by 1400, from al-Andalus to China and down the Swahili coast. China’s envoys, pilgrims and fleets, from Zhang Qian to Zheng He, reached 12% by 1492. Polynesian voyagers, dated here by archaeology rather than writing, lit 3.2% of the whole Earth’s surface by 1400, nearly all of it ocean.
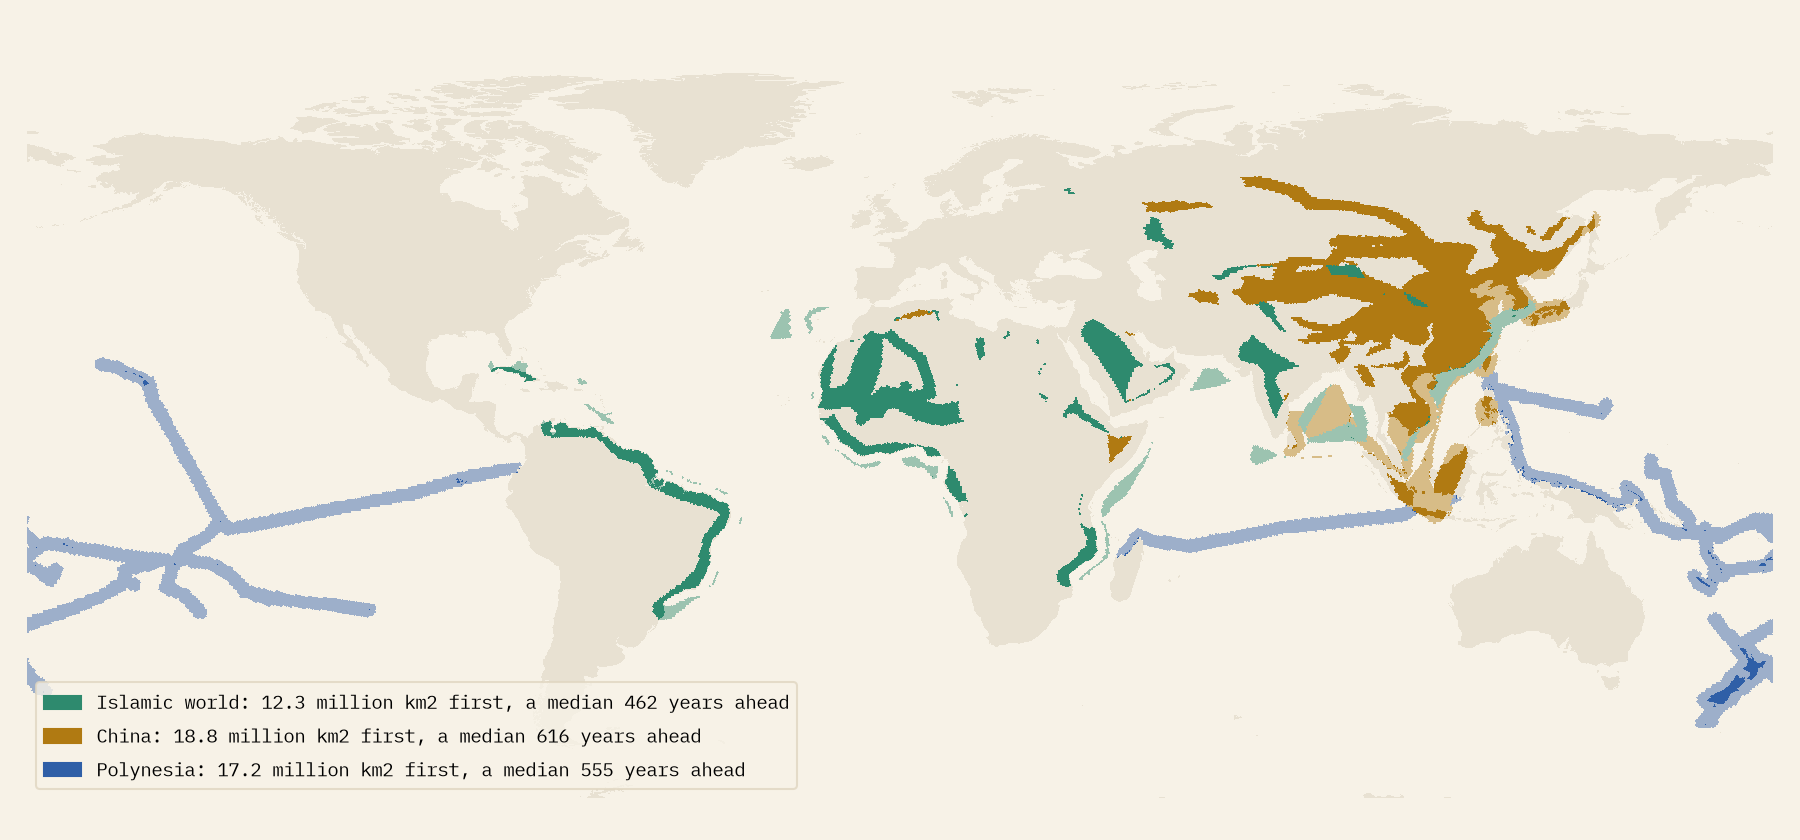
Much of what was dark for Europe had been written down, or settled, elsewhere long before. China recorded 18.8 million km² before Europe did, a median 616 years earlier. Polynesians settled Hawaii around 1219, more than five centuries before Cook arrived in 1778, and Aotearoa New Zealand around 1281, against Tasman’s sighting in 1642.
Why the map never goes fully light
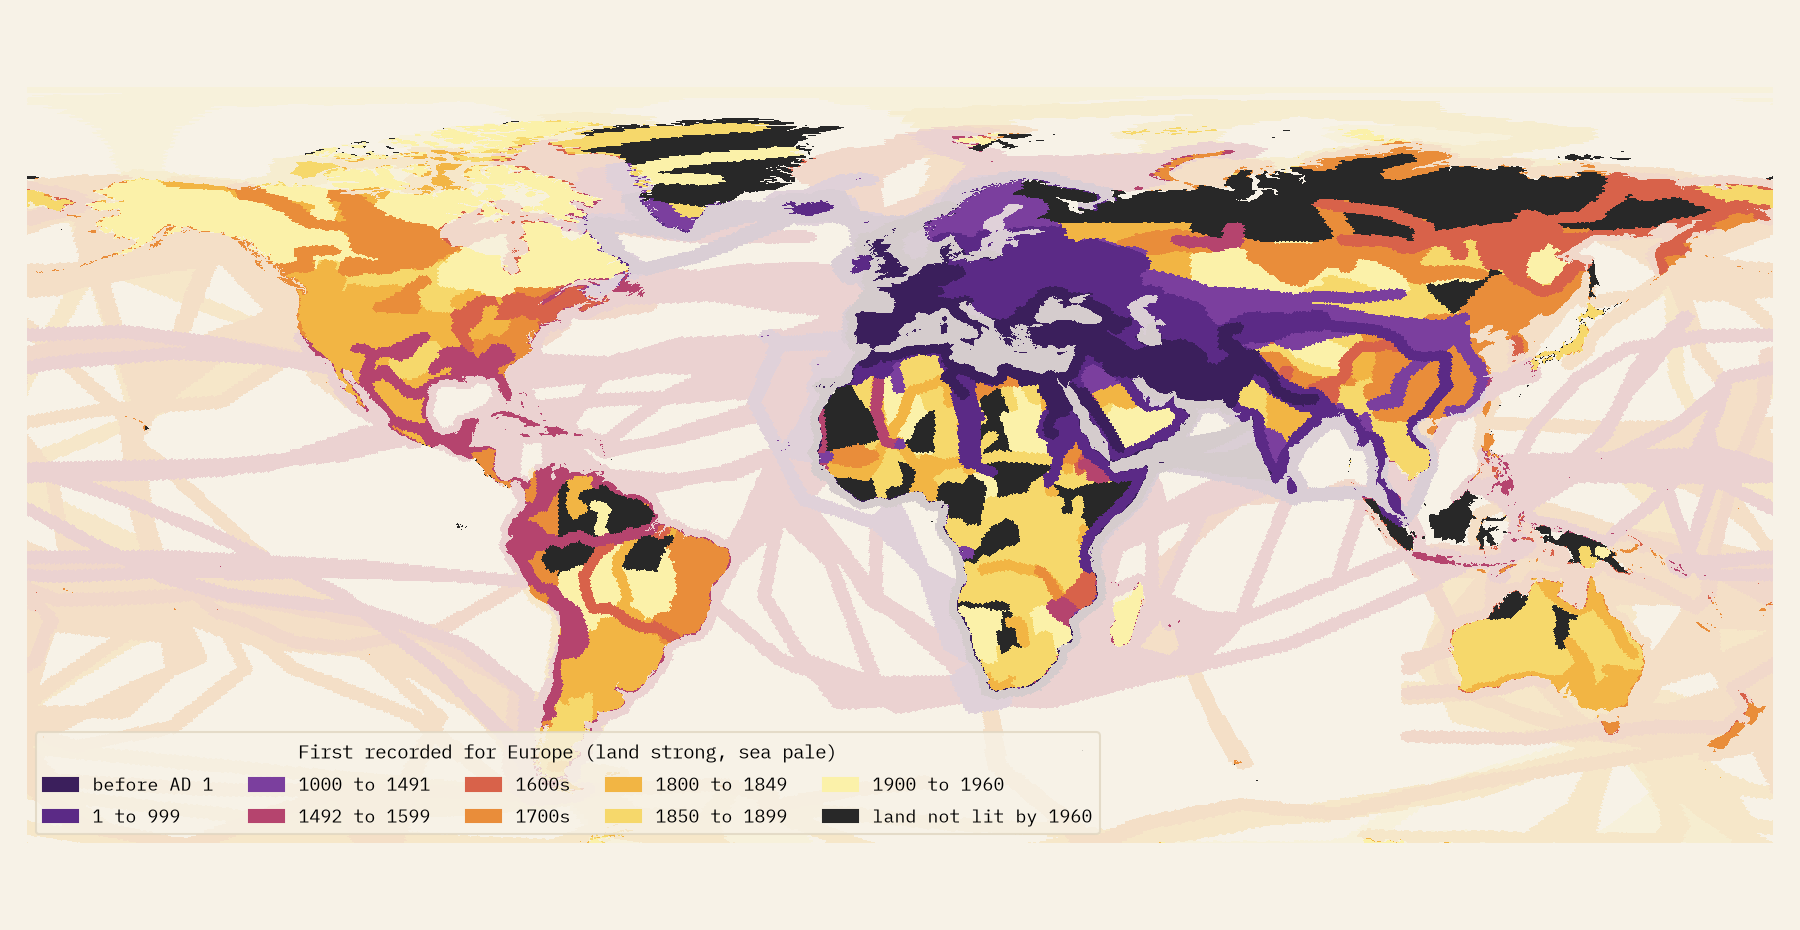
By 1960, 80% of the land is lit for Europe. The rest is not unknown land. Some is Antarctica, 10.4 million km² of it still unseen. Much is land that neither a journey in my gazetteer nor my deliberately coarse survey layer reaches: parts of the Sahara and the Sahel, central Africa, the outer islands of Indonesia, the Amazon and the Greenland ice. Read the late years as a lower bound.
How I did this
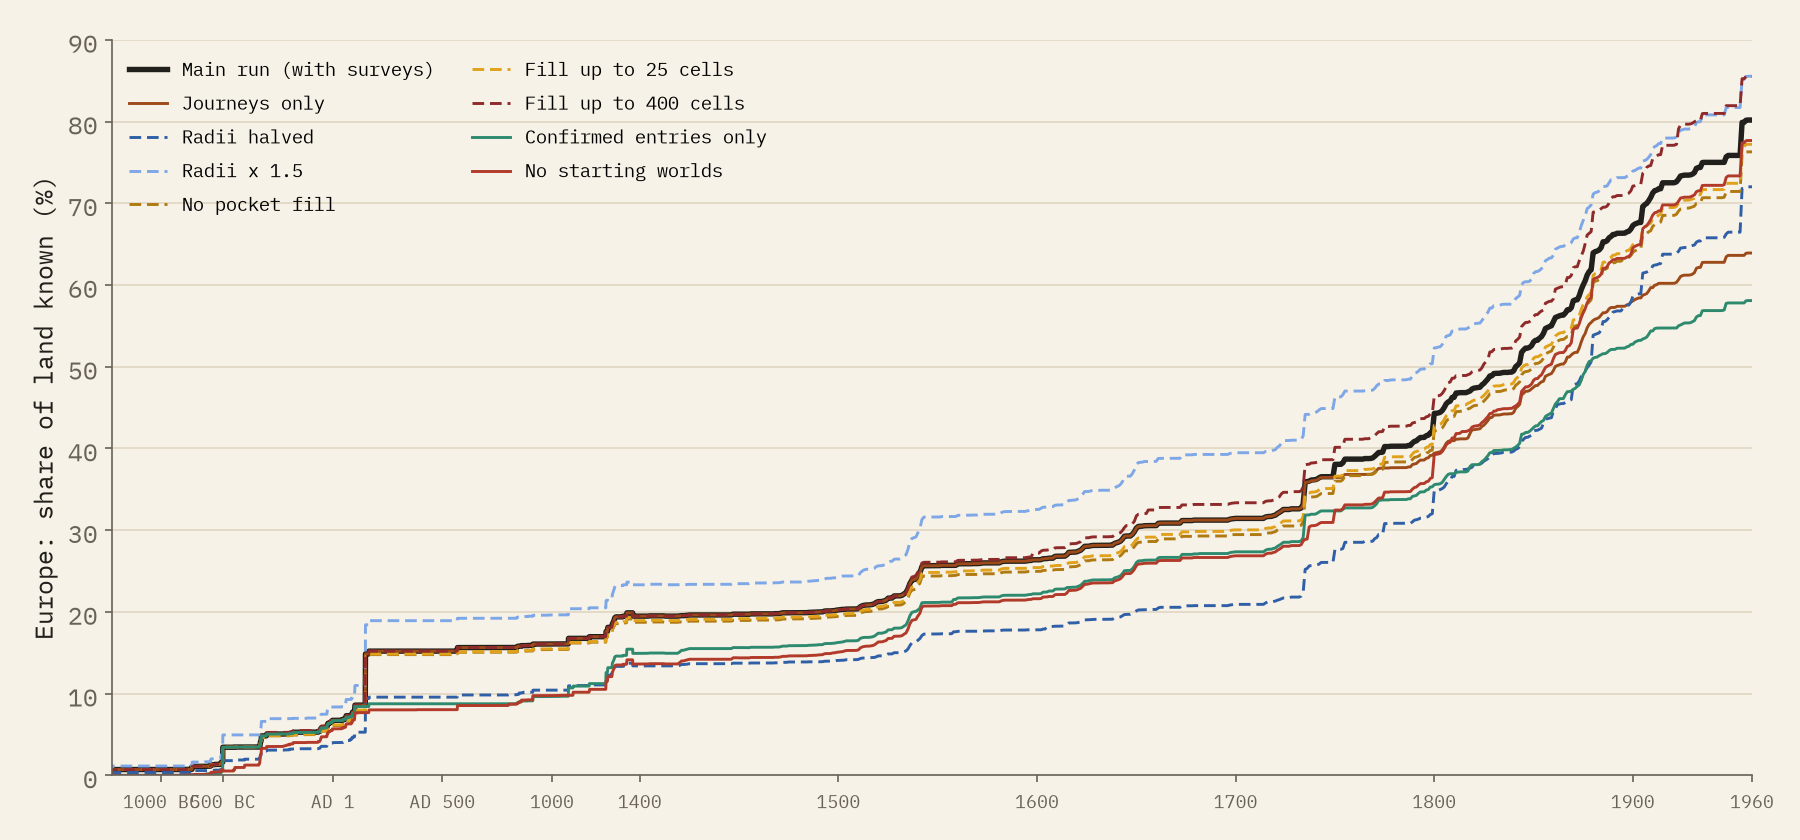
Each journey has a leader, years, a mode and a route of dated waypoints, compiled mostly from Wikipedia and the accounts it cites. I split the Earth into 288,122 equal-area hexagons. A ship lights open sea 150 km either side and coast 40 km inland; an overland route lights 120 km either side, in the year it passed. Small pockets fully ringed by known ground fill in, and knowledge that was lost, like Vinland, goes dark again. The survey and settlement regions are lit whole, in a year I chose from the history of cartography; those dates are marked as not confirmed. Every journey carries a source status: 27% have their years confirmed in the cited article by an automatic check, and only 2.5% have a source I could not confirm. The distances are a choice, so I varied them: Europe’s 1960 figure ranges from 58% to 86%, but the shape of the story, the long pause, the sea first, the nineteenth-century surge, is the same in every version.
Notes and sources
- The journeys: a gazetteer of 681 routes compiled for this study, mostly from English Wikipedia (CC BY-SA 4.0) and the accounts it cites; sources are given for each journey on the interactive page and in the data.
- Natural Earth land, Antarctic ice shelves, countries and places (public domain); the H3 hexagonal grid (Apache 2.0).
- Inspired by the animation “World exploration from Europe’s point of view”, widely shared on Reddit.
- I wrote the text, with drafting and editing assistance from Claude (Anthropic), which also helped prepare the analysis code. I reviewed and checked all text and results.

