
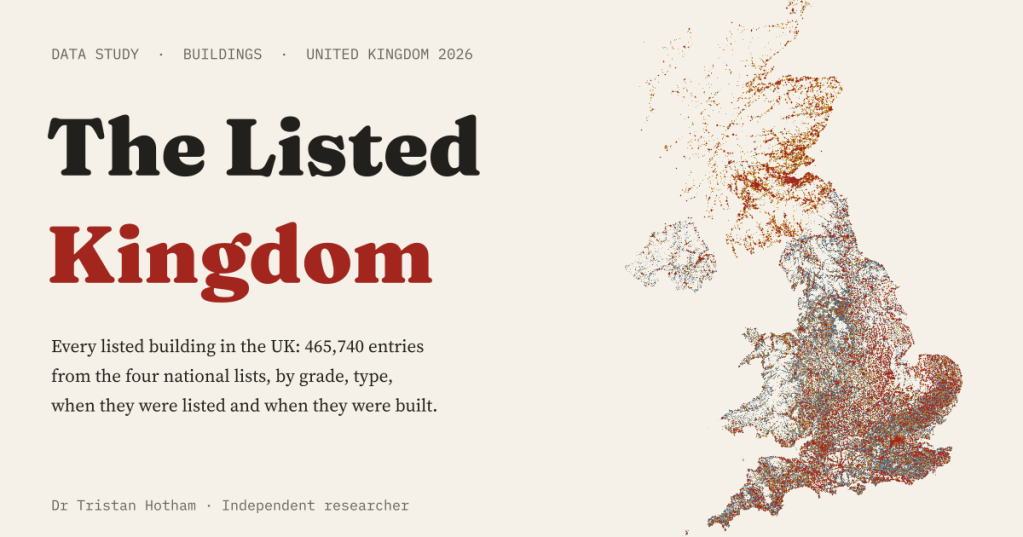
The UK keeps four lists of buildings worth saving. Together they hold 465,740 entries. I put every one of them on one map, read their names to see what they are, and read their official descriptions to see when they were built.
Somebody decided each of these was worth keeping. Since the late 1940s the nations of the UK have listed buildings of special architectural or historic interest, and a listed building cannot be knocked down or much altered without consent. Historic England, Cadw in Wales, Historic Environment Scotland and Northern Ireland’s Department for Communities each publish their list as open data. What the files do not say is what each building is, or when it was built. Those things are in the words.
So I read them. Each entry’s name says, more often than not, what it is: a barn, a church, a telephone kiosk. Each entry’s official description usually opens with its date: “Farmhouse. Late C17.” I read the description of every one of Wales’s 30,110 entries, and random samples of 5,000 in England and 2,000 in Scotland. Northern Ireland’s record gives its own date bands.
Half a million dots
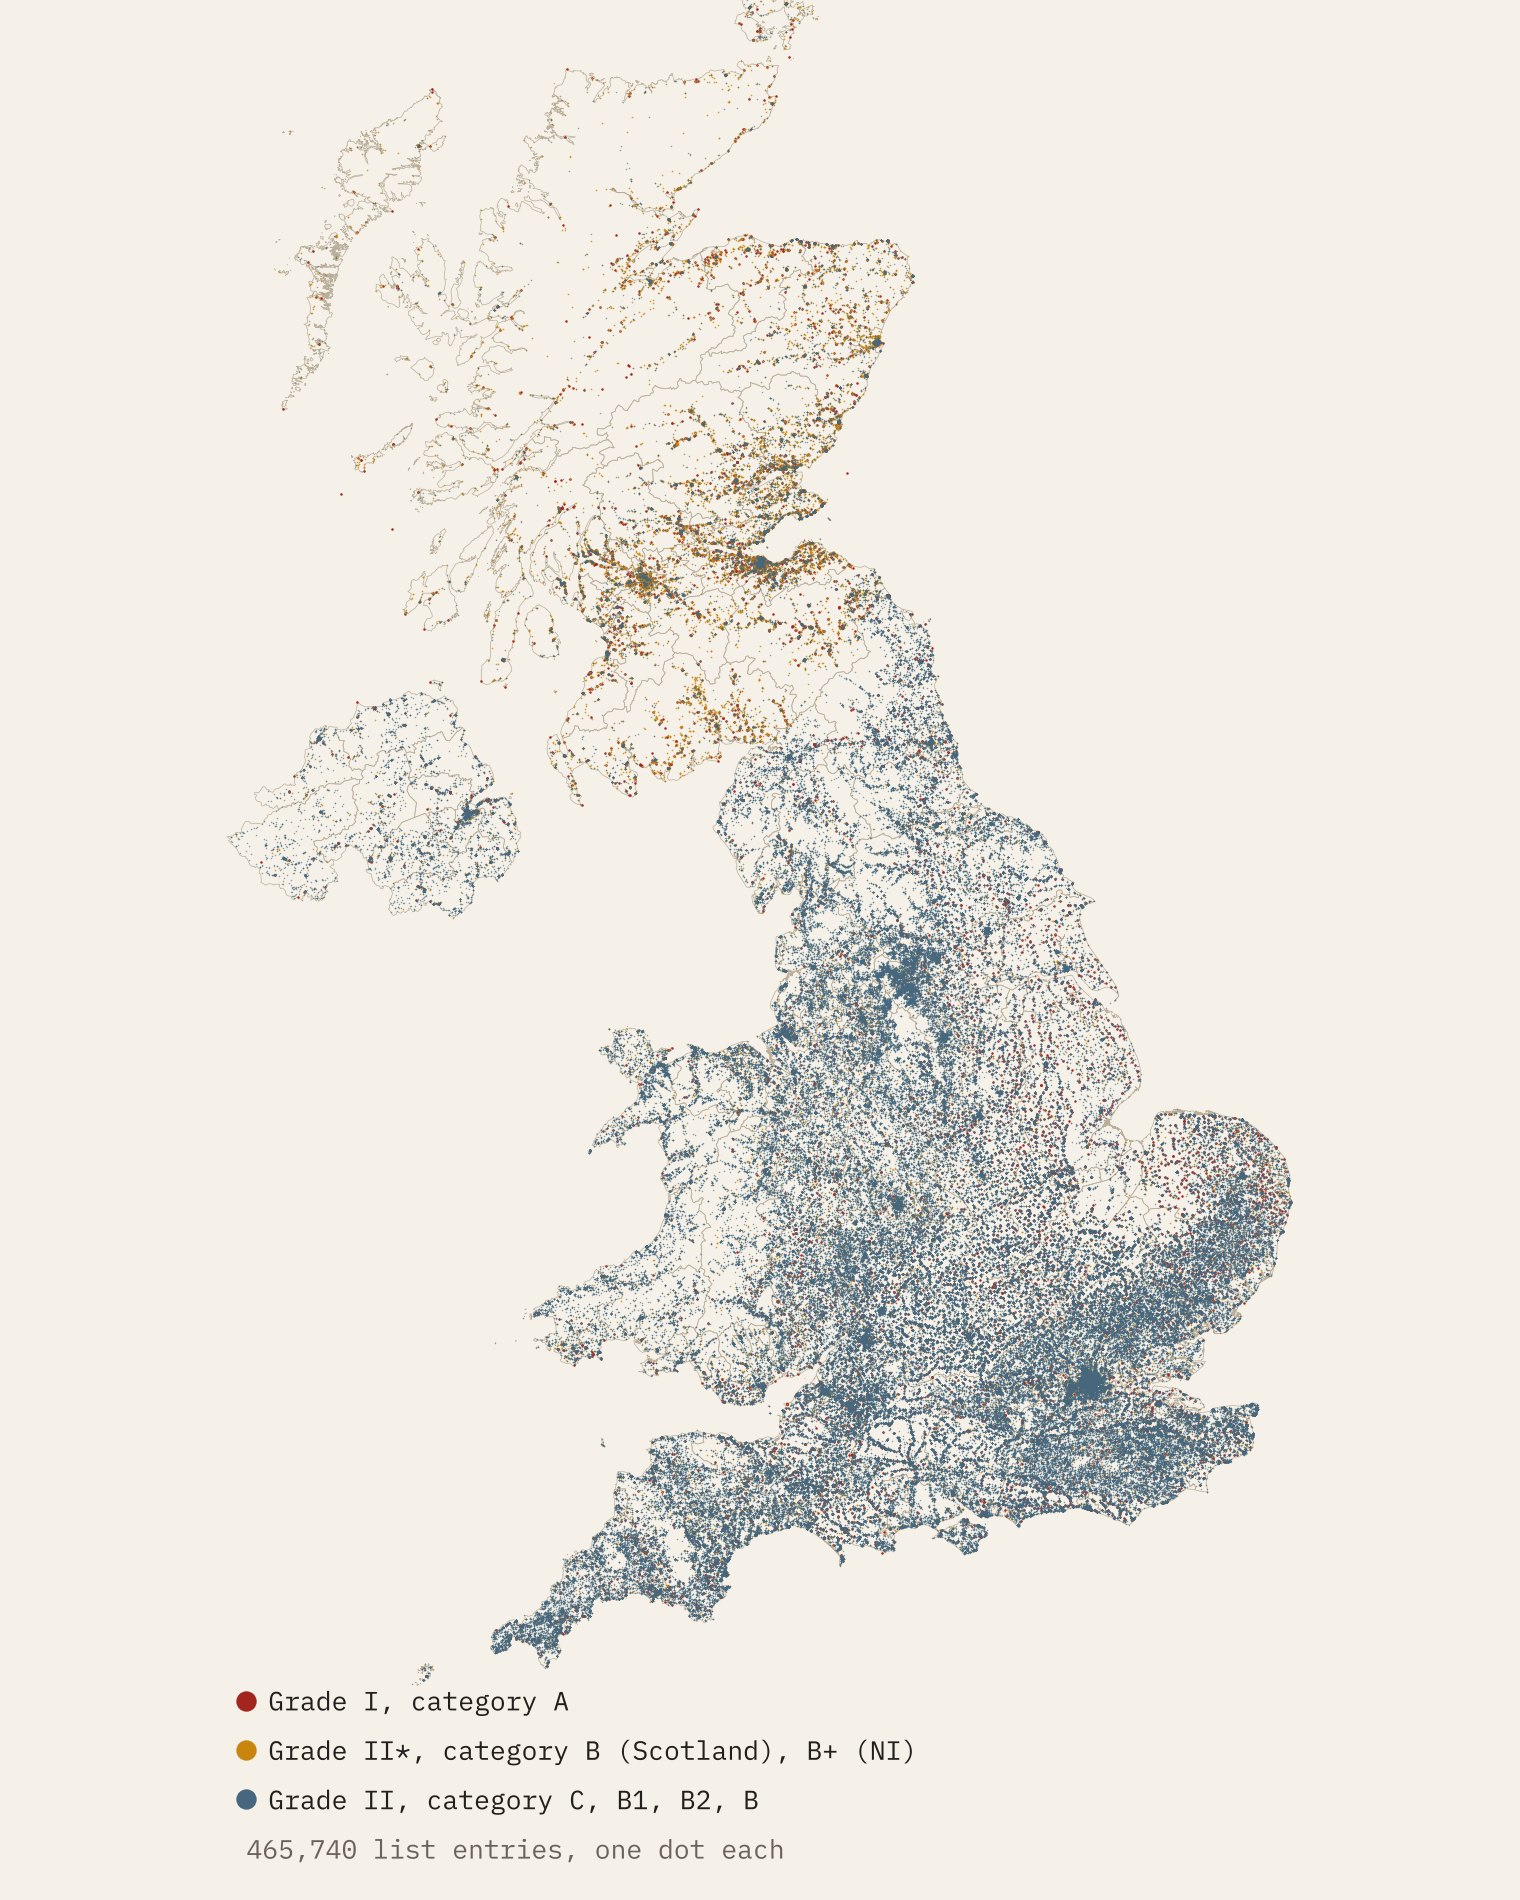
There are 465,740 entries in all, about 6.7 for every 1,000 people. An entry is not always one building: it can be a whole terrace or a single gravestone. Wales has the most per person (9.5 per 1,000), then Scotland (8.4), England (6.5) and Northern Ireland (4.8).
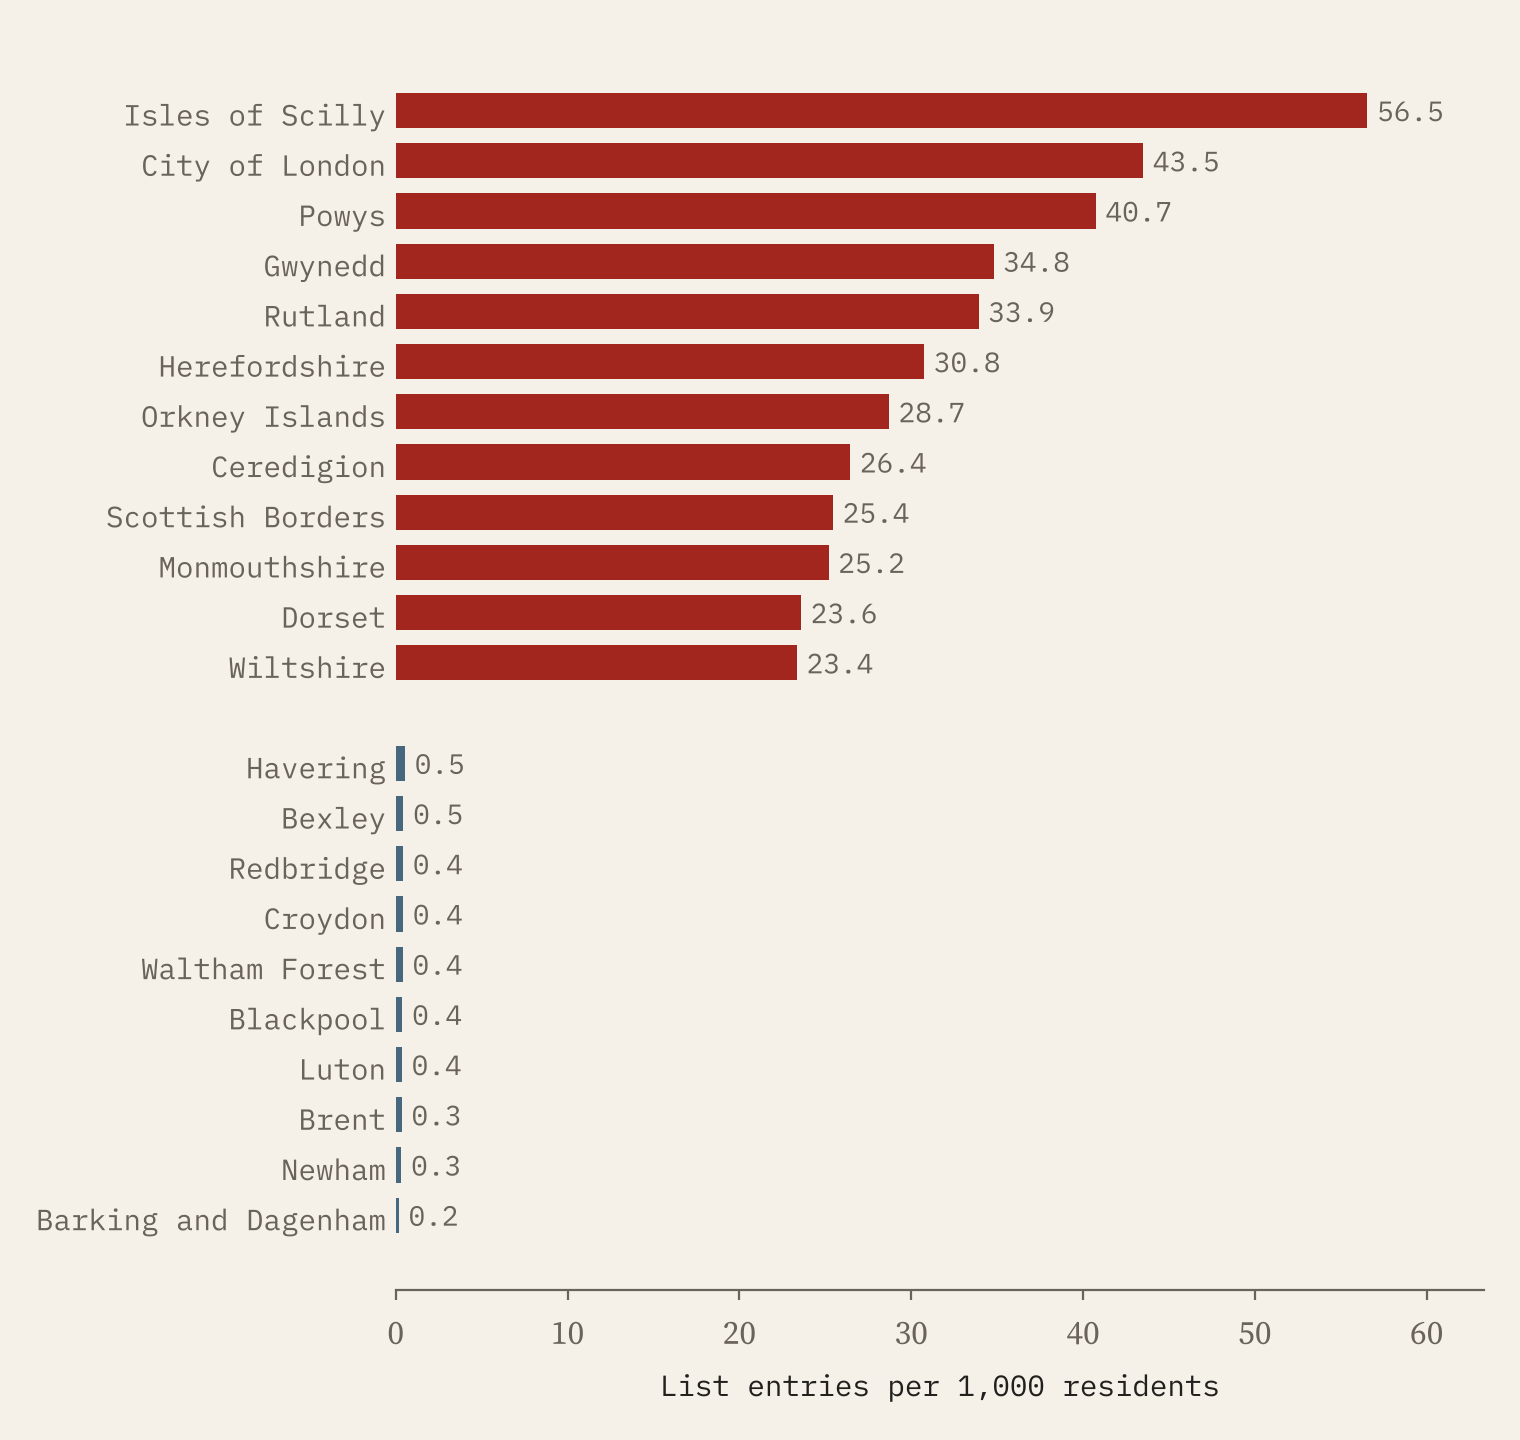
Among counties and unitary authorities, the tiny populations of the Isles of Scilly (56.5 per 1,000) and the City of London (43.5) put them on top. Next come rural Wales and the Marches: Powys (40.7), Gwynedd and Rutland. At the bottom are outer London boroughs and twentieth-century towns: Barking and Dagenham has 0.18 entries per 1,000 residents.
Towns tell the same story at a finer grain. Among towns of 10,000 people or more in England and Wales, Ludlow comes first with 40.7 entries per 1,000 residents, then Sherborne, Whitby and Monmouth. Among bigger places, Bath leads. In small places the numbers get silly: Aberaeron, a small harbour town of about 1,268 people, has 246 entries.
Houses, barns and a great many churches
Read by their names, 31.4% of entries are houses and cottages, 6.8% barns and farm buildings, 6.7% churches and chapels and 6.2% walls, gates and railings. About a quarter have names that do not say. And there are oddities by the thousand: 2,626 telephone kiosks, 4,860 milestones and mileposts, 4,874 war memorials.
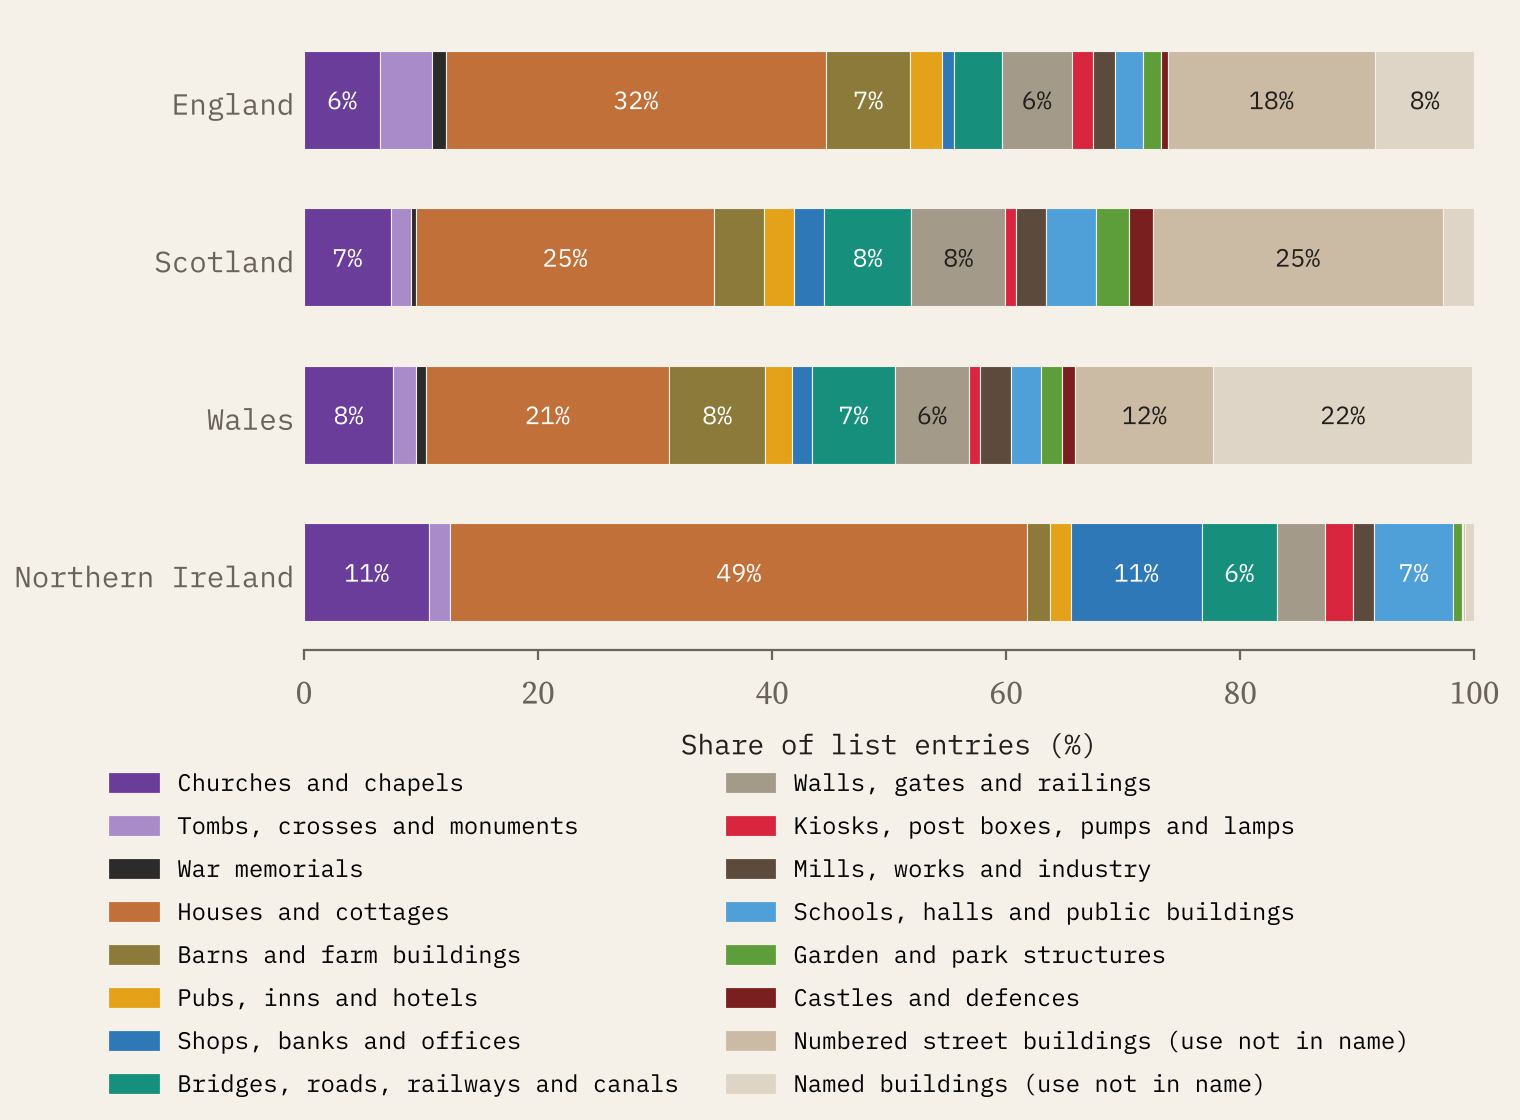
The top grade is another world. Only 2.9% of all entries are in it. In England, 54% of Grade I entries are churches and chapels. In Wales castles make up 17% of Grade I. Scotland’s category A is led by houses.
In England, 54% of Grade I entries are churches and chapels.
Georgian and Victorian, mostly
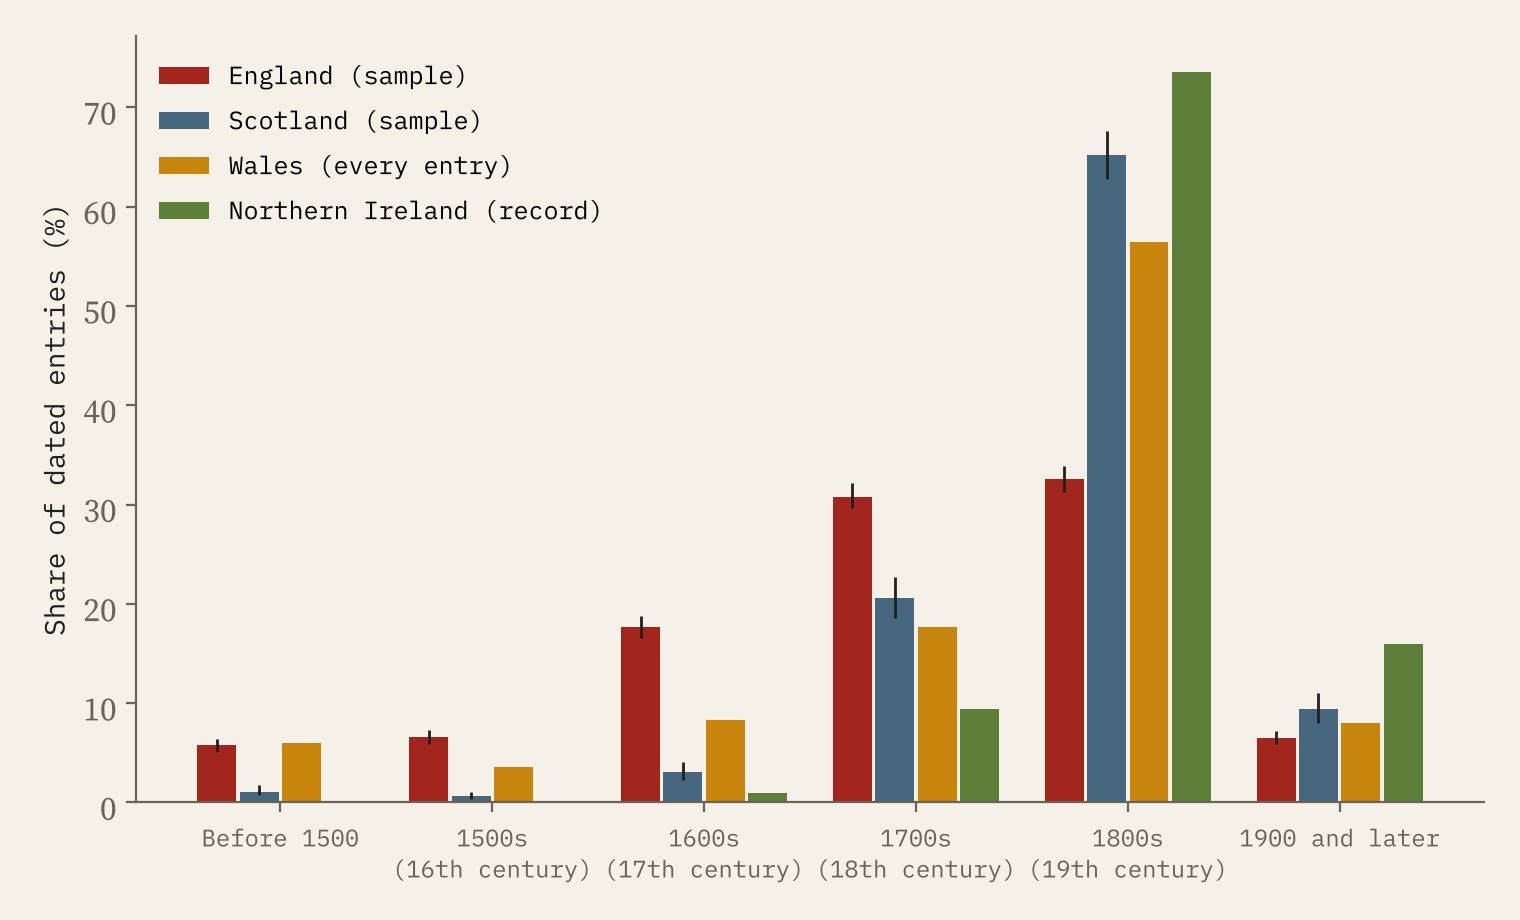
The listed UK is mostly from the 1700s and 1800s. In England’s sample, 31% of dated entries were built in the 1700s and 33% in the 1800s; 18% in the 1600s and 6% before 1500. England’s list is the oldest of the four. Wales has a similar share from before 1500 but many more from the 1800s (56%). Scotland’s is younger again (65% from the 1800s) and Northern Ireland’s youngest (74%).
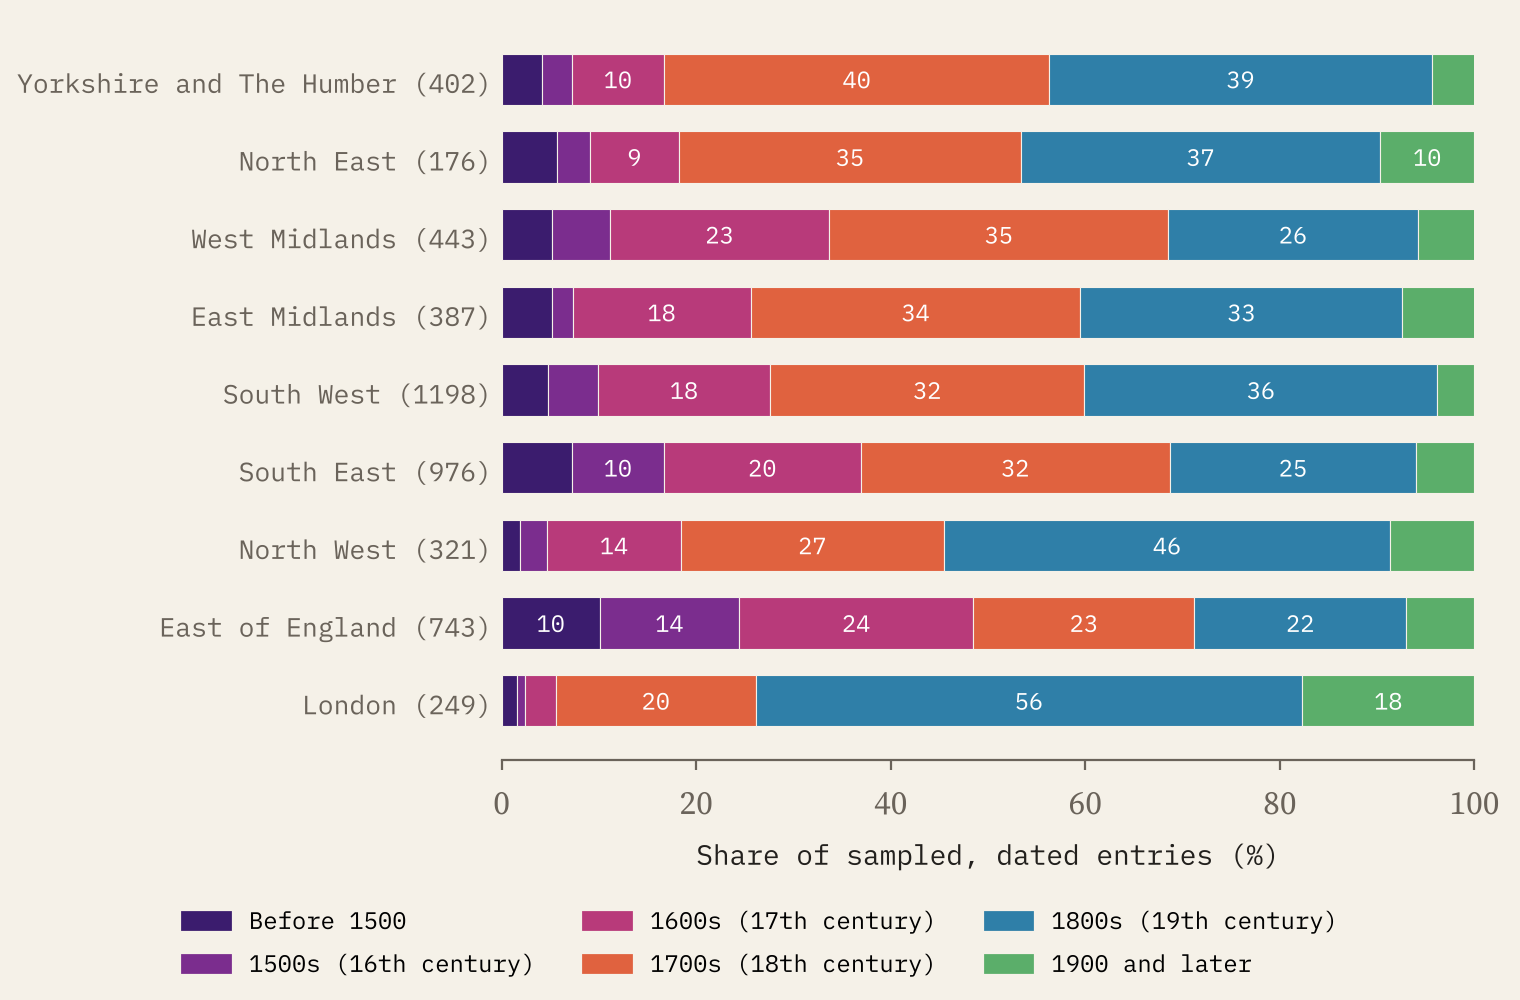
Inside England the oldest stock is in the east. In the East of England, 10% of sampled entries date from before 1500 and 14% from the 1500s. London’s are the youngest: 56% from the 1800s.
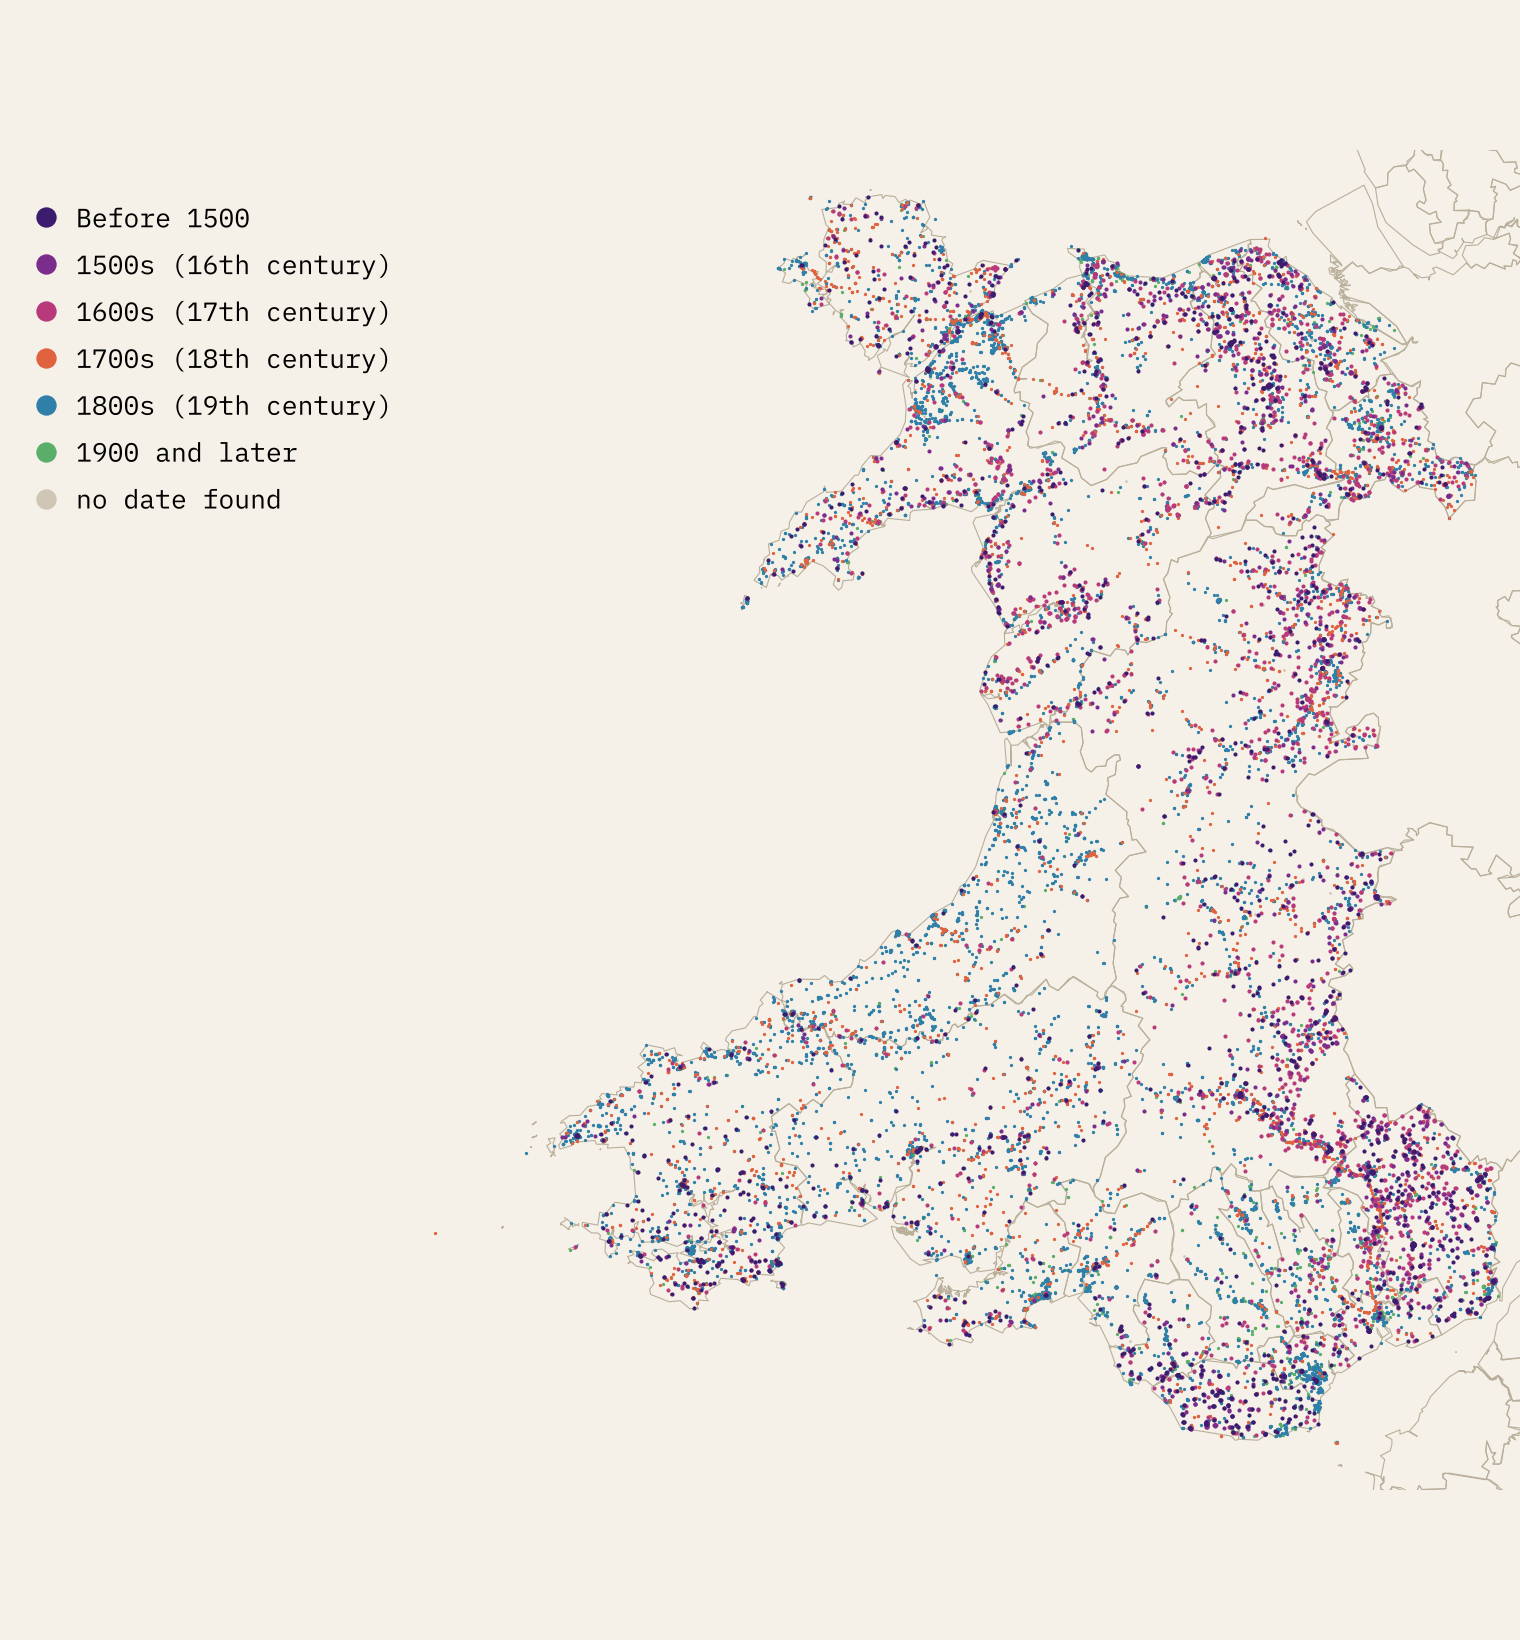
Wales is the one place where I could date every entry, so it can be mapped in full. Entries with a date before 1500 are commonest in the Vale of Glamorgan (17%) and Monmouthshire (10%); in Ceredigion, in the west, 82% date from the 1800s.
Waves of listing
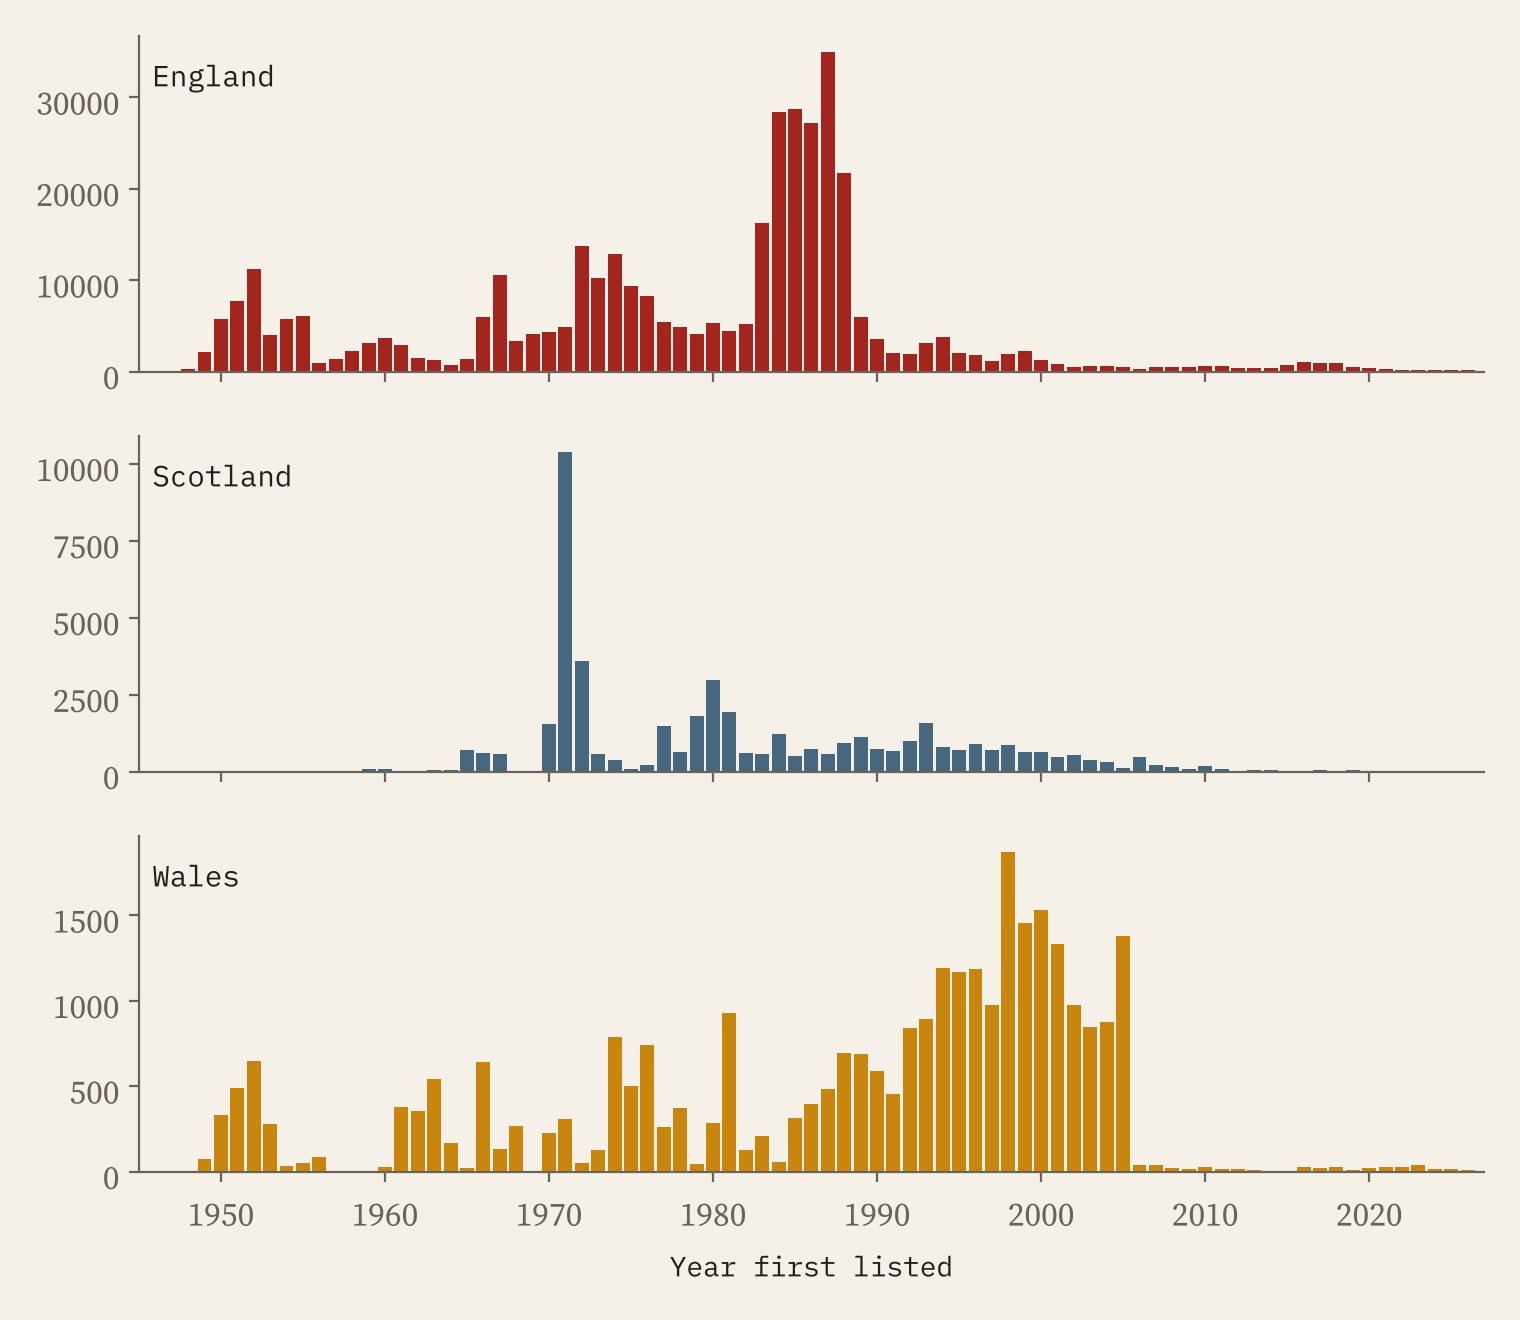
Listing came in waves. 47% of England’s entries were first listed in the 1980s, when the lists were resurveyed parish by parish; the busiest single year was 1987, with 34,953 entries. Scotland’s peak was 1971, Wales’s 1998. The newest wave is war memorials: of the 5,682 entries England has listed since 2015, 2,889 are war memorials, more than half, in the years around the centenary of the First World War.
How I did this
The four lists come from the publishers’ own open data services, all under the Open Government Licence. Types come from simple keyword rules on each entry’s name; where Cadw gives its own class, the rules agreed 71% of the time, so treat them as a guide. Dates come from the first date in each description. I read 120 descriptions to check the rules, and they were right 97% of the time where a date could be judged. The first date is usually the main build; for old churches it is sometimes a saint’s foundation, so I don’t name an “oldest listed building”. Per head figures use ONS, NRS and NISRA populations. For the oldest buildings still standing, see my earlier study Still Standing.
Notes and sources
- Historic England, National Heritage List for England (Open Government Licence v3.0).
- Historic Environment Scotland, listed buildings (Open Government Licence v3.0).
- Cadw, listed buildings on DataMapWales and full reports (Open Government Licence v3.0).
- Department for Communities, Historic Environment Division, Historic Buildings Record via OpenDataNI (Open Government Licence v3.0).
- ONS boundaries, built-up areas, Census 2021 and mid-year estimates; NRS and NISRA population estimates (Open Government Licence v3.0). Wikidata inception dates (CC0).
- I wrote the text, with drafting and editing assistance from Claude (Anthropic), which also helped prepare the analysis code. I reviewed and checked all text and results.

