
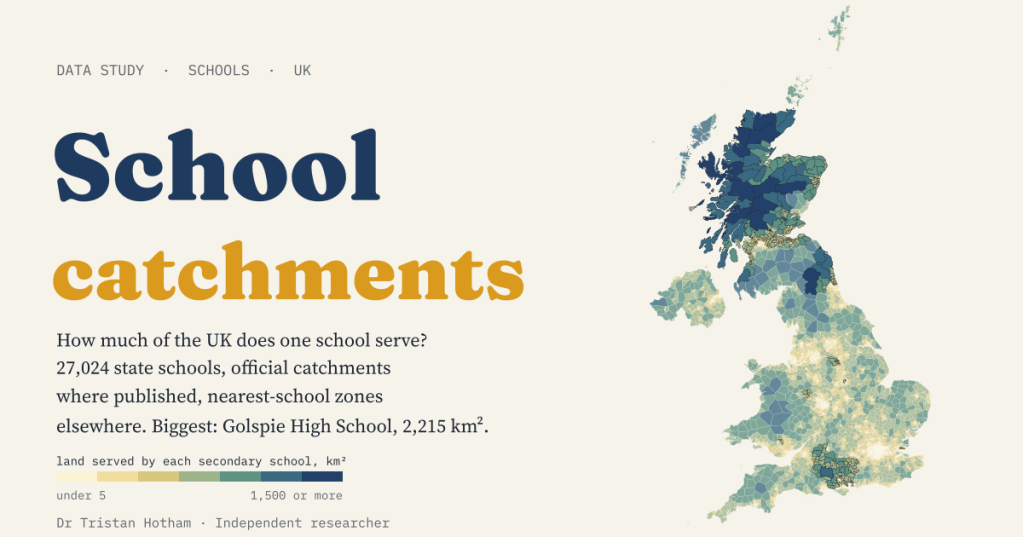
There is no map of school catchments for the UK. So I made the nearest thing: every one of the UK’s 27,024 state schools, the official catchments of the 33 councils that publish them openly, and the patch of land nearest to each school everywhere else.
“Are we in the catchment?” is one of the first questions any parent asks about a school. The answer depends enormously on where you live. In a city a primary school might serve a few hundred metres of streets. In the far north of Scotland a single high school can be responsible for a slice of moor, mountain and coast bigger than an English county. I wanted to see that whole range on one map.
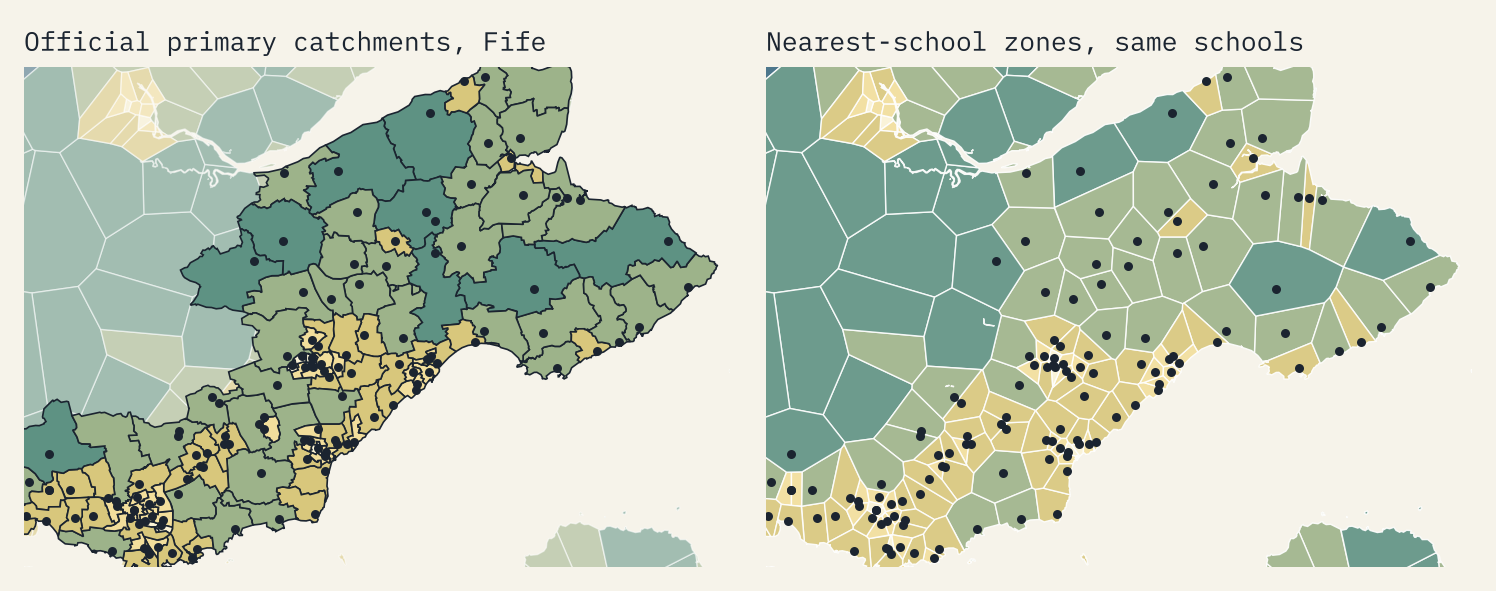
The trouble is that nobody publishes a UK catchment map. Scotland’s councils draw a catchment for almost every school, but England, Wales and Northern Ireland have no national set. Many English councils have no catchments at all, and Northern Ireland admits pupils by each school’s own criteria. So my map does two things. Where a council publishes its catchments as open data, I show them: 2,992 areas from 33 councils, 21 of them Scottish. Everywhere else I draw nearest-school zones: the land that is closer, as the crow flies, to one school than to any other. They are a yardstick, not catchments, and the map marks them differently.
From a few streets to a county
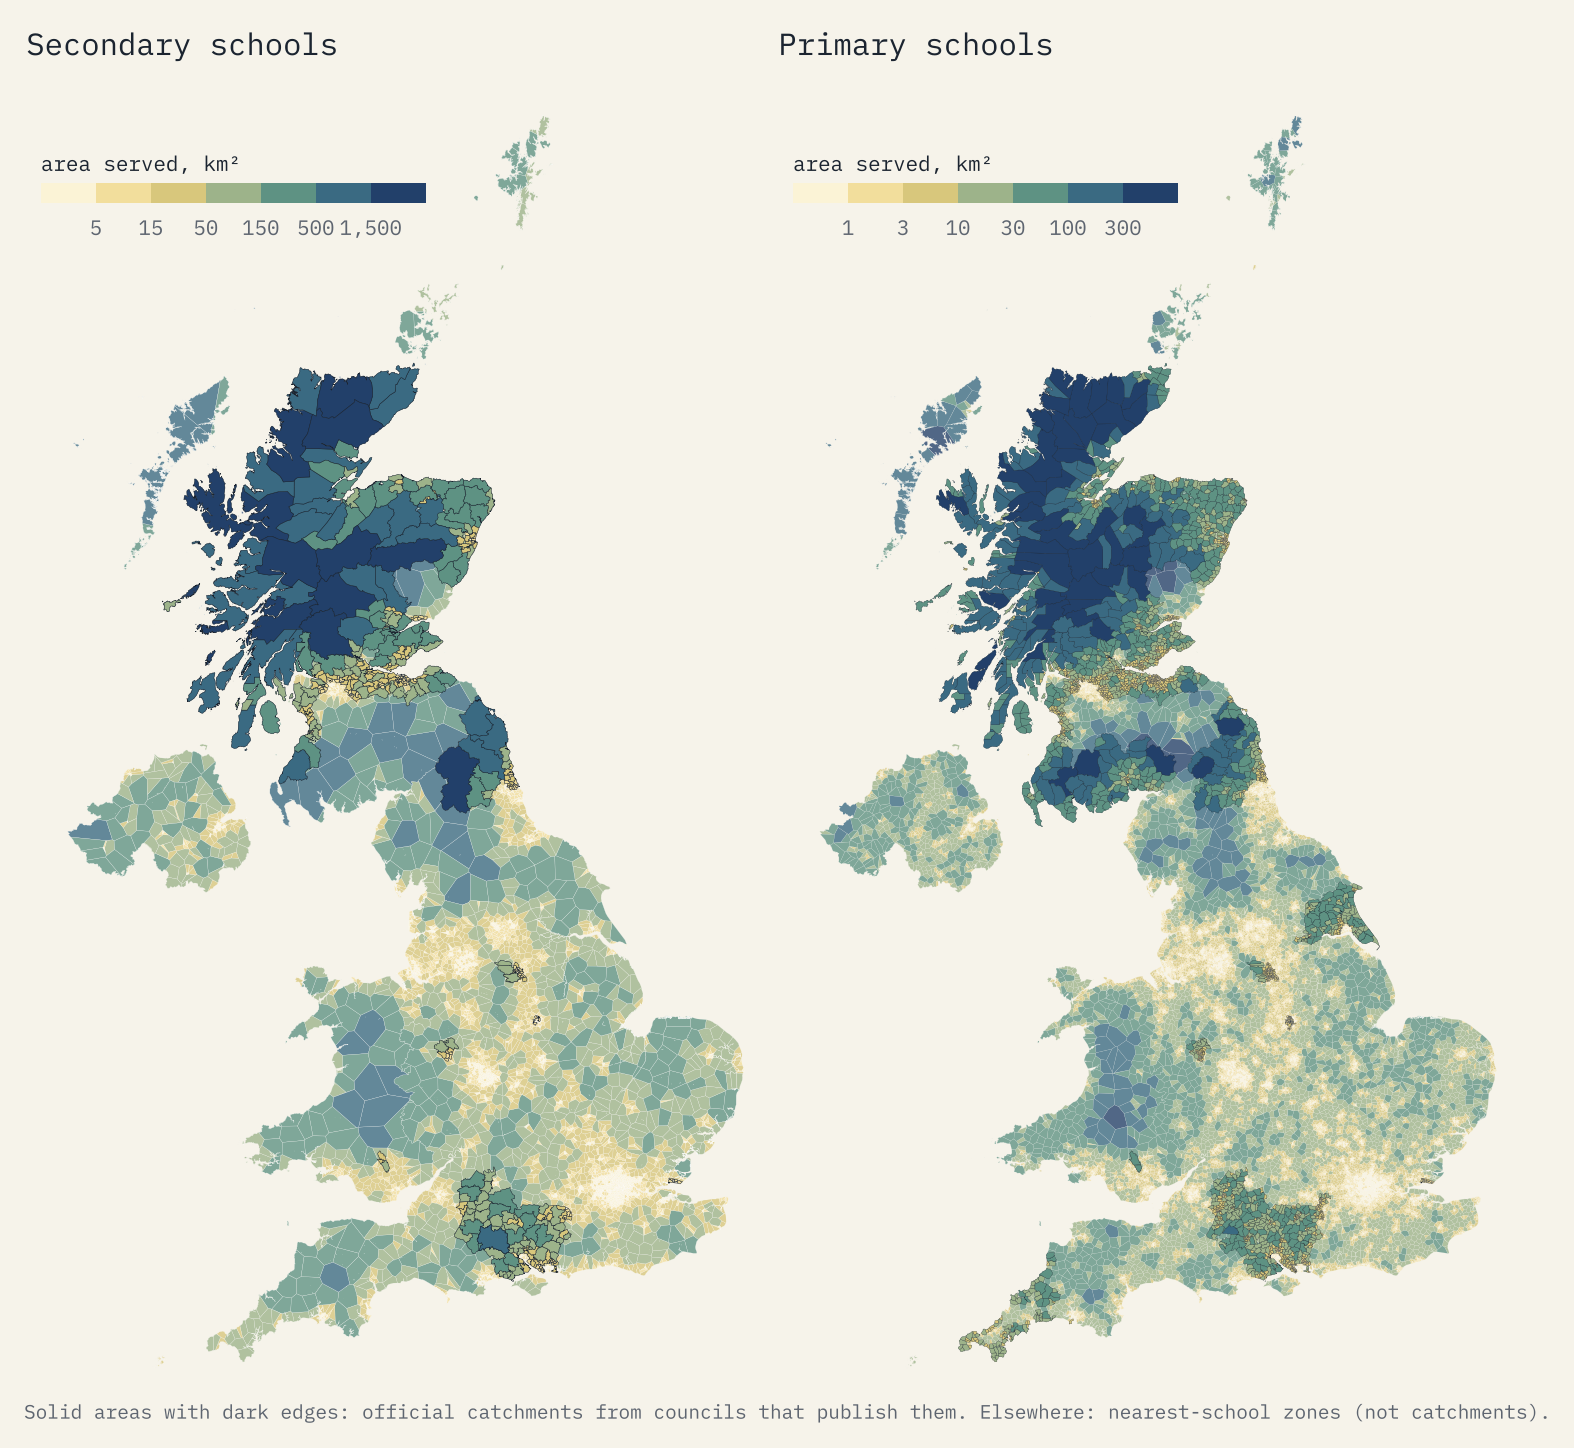
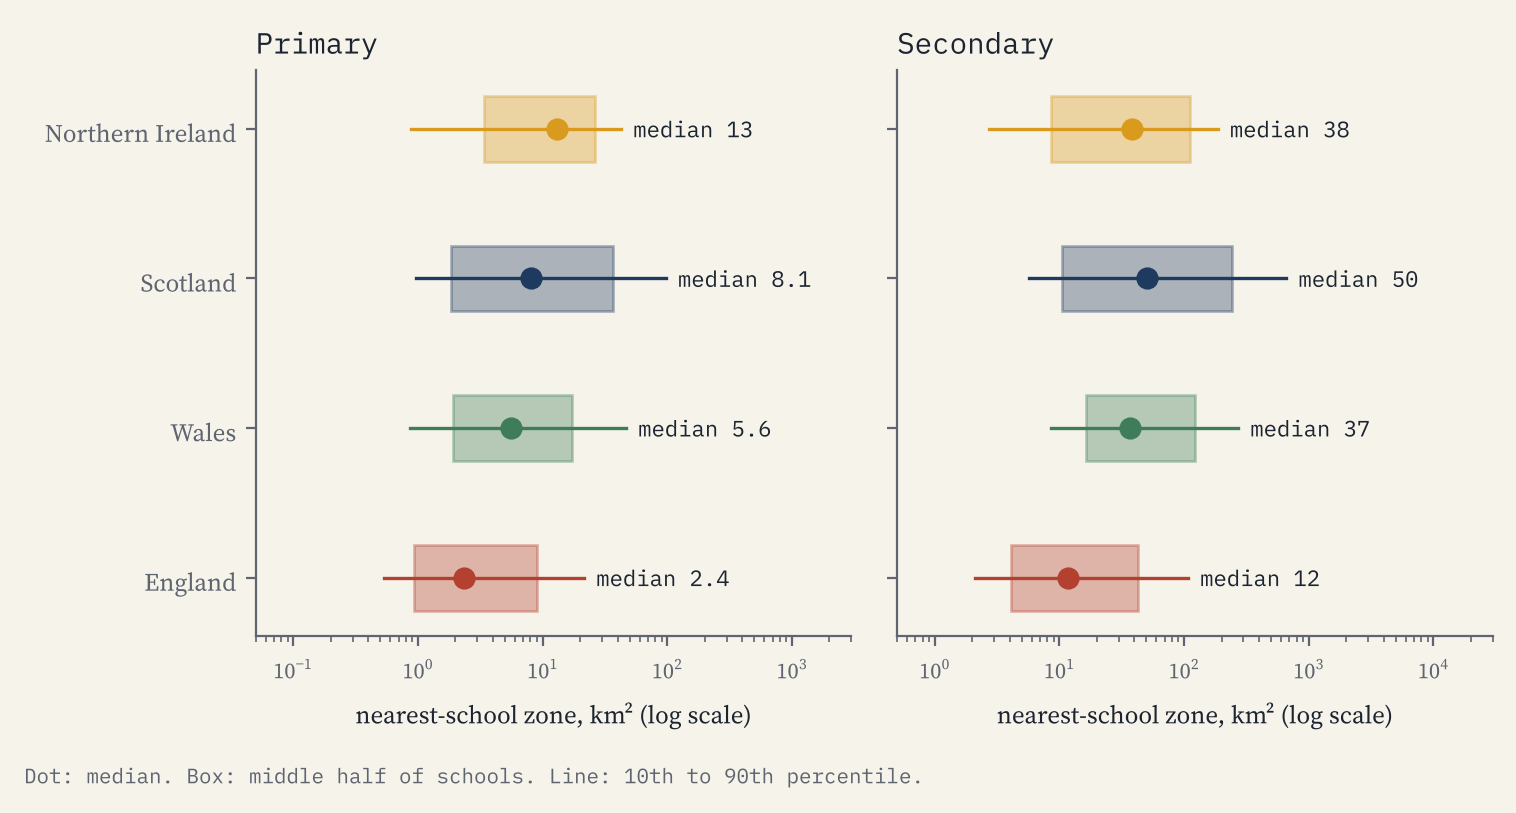
The pattern is what you would expect, but the scale is startling. The median nearest-school zone for an English primary is 2.4 km². In Scotland it is 8.2 km², and for Scottish secondaries 50 km². 53% of Scotland’s land is more than 5 km in a straight line from a primary school; in England it is 6%.
The biggest catchments
Every one of the biggest official catchments I found is in the Highlands and Islands. Golspie High School, on the east coast of Sutherland, has a catchment of 2,215 km² for its 264 pupils. That is bigger than the whole of Herefordshire (2,180 km²). Lochaber High School serves 2,048 km² and Ullapool High School 2,031 km². The biggest primary catchment is Ullapool Primary School’s, at 986 km².
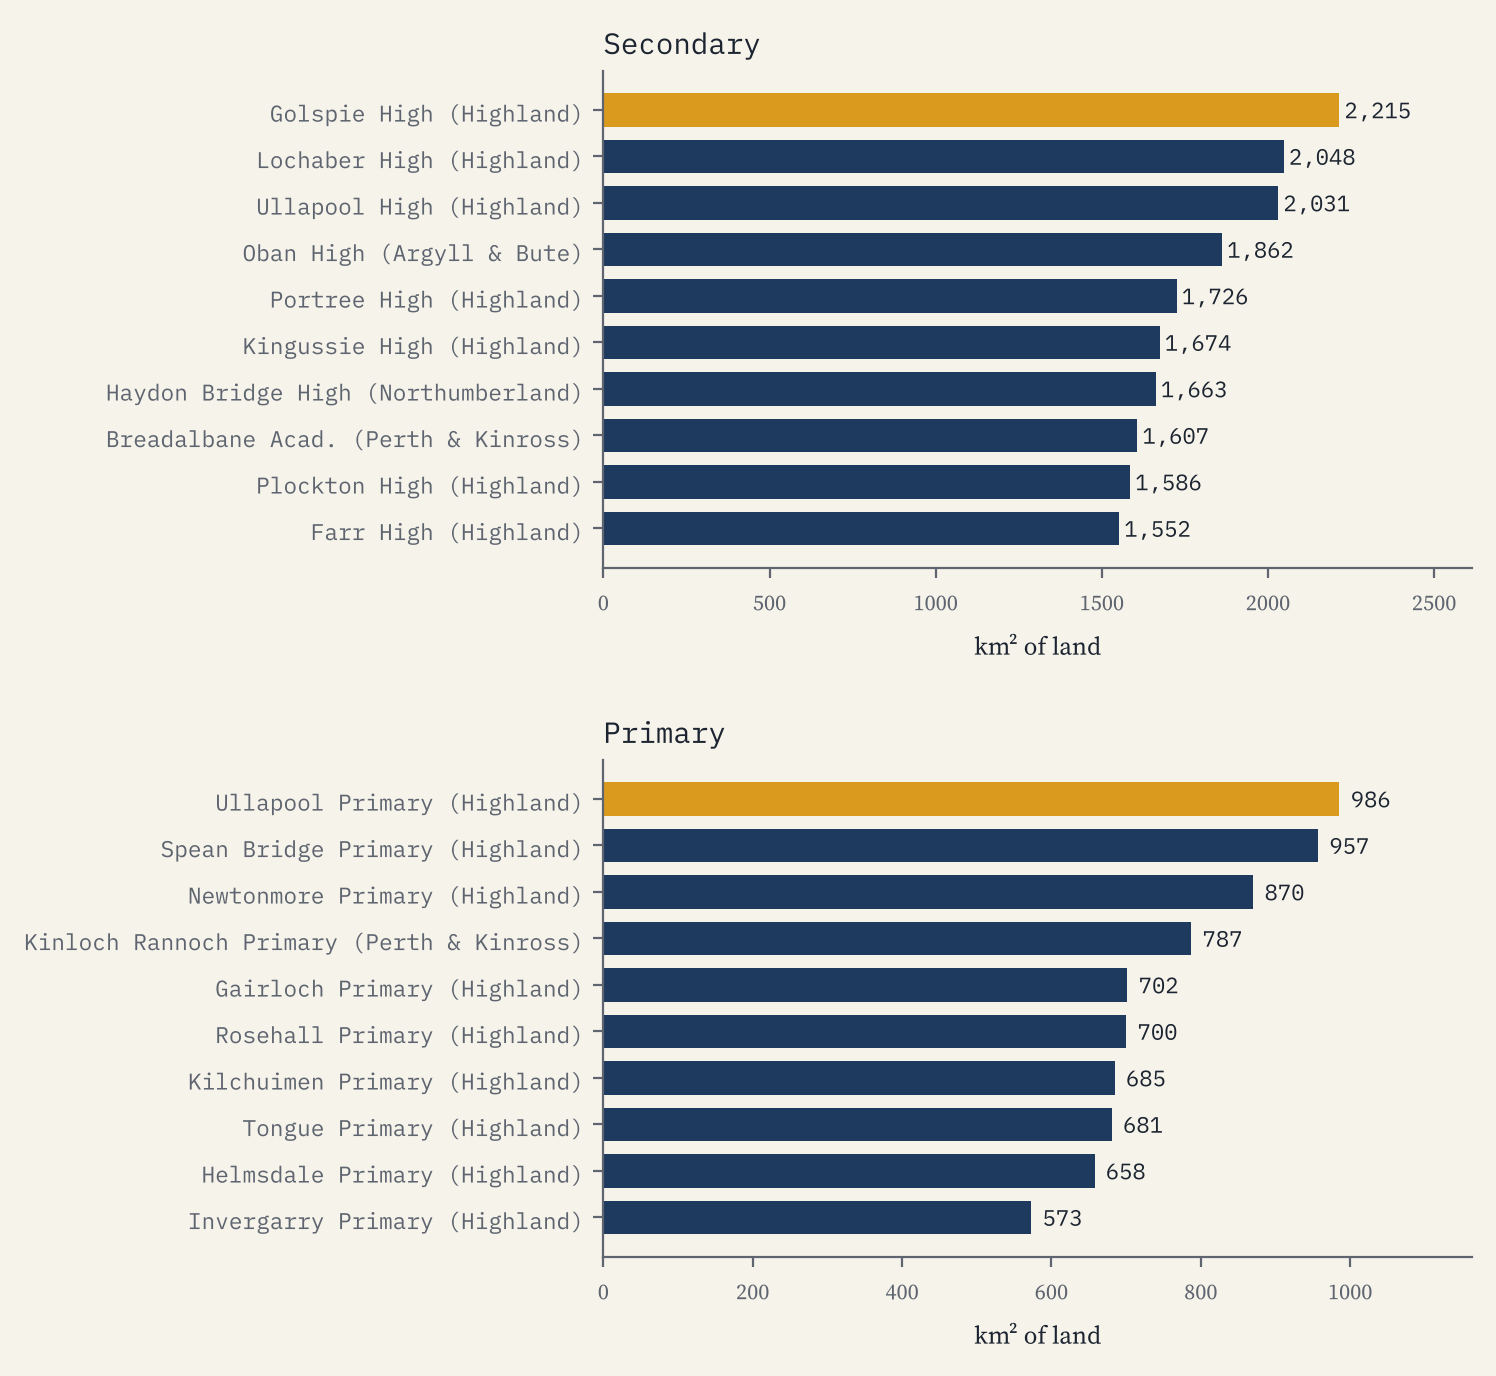
England’s biggest official catchment in my set is Haydon Bridge High School in Northumberland, at 1,663 km². England’s biggest primary zone belongs to Kielder Primary School and Nursery, in the forest beside Kielder Water: 298 km² of land for 10 pupils.
Small schools, big patches
Land and pupils pull in opposite directions. Half of Scotland’s primaries have 176 pupils or fewer, against 225 in England, and 176 Scottish primaries have fewer than 25. At the other end of the scale, the biggest state secondary in the UK is Brampton Manor Academy in Newham, with 2,987 pupils, and the biggest primary is Claycots School in Slough, with 1,605.
How far is it to school?
I measured the straight-line distance from each of Great Britain’s 28,055 villages and hamlets in Ordnance Survey’s gazetteer to the nearest state school. Half of English villages and hamlets are within 1.6 km of a primary. In Scotland 17% are more than 5 km from one, and 34% are more than 10 km from a secondary school.
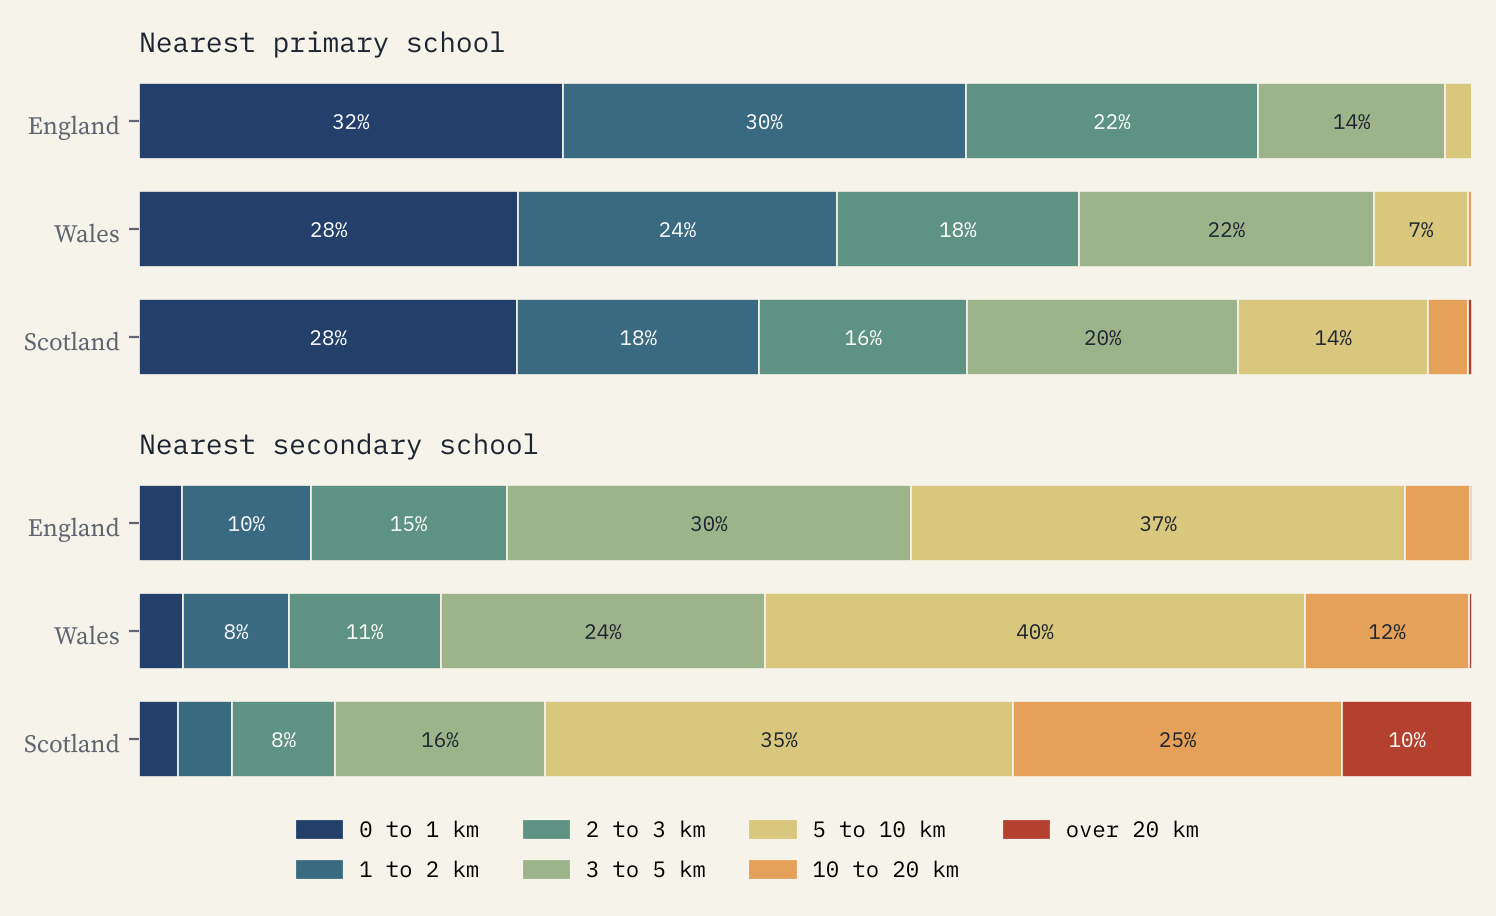
The most remote places are islands, where a straight line across the sea says little about the real journey. Da Hametoon, in Shetland Islands, is 42.2 km from the nearest secondary school. On the mainland the furthest is Braemar in Aberdeenshire, 37.5 km from a secondary.
Is the nearest school your catchment school?
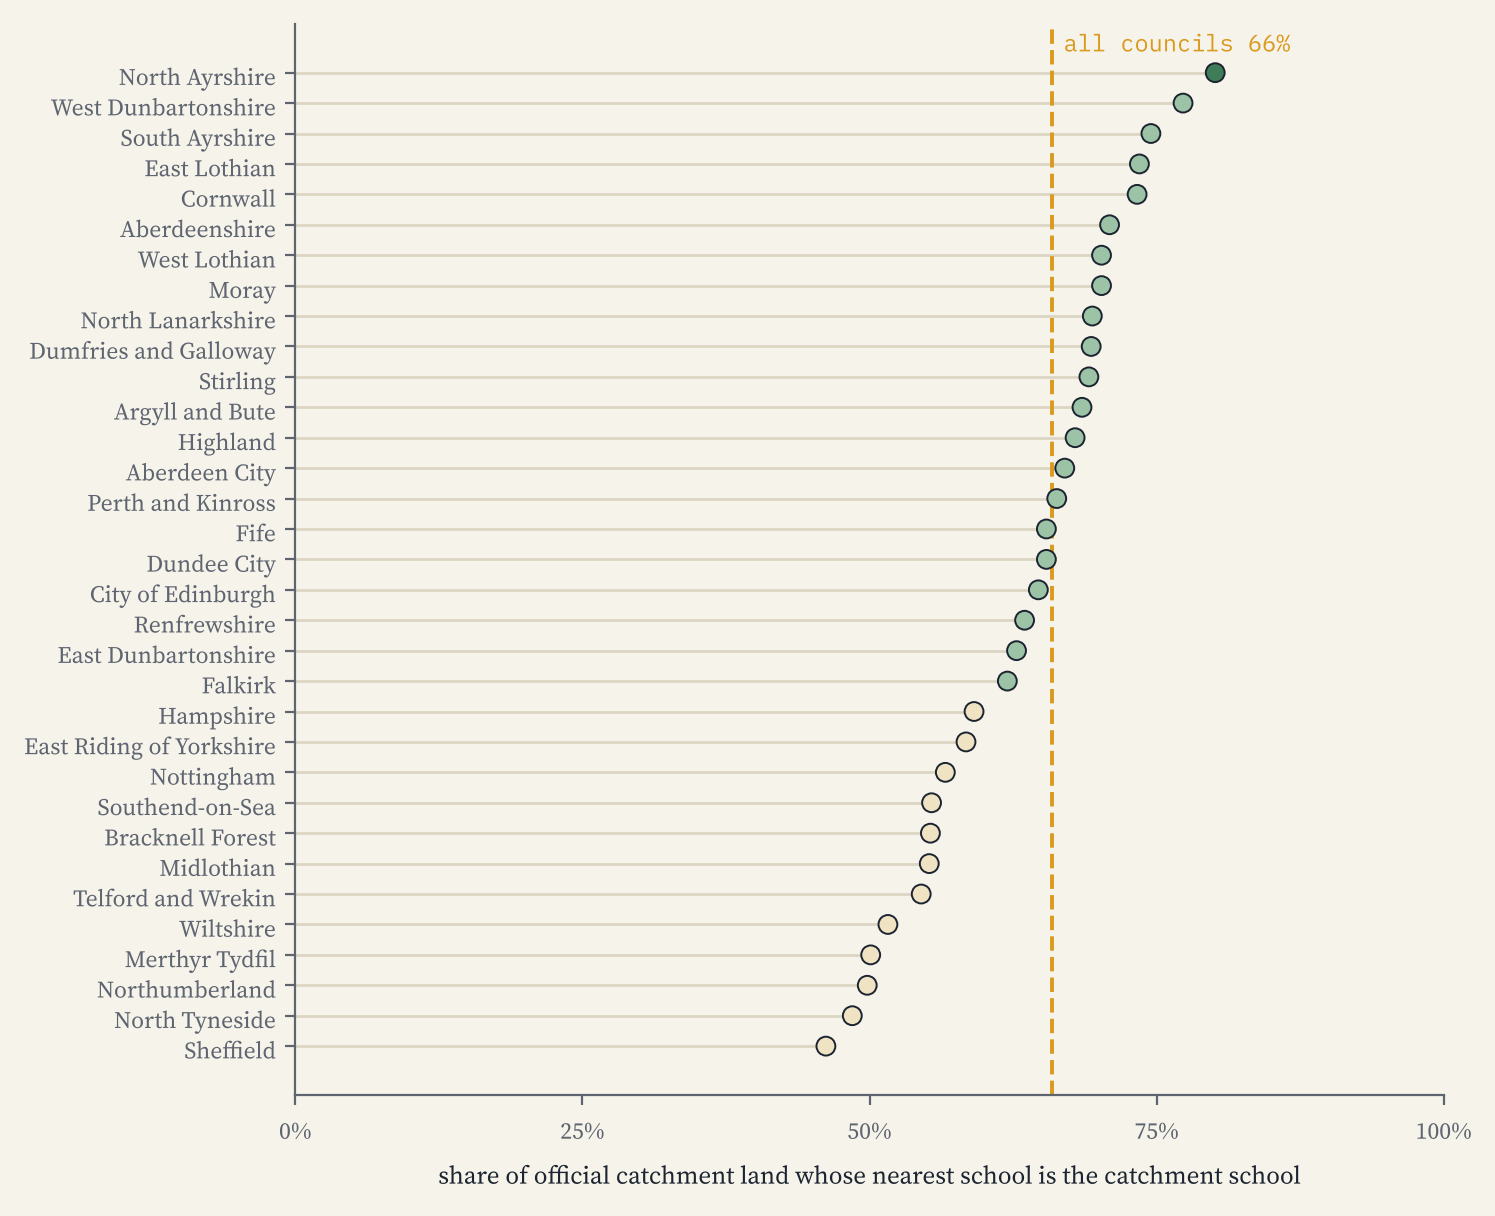
Where councils publish catchments I could test my yardstick. For every official catchment I laid a grid of points over it and asked whether the catchment’s school was also the nearest school of its kind. Weighted by area, it was for 66% of the land. So nearest-school zones are a fair first guess, but about a third of the time the official answer is a different school, because catchments follow roads, rivers, villages and the size of buildings rather than straight lines.
The nearest school is the catchment school for about two thirds of the land.
How I did this
The schools come from the four governments’ open lists: Get Information About Schools for England, the Welsh Government’s address list, the Scottish Government’s school roll and locations, and the Department of Education’s enrolment data for Northern Ireland, which I placed by postcode. The catchments come from councils’ open map services found through data.gov.uk and ArcGIS Online. Scotland also has a national catchment layer on the Improvement Service’s Spatial Hub, but it sits behind a terms form, so I used the councils’ own open services instead. Nearest-school zones are Voronoi cells clipped to land. Everything is measured in straight lines, which ignore roads and ferries, and the zones ignore faith, selection and how full a school is. This is a map for curiosity, not for applications: always check with your council.
Notes and sources
- England: Department for Education, Get Information About Schools, 28 October 2026. Wales: Welsh Government address list of schools via DataMapWales. Scotland: Scottish Government, Scottish School Roll and Locations. Northern Ireland: Department of Education, school level enrolment data 2025/26, located with postcodes.io. All Open Government Licence v3.0.
- Official catchments: open map services of 33 councils, listed with their licence notes in the data release. Council boundaries: ONS Open Geography Portal. Places: OS Open Names. Contains OS data © Crown copyright and database right 2026.
- Text and figures are CC BY 4.0; the code is MIT.
- I wrote the text, with drafting and editing assistance from Claude (Anthropic), which also helped prepare the analysis code. I reviewed and checked all text and results.

