
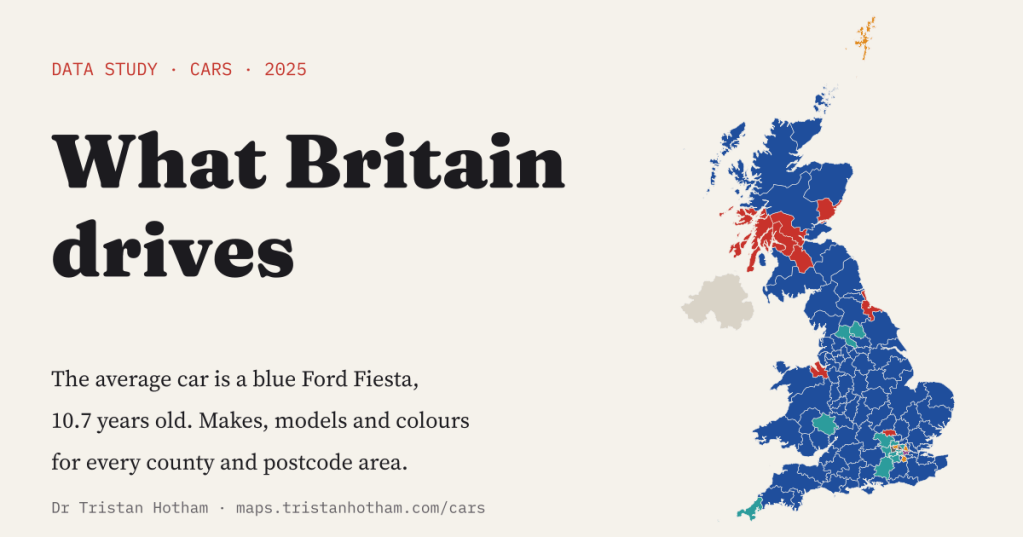
Every car in Britain over three years old has to pass an MOT, and every test is published as open data. I read all 42,728,066 tests from 2025 to find the most popular makes, models and colours in every county and postcode area. The average British car turns out to be a blue Ford Fiesta.
Look along any street and you can read a little about a place from its cars. Are they new or old, big or small, sensible or shiny? I wanted to do that for the whole country at once. The Driver and Vehicle Standards Agency makes it possible: it publishes every MOT test, with the personal details removed, including the car’s make, model, colour, fuel, engine size, the date it was first used, and the postcode area of the garage that tested it.
The 2025 file is 4.8 GB, so I read it in pieces in a web browser and kept only running counts, one per vehicle. That gave 31,731,781 vehicles. After setting aside 2,879,354 vans and pick-ups, I was left with 28,850,439 cars. Ford is the most common make (12.0%), black the most common colour (20.0%) and the Ford Fiesta, which went out of production in 2023, still the most common model, with 1,313,412 on the road. The Fiesta’s own favourite colour is blue. The average tested car is 10.7 years old.
A Ford country, mostly
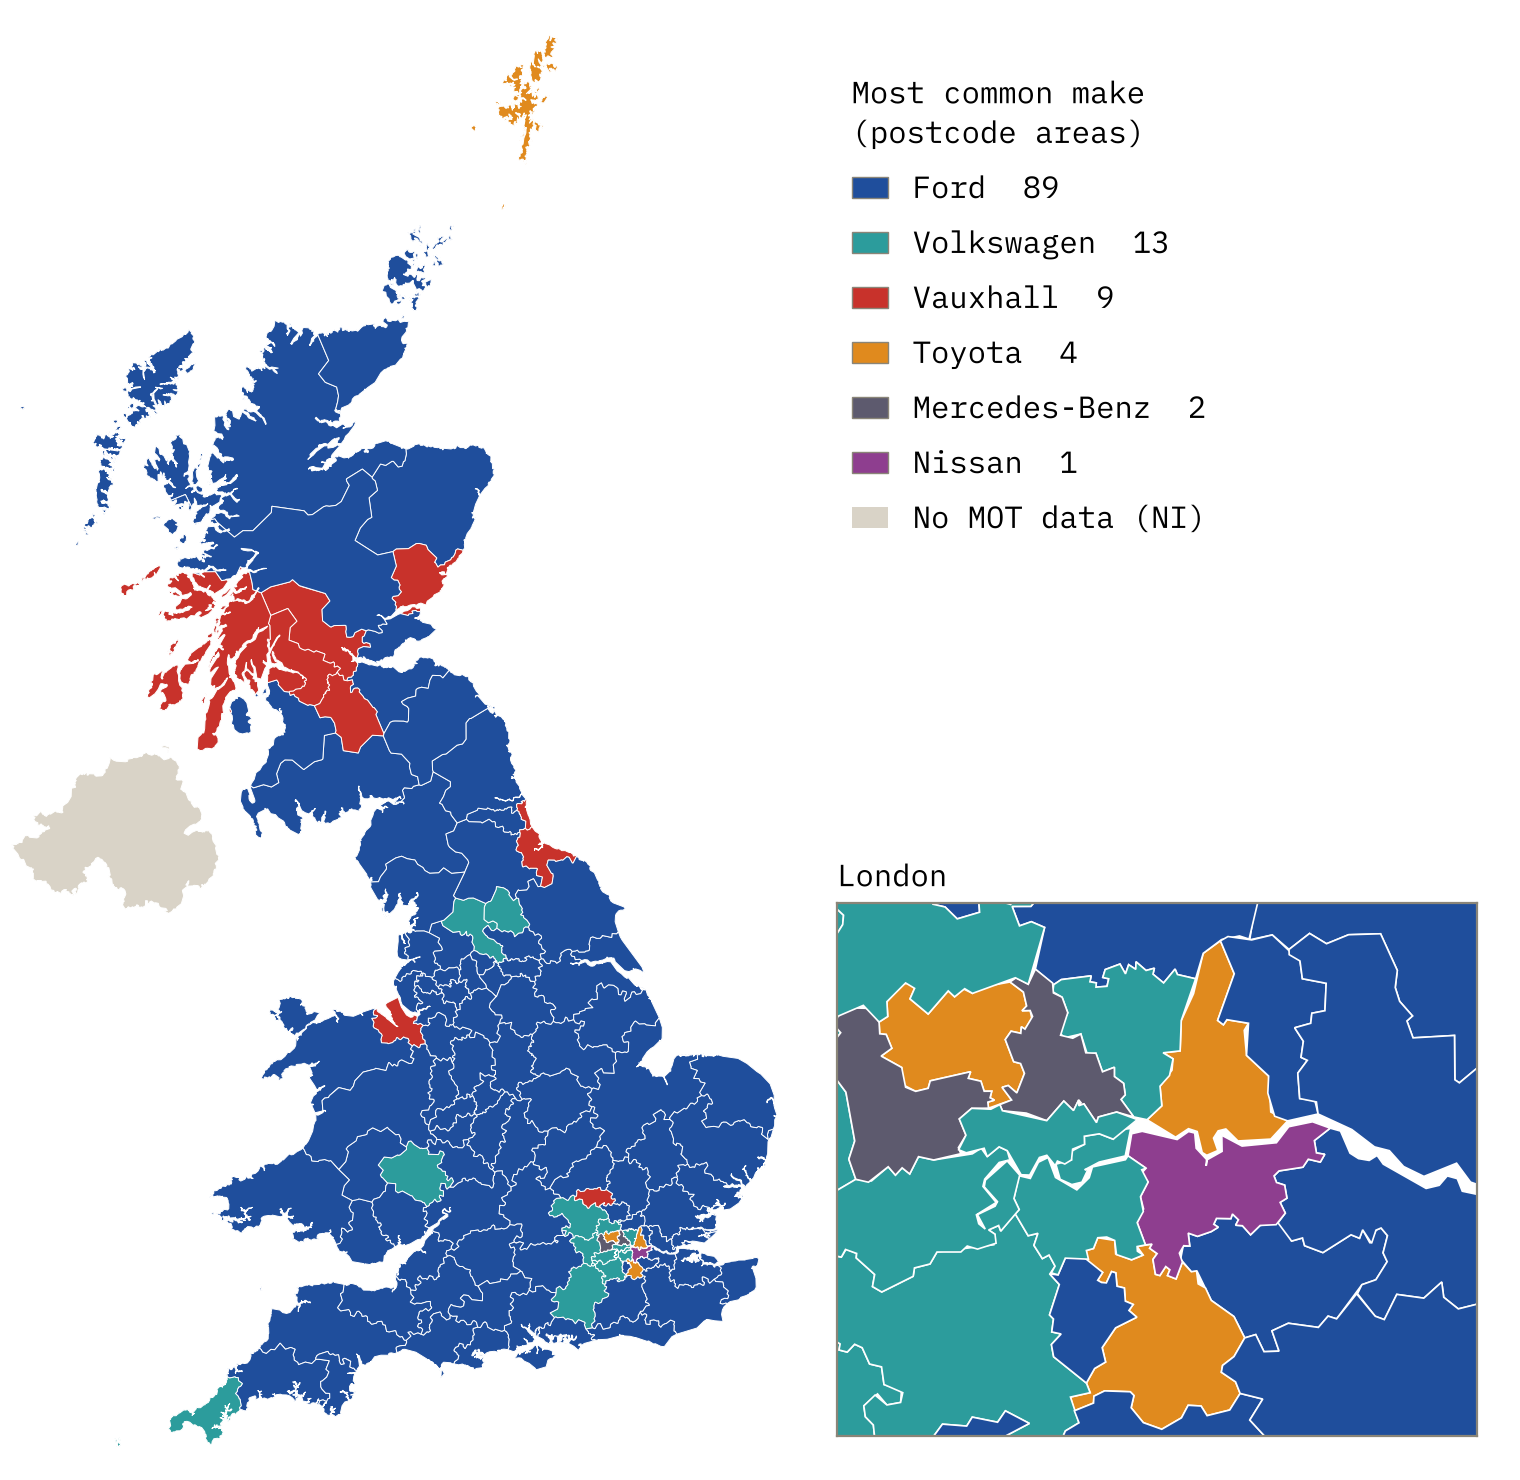
Ford leads in 89 of 118 postcode areas. The exceptions are the interesting part. Vauxhall takes 9, including Luton, where it built vehicles for more than a century and where 15.5% of cars are Vauxhalls, the strongest showing of any make anywhere. It also leads around Glasgow, Dundee, Teesside, Sunderland and the Wirral. Volkswagen takes 13 areas, mostly the prosperous belt around London. In London itself the map breaks into pieces: Mercedes-Benz in the north-west, Nissan in the south-east, and Toyota in the east, where the hybrid Prius is the single most common car.
You can look up your own place on the interactive map. Lancashire, for example, is thoroughly average: its most common car is a blue Ford Fiesta, in the county and in the Blackburn postcode area alike.
Scotland likes white
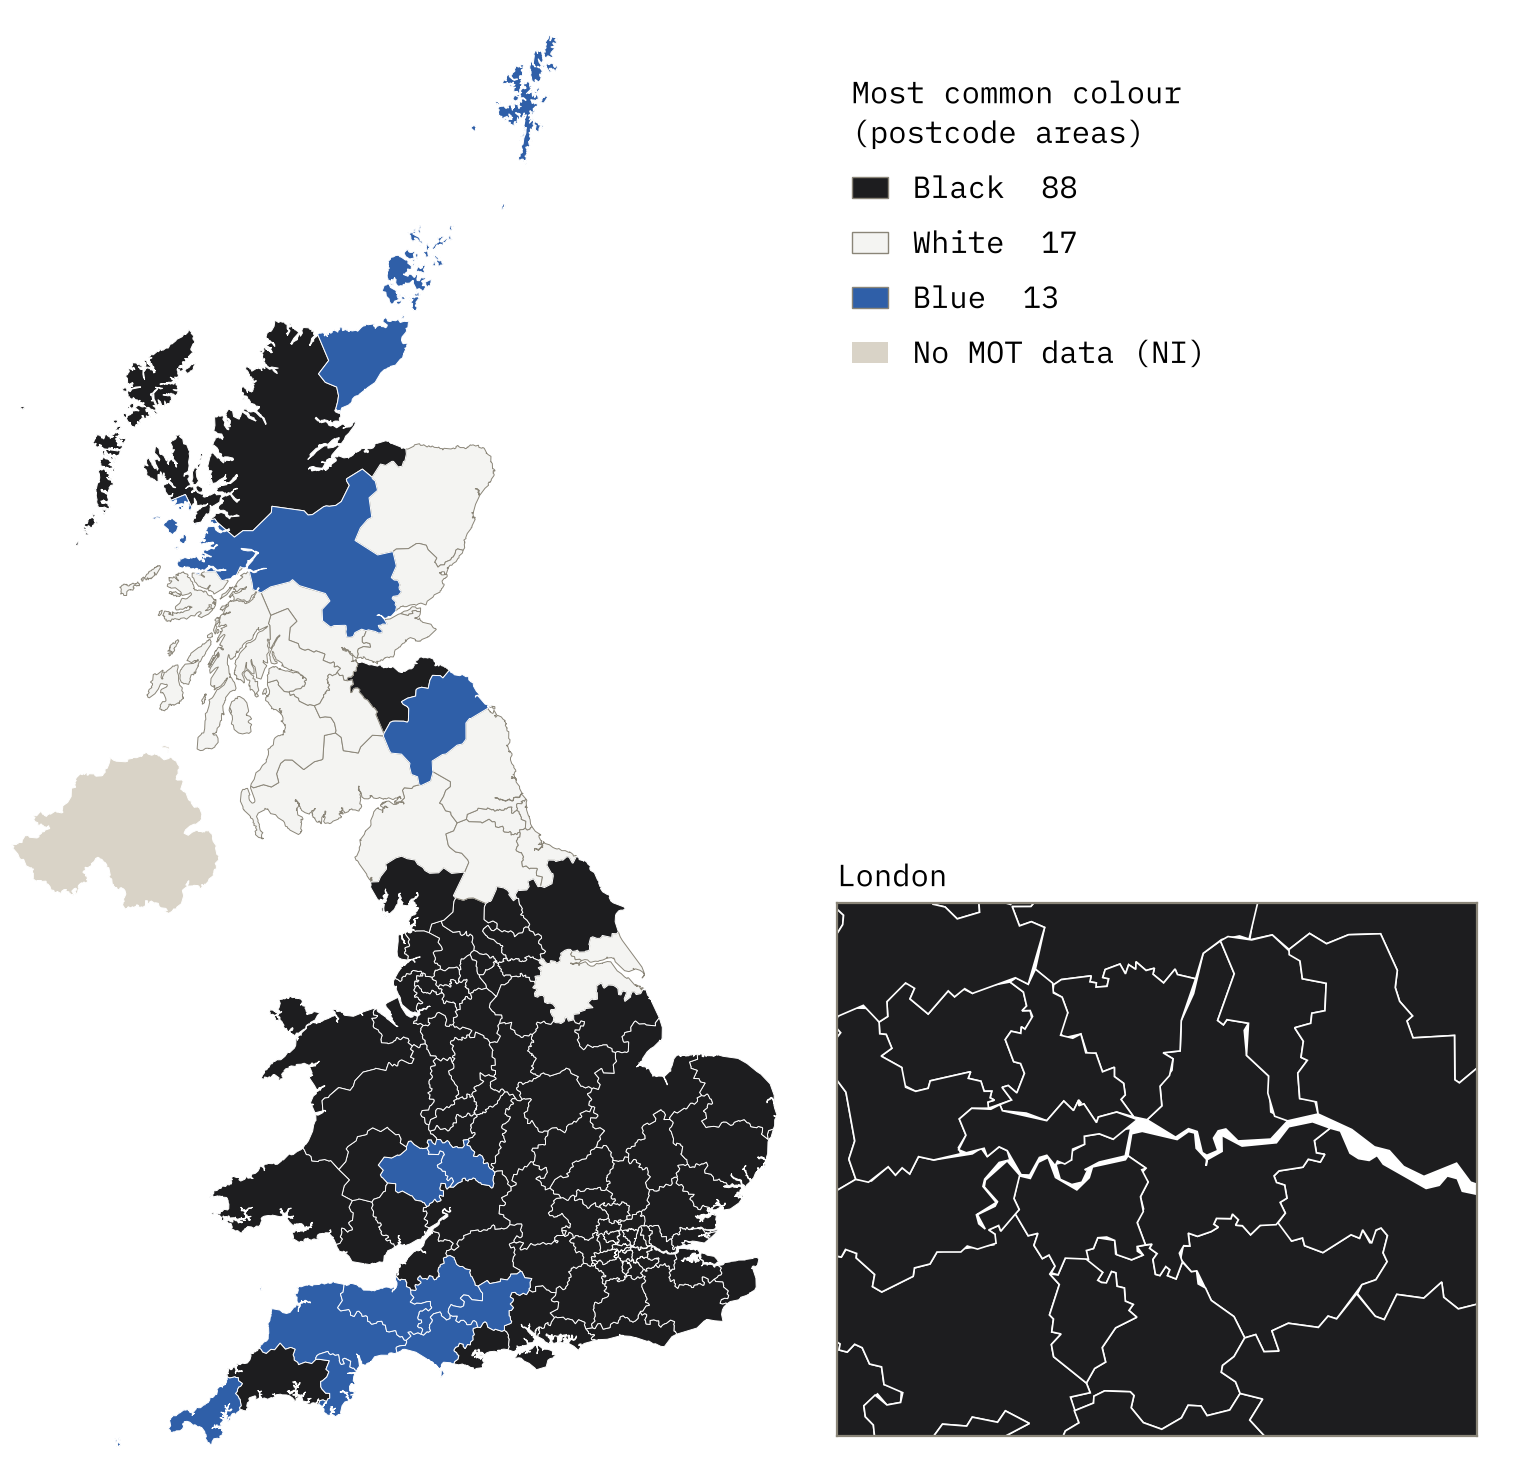
England and Wales are mostly black-car countries, though a belt of white runs across the north of England and southern Scotland, and the south-west of England prefers blue. Scotland as a whole is different: its most common colour is white (19.0%, just ahead of black), its most common model is the Vauxhall Corsa rather than the Fiesta, and Vauxhall runs Ford close (10.4% against 10.7%). Scotland’s tested cars are also the youngest in Britain, 9.2 years on average against 10.9 in England. Wales is the most Ford of the three (13.1%) and the most diesel.
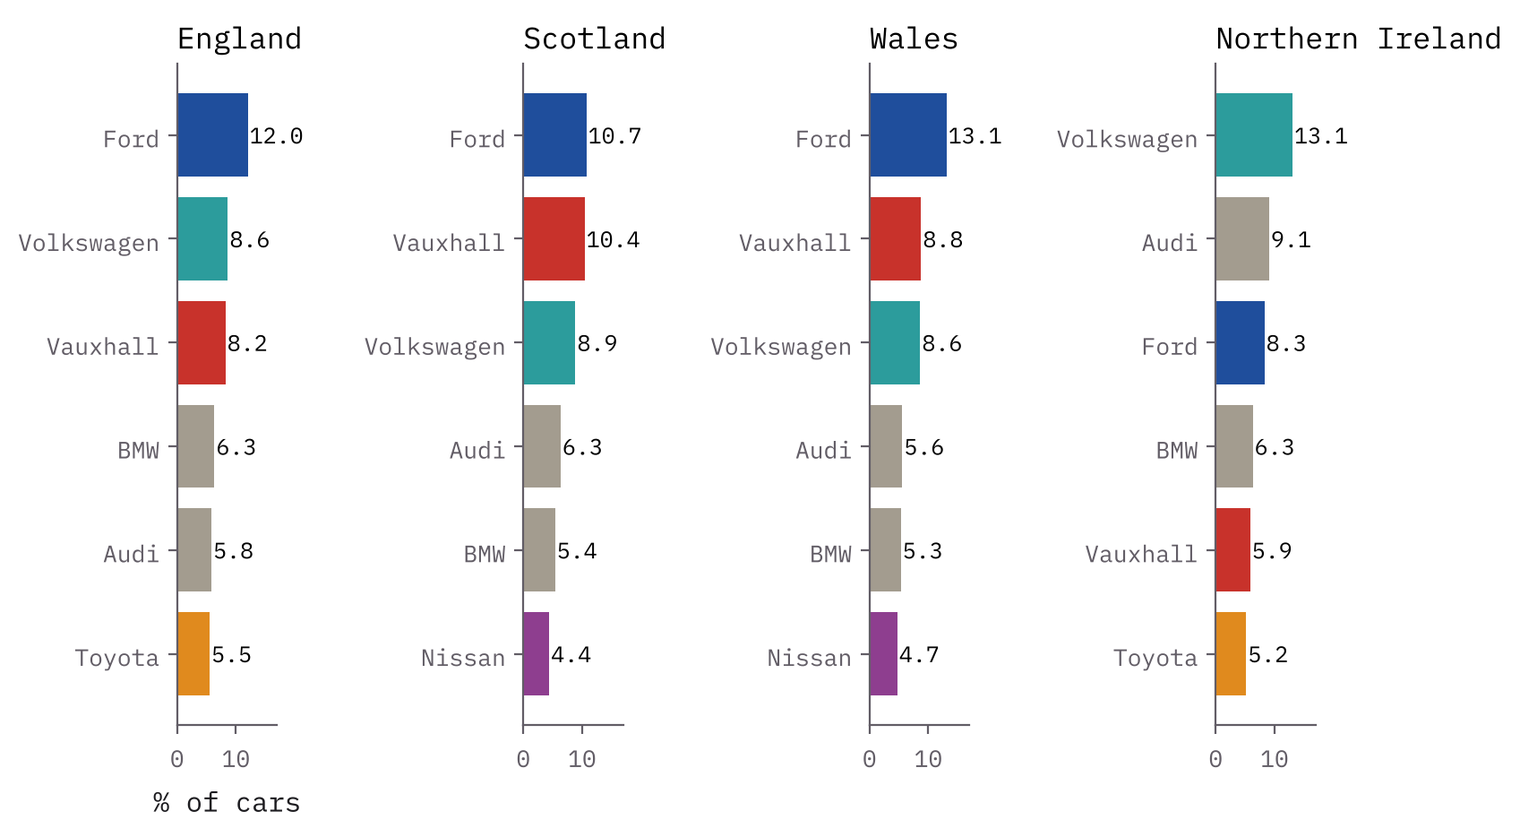
Northern Ireland is missing from the MOT data, because its tests are run by the Driver and Vehicle Agency, which does not publish makes or colours as far as I could find. But the Department for Transport counts licensed cars for the whole UK, so subtracting Great Britain gives Northern Ireland’s 1,055,481 cars. They are a different fleet: Volkswagen leads (13.1%), Audi is second (9.1%, against 5.9% in Great Britain), the Golf is the top model, and 50.6% of cars are diesel, against 28.7% in Great Britain.
Shetland, the odd one out
Which places look least like the rest of their nation? I measured how much of each place’s mix of makes would have to change to match its nation’s. Most counties are very ordinary: the median would need only 6.6% of its cars to change make. The most unusual postcode area is Shetland, where 14.4% of cars are Toyotas, 3.6 times Scotland’s share. Next come London’s areas, then the Scottish Borders (more Mitsubishis) and, in Wales, Flintshire, where Vauxhall is strong as it is just over the border on the Wirral.
The great greying
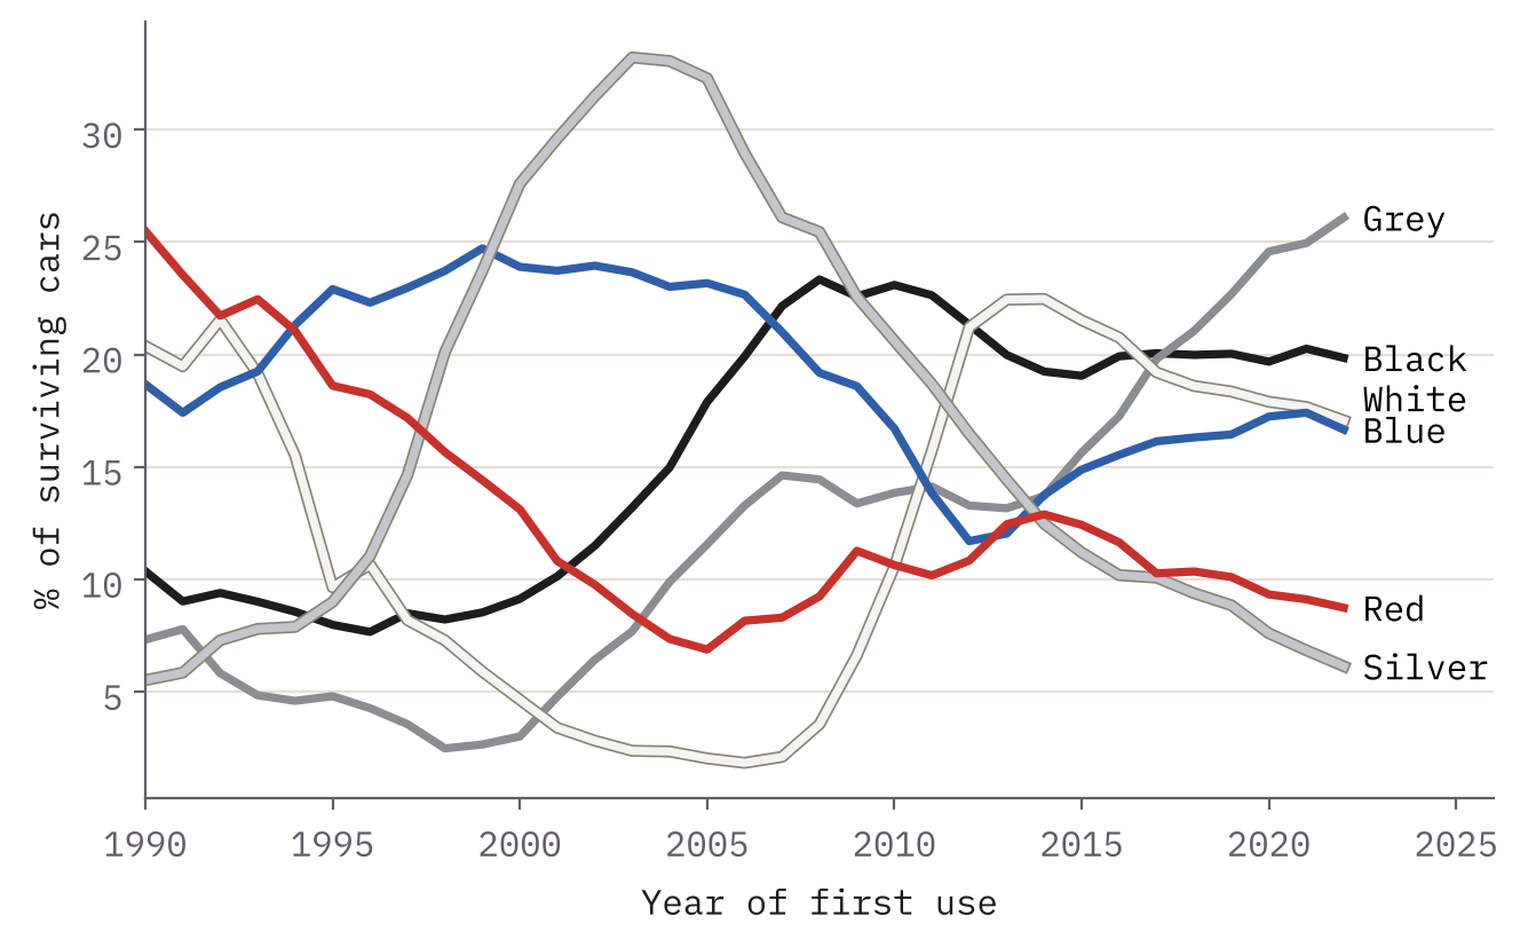
Sort the cars by the year they first took to the road and you can watch fashion move. Silver was the colour of the millennium: 27.6% of surviving cars from 2000 are silver. Of those from 2022, only 6.1% are. Grey has gone the other way, from 3.0% to 26.1%. These are survivors rather than sales, but the swing is far too large to be about which cars last.
Silver was the colour of the millennium. Grey is the colour of now.
Where the electric cars are
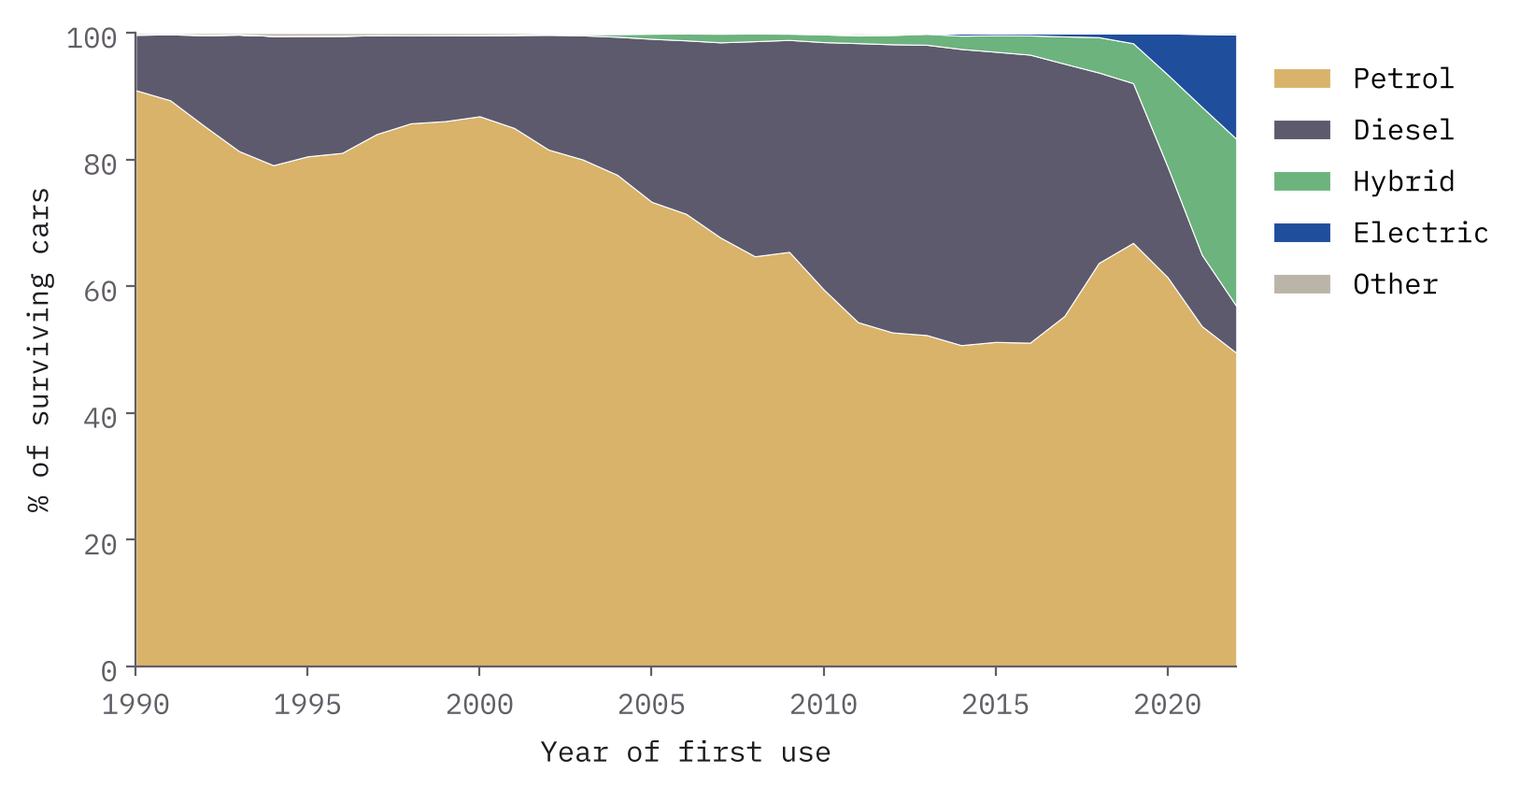
The MOT data can show diesel rising and falling: 46.8% of the surviving cars from 2014 are diesels, but only 7.4% of those from 2022. Electric cars are too new to show up properly, so for them I used the Department for Transport’s licensing counts, privately kept cars only, because company cars are registered at head offices. Across the UK there were 2.5 battery electric cars per 100 private cars at the end of 2025.
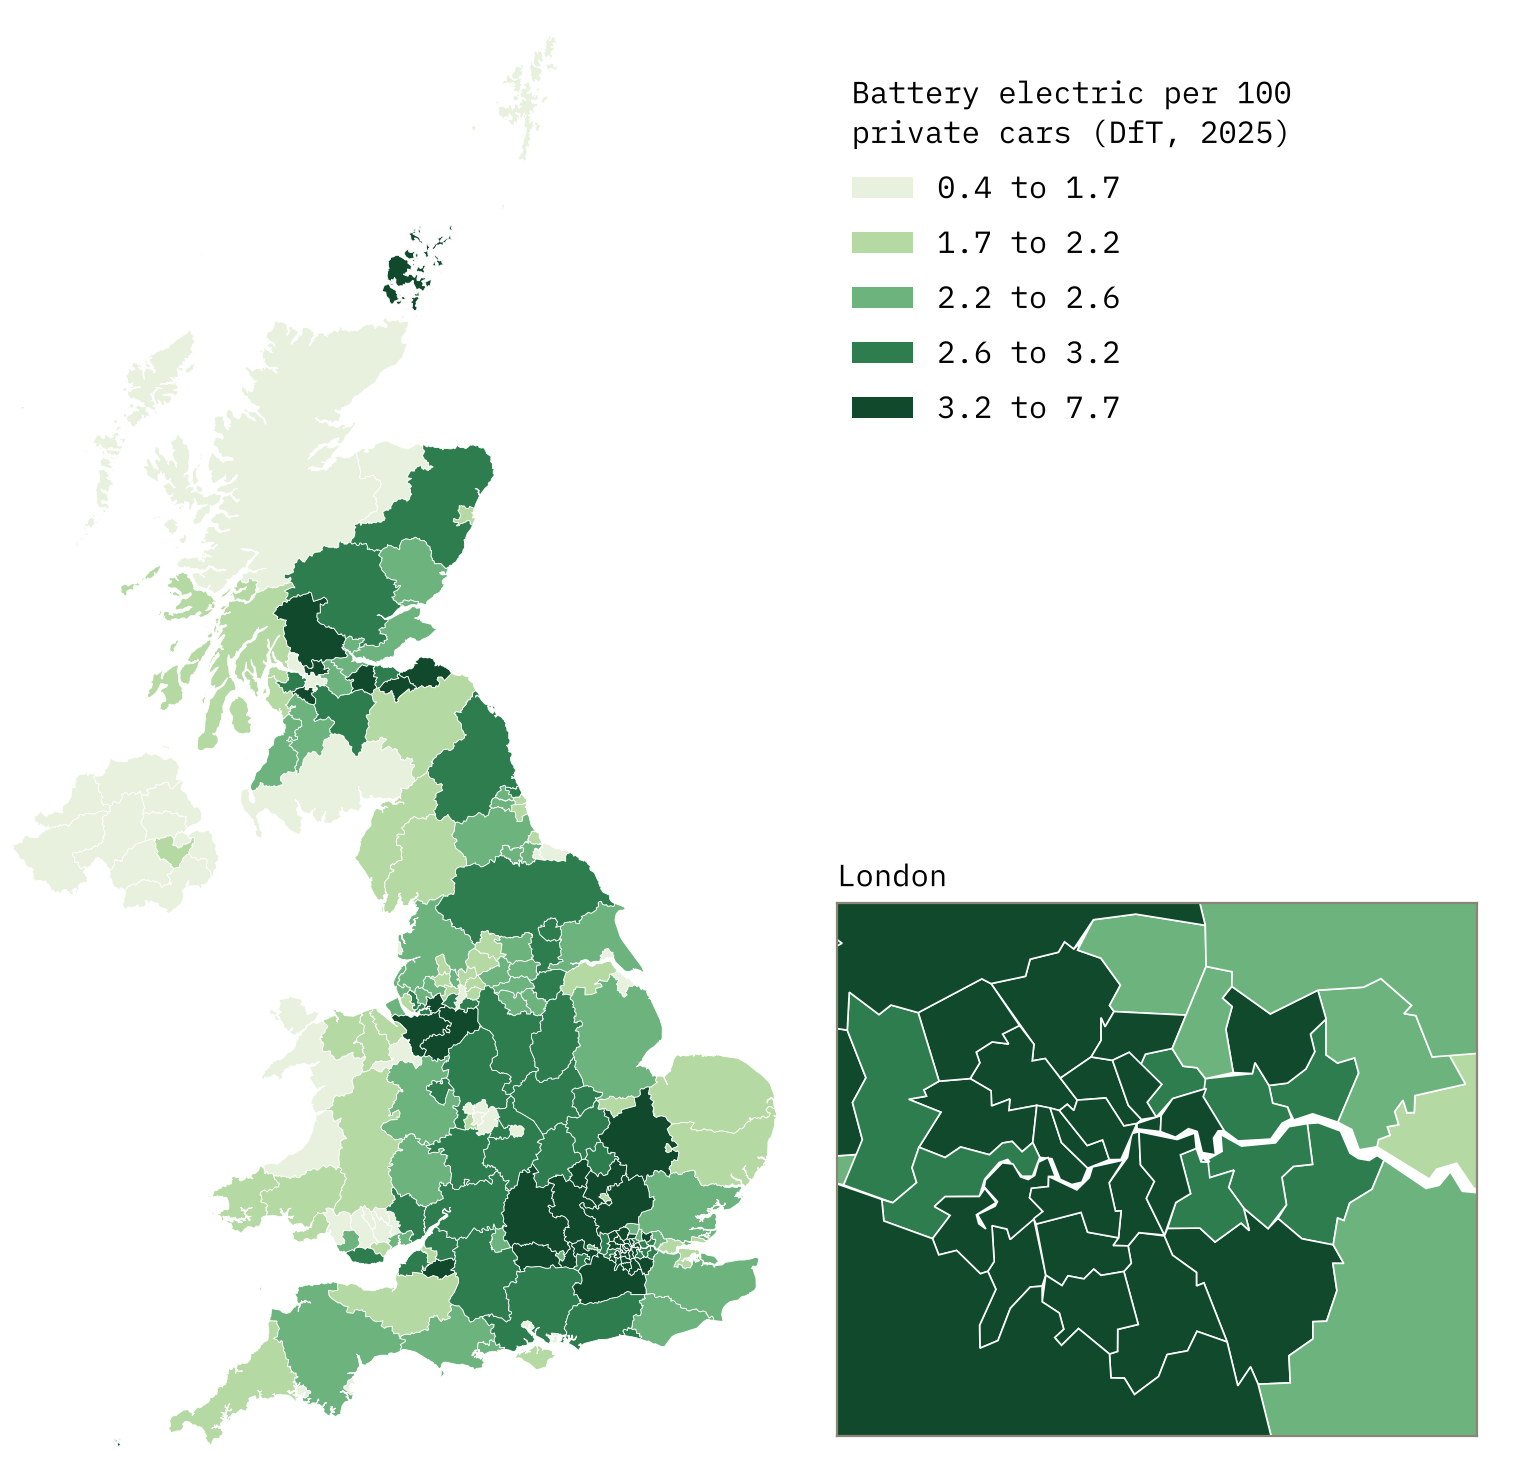
The highest rates are in central London: 7.7 per 100 in the City of London and 7.6 in Camden. The lowest are in Northern Ireland, with 0.4 in Fermanagh and Omagh, and in the Western Isles (0.7). Islands are not all slow, though: Orkney has 3.8, second only to East Renfrewshire in Scotland.
Old cars in the sunny south-west
The oldest cars are in south-west England. The average tested car in Torbay is 12.4 years old, with Dorset and Devon close behind. The youngest are around Glasgow, where the Motherwell postcode area averages 8.7 years. Across Britain, 34,305 cars tested in 2025 were first used before 1980.
How I did this
I read the DVSA’s 2025 MOT results file straight from the publisher in a browser, kept class 4 vehicles, and counted each vehicle once at its last test of the year. I grouped model names into families and set aside vans and pick-ups by family. Each test records the postcode area of the garage, not the owner, so cars are placed where they were tested. To get counties, I shared each postcode area’s cars out by its live postcodes, using the ONS Postcode Directory. Electric cars and Northern Ireland come from DfT licensing tables. Cars under three years old have not had an MOT, so the MOT figures describe cars aged three and over, and county figures are blends of whole postcode areas. The paper sets out every step and limit.
Notes and sources
- Driver and Vehicle Standards Agency, anonymised MOT tests and results (2025 results extract), Open Government Licence v3.0.
- Department for Transport, vehicle licensing statistics data files (VEH0120, VEH0125, VEH0145), Open Government Licence v3.0.
- Office for National Statistics, Open Geography Portal: ONS Postcode Directory (August 2026), local authority lookup (May 2026) and Counties and Unitary Authorities boundaries (December 2025), Open Government Licence v3.0. Contains OS data © Crown copyright and database right 2026; contains Royal Mail data © Royal Mail copyright and database right 2026.
- Ordnance Survey, OS Open Names, Open Government Licence v3.0 (place search on the interactive page).
- Hotham, T. (2026) What Britain drives: car makes, models, colours and ages by county and postcode area from the 2025 MOT record. https://doi.org/10.5281/zenodo.23748250
- I wrote the text, with drafting and editing assistance from Claude (Anthropic), which also helped prepare the analysis code. I reviewed and checked all text and results.

