
Why Facebook mattered for politics, 2010 to 2020.
For about ten years, if you wanted to reach the British voter, or the Spanish one, or the Swedish one, you went to Facebook. Not because it was fashionable. It was where the voters were, and it showed in the data. I spent my PhD and the years since working through that decade of party Facebook pages, and the same few reasons kept coming back. This is my short account of why Facebook mattered, and, just as important, where it did not.
It was where the whole electorate was
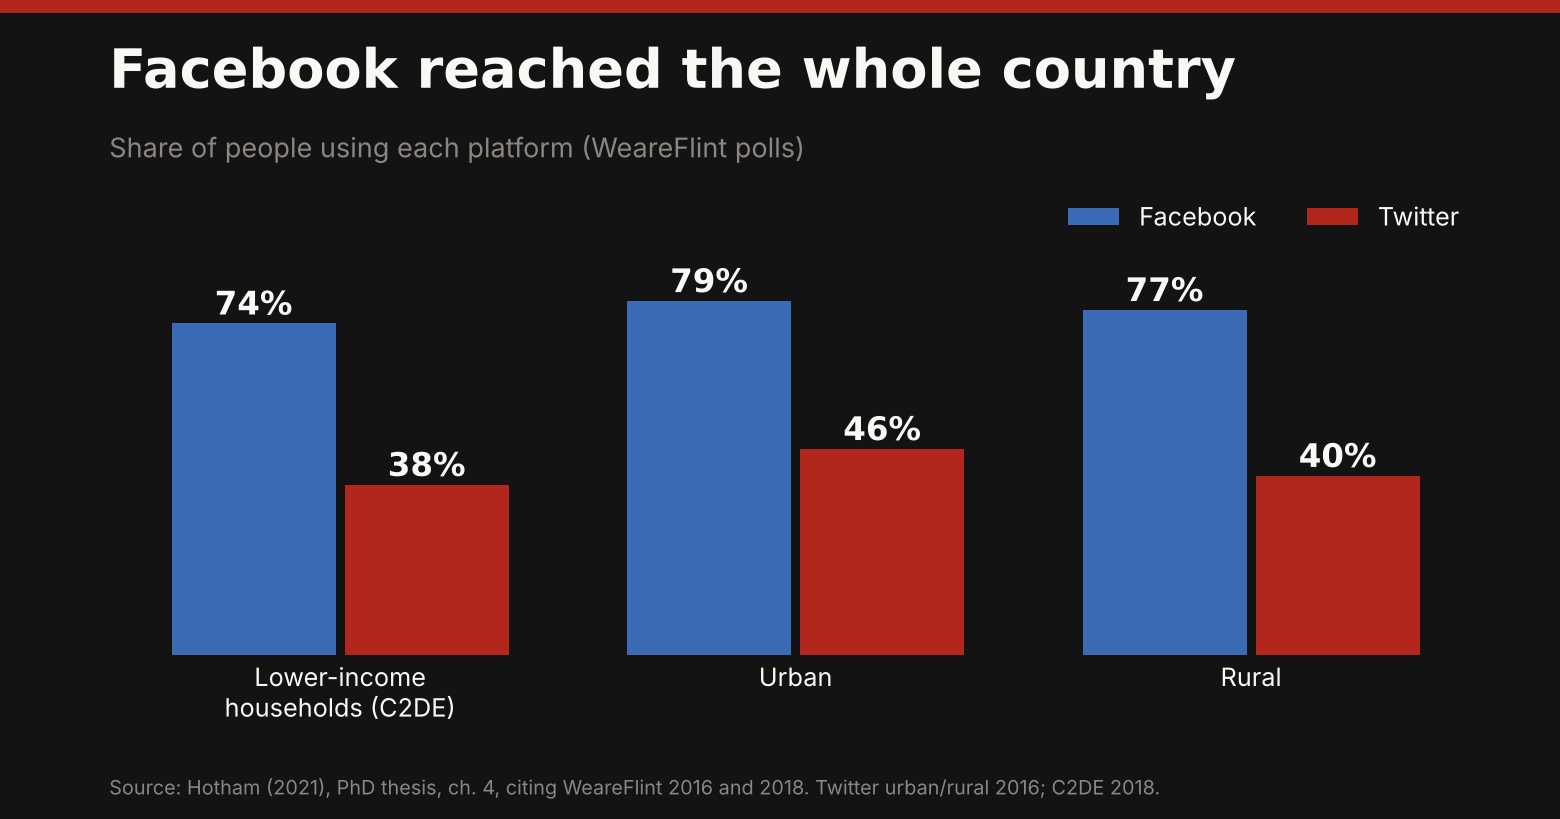
Most of the political talk about social media in the 2010s was really talk about Twitter. But Twitter is a niche. In the survey data I use in my thesis, Twitter was a middle-class tool: only 38% of lower-income households (the C2DE group) used it, against 74% for Facebook. Facebook also reached the places other platforms did not. In 2016 it was used about equally by urban (79%) and rural (77%) people, where Twitter managed 46% and 40%.
By 2016 around 56% of the UK population was on the platform, and by 2018 some 35 to 40 million people in the UK used it every month. For a party with limited money and volunteers, that is a rare thing: one place where you can reach core supporters, marginal voters and people who are only half-interested in politics, all at once.
And it kept becoming more like the voters
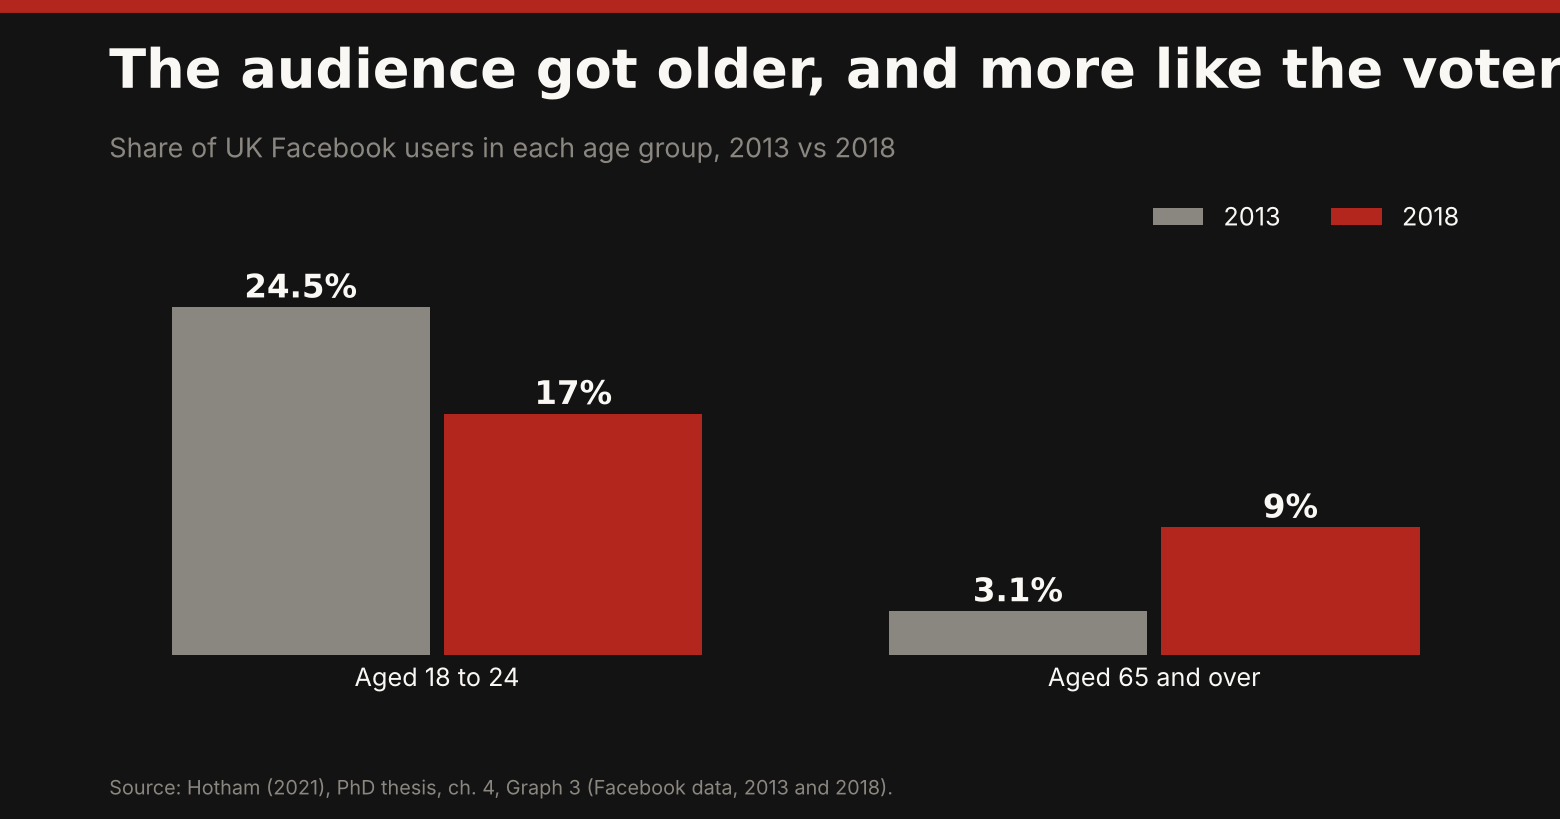
Early on, Facebook skewed young. Researchers using the British Election Study found that in 2015 its users were younger than the average voter, though older than Twitter’s. Over the decade that changed. Between 2013 and 2018 the over-65s grew from 3.1% to 9% of UK users, while the 18 to 24 share fell from 24.5% to 17% as the youngest users drifted to Instagram and TikTok. Facebook was ageing towards the electorate. Voters skew older, and so did the audience.
This matters because the usual worry about social media is that it is a bubble of the young and the loud. For most of this decade Facebook was the closest thing parties had to a broadcast channel that was also a social one. My thesis argues that parties used it to recreate the traditional campaign, with information first and participation second, but to a far bigger and more representative audience than their official memberships could ever reach. I call these followers “virtual members”.
Parties really did use it
The proof that it mattered is in what parties did. Across my papers I have analysed hundreds of thousands of posts from party and leader pages: 160 parties and eight campaigns in 21 countries so far. Parties posted constantly, and the audience responded. Engagement rose almost in proportion to posting across months (Does Posting More Pay?), parties moved to video as Facebook pushed it, and carried on after the extra engagement had faded (The Pivot to Video).
Different parties used it differently. In Britain the two biggest ran what I call Janus-faced campaigns: a traditional face on the main party and leader pages, and a more adventurous one through satellite pages such as Momentum, which could campaign in a more partisan, viral way without risking the party’s own brand (What Does a Satellite Campaign Do?).
For some it was a megaphone
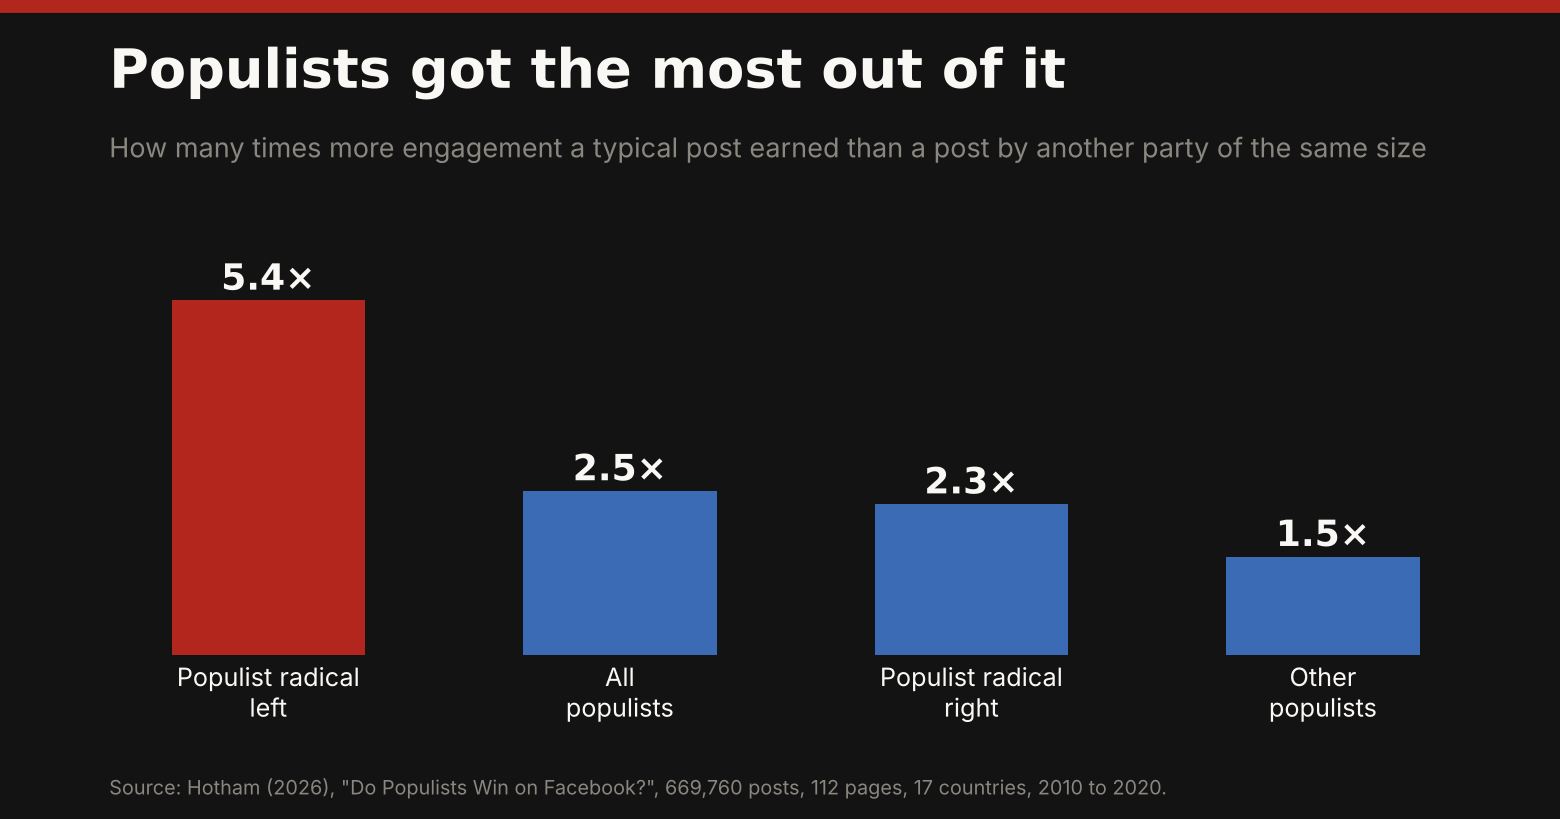
Across 669,760 posts from 112 party pages in 17 European countries, a typical post by a populist party earned about 2.5 times the engagement of a post by another party of the same size and government status. The premium was biggest for populist radical left parties, at about 5.4 times, then the radical right, at about 2.3. It varied a great deal by country: large in Spain, the UK, Norway, Sweden, Hungary and France, undetectable in places such as Finland, Greece and Switzerland. Bigger audiences explain more than half of it (Do Populists Win on Facebook?).
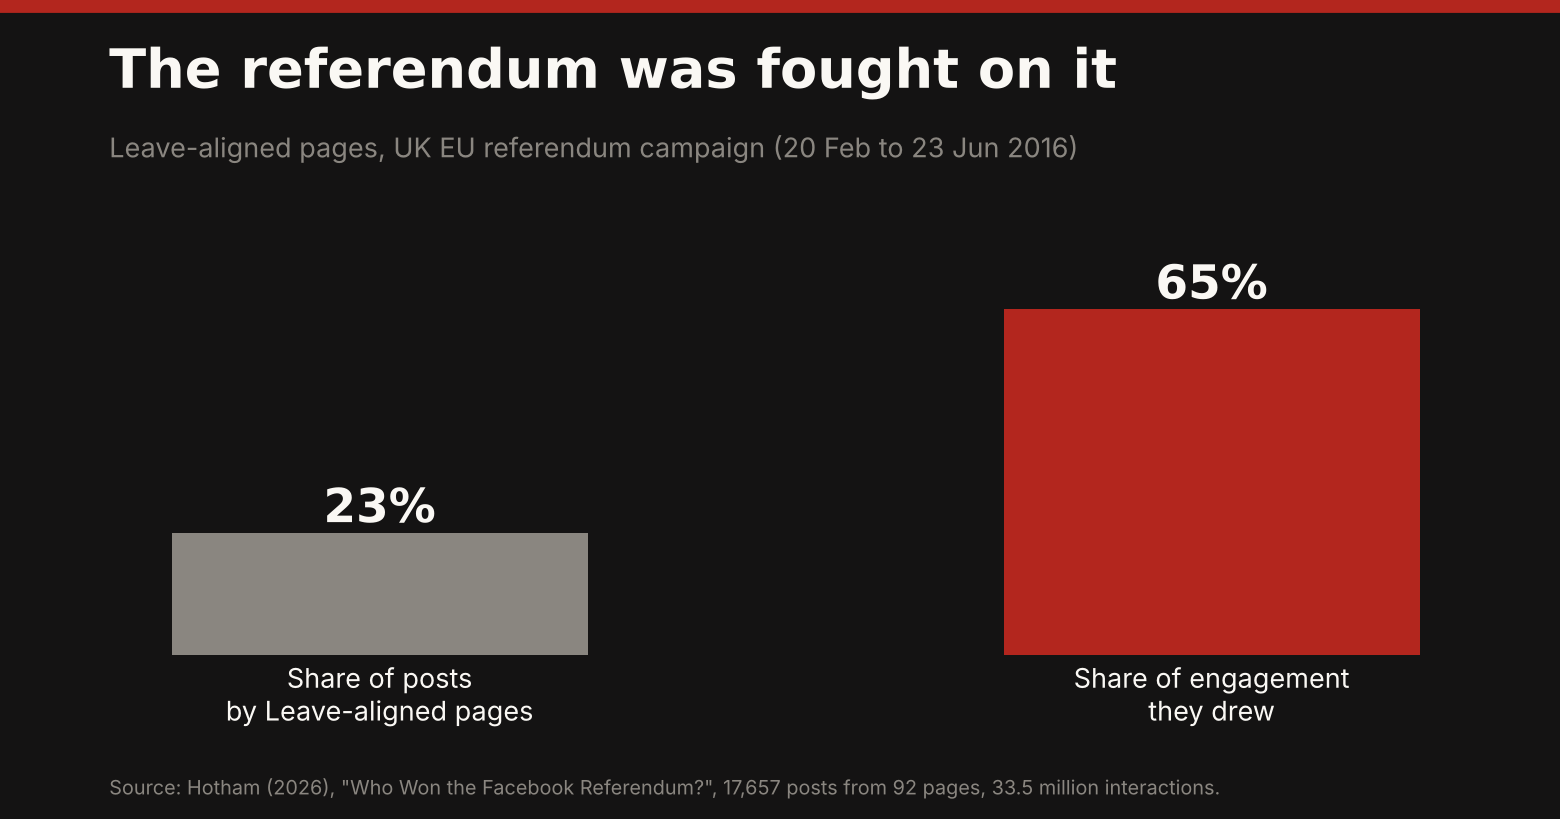
The 2016 EU referendum is the clearest British example. Across 17,657 posts from 92 pages, Leave-aligned pages produced 23% of the posts but drew 65% of the engagement, though most of that came from four big pages, and I do not find evidence that they won it by being more negative (Who Won the Facebook Referendum?).
When it mattered most: attention and crisis
Facebook also shows where public attention went. Engagement moved with public interest rather than ahead of it (Does Facebook Lead Public Attention or Follow It?), and in the first Covid-19 wave attention shifted towards government pages, though the rally on European political Facebook was modest and short (A Smaller Rally).
What it was not
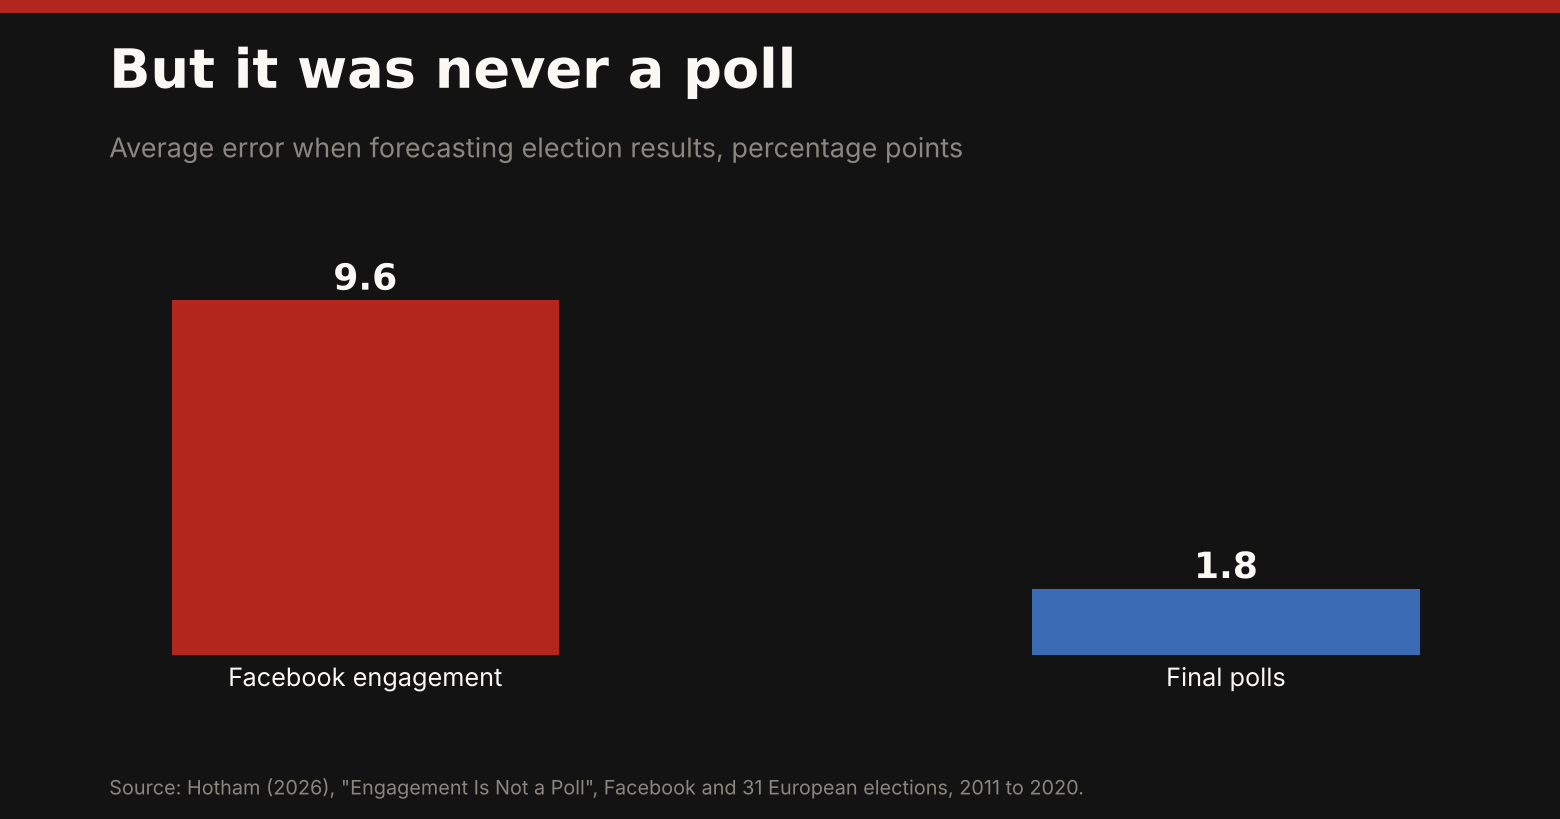
I would be misleading you if I stopped there. Mattering is not the same as deciding elections. Engagement shares followed vote shares, but added little once you knew the previous result, and as a forecast it was poor: an average error of 9.6 points against 1.8 for the final polls (Engagement Is Not a Poll). Engagement also followed votes less than proportionally, and the largest party rarely had the most of it (Equal on Facebook?). And engagement per follower fell by 25 to 35% from 2016 to 2018 before recovering by 2020 (A Dip, Not a Decline).
Why call it the Facebook decade?
Because it was the one platform that parties across the political spectrum, in country after country, treated as the main stage. It was broad enough to look like the electorate, used heavily enough to leave a record, and open enough, through CrowdTangle, for researchers to see inside it. That is why so many of my papers are about Facebook between 2010 and 2020: it was the best window we had on how campaigns spoke to voters.
The decade is over. The audience has moved, the data access has closed, and the next one will be harder to study. But if you want to understand how parties campaigned in the 2010s, Facebook is where to look.
You can read the whole set of papers on my research page, or start with the thesis.

