
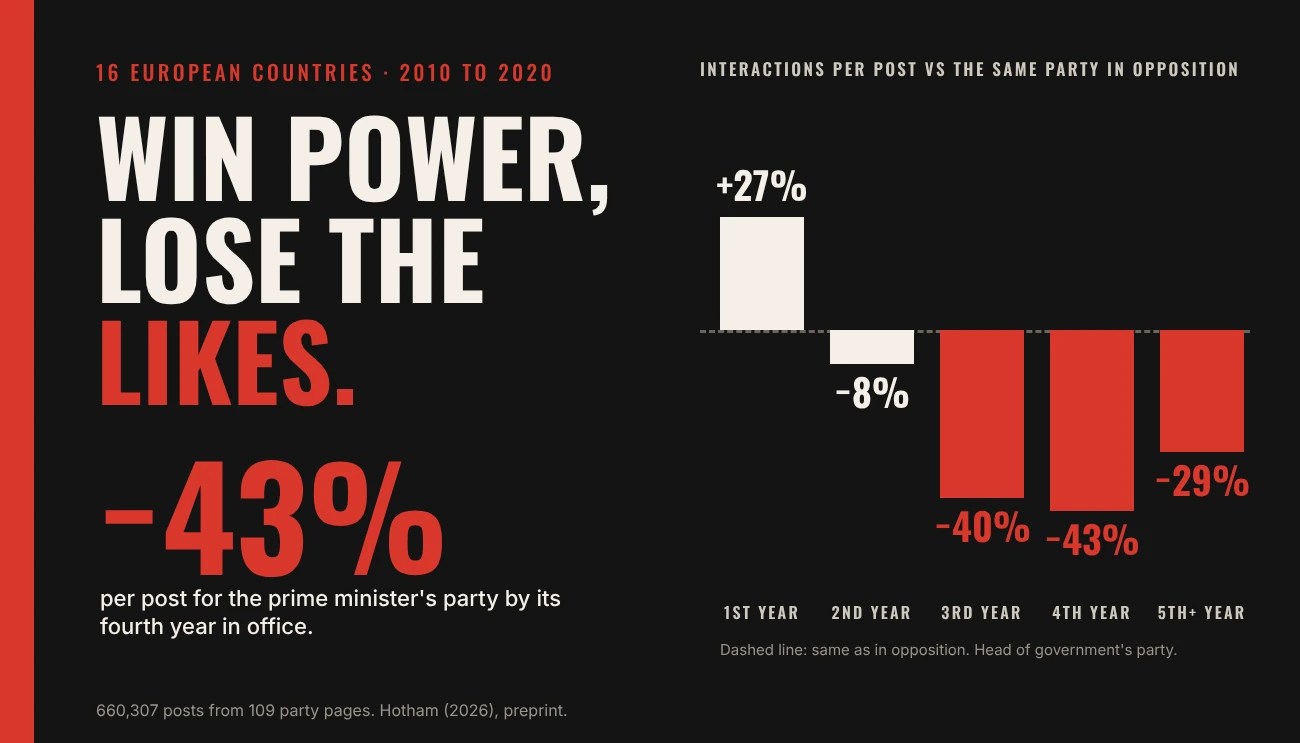
Governing is bad for parties at the ballot box. Political scientists have known this for a long time: parties in government tend to lose votes at the next election, and the smaller partners in a coalition often lose more. I wanted to know whether the same thing happens to the attention parties get on their own social media pages.
So I went back to ten years of Facebook data from across Europe and followed parties as they went into government and came out again. The short answer is yes, governing seems to cost parties attention. But not straight away, not equally, and leaving office did not bring it back.
The preprint
Does Governing Cost Parties Attention on Facebook? Incumbency, Coalitions and Engagement in Europe, 2010 to 2020
Open access, free to read, share and cite. It uses 660,307 posts from 109 official party pages in 16 European countries, 2010 to 2020.
Cite as: Hotham, T. (2026). Does Governing Cost Parties Attention on Facebook? Incumbency, Coalitions and Engagement in Europe, 2010 to 2020. Zenodo. https://doi.org/10.5281/zenodo.23398392
What I did
In 2020 I exported the Facebook posts of national parties in Europe using CrowdTangle, Meta’s tool for tracking public pages, which closed in 2024. This paper uses 660,307 posts from 109 official party pages in 16 countries, from 2010 to 2020. An interaction is any like, comment, share or reaction.
I then coded which parties were in each national government, and which one held the prime minister’s job, using ParlGov, a standard database of parties and cabinets. I checked every change against public records and fixed a few errors; for example, the database had put France’s centre-right Les Républicains in government after 2017, when they were in opposition. Over the decade, 56 of the pages changed status, through 49 entries into government and 43 exits.
The key move is to compare each party with itself. How did the same party’s posts do in government compared with when it was in opposition, and how did that change compare with other parties in the same country in the same month? That holds constant the party’s size, style and audience, and the general growth of Facebook.
In government, each post drew less
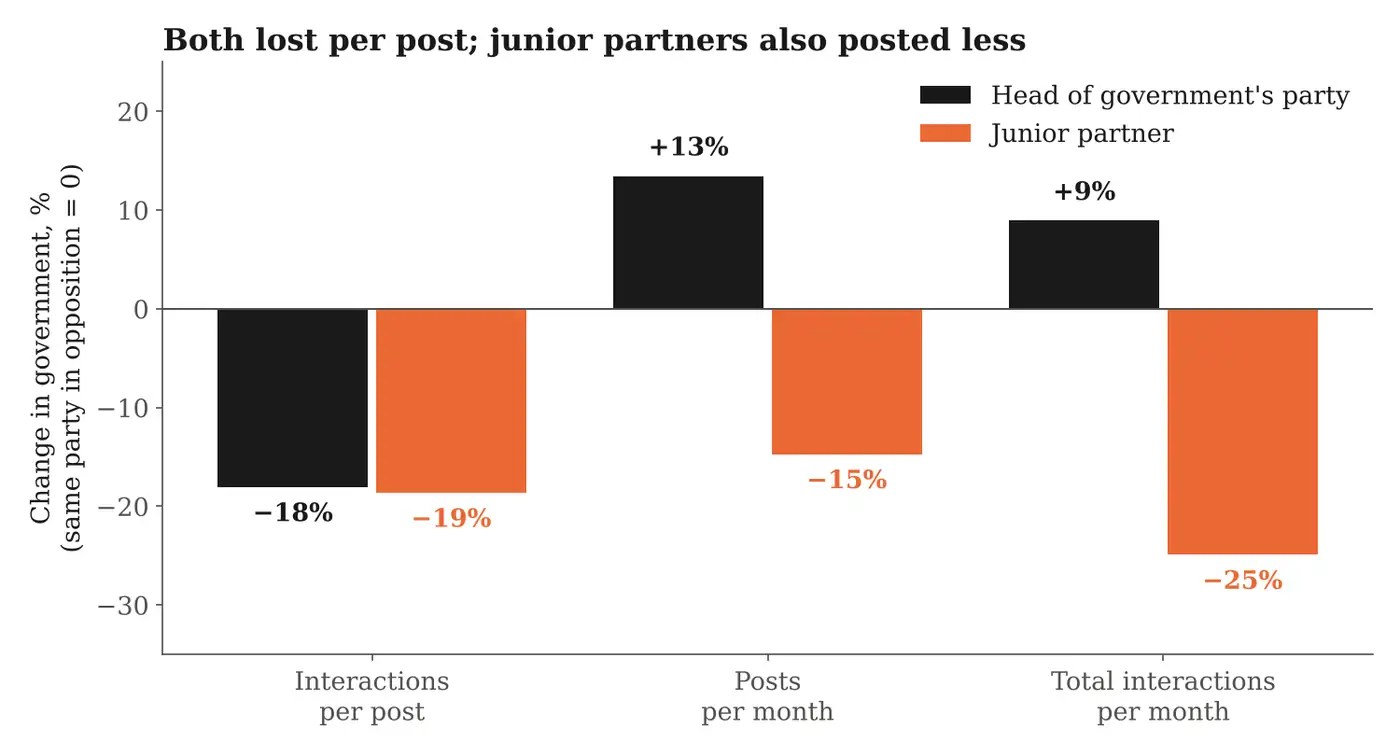
While in government, a party’s posts drew about 18% fewer interactions than the same party’s posts in opposition. That was true for both kinds of governing party: the party of the prime minister and its junior partners lost about the same per post.
The difference between them was in how much they posted. Prime ministers’ parties posted a bit more once in government, and their total engagement held up. Junior partners posted about 15% less and drew about 25% less in total. That gap is suggestive rather than firm: the uncertainty around the junior partners’ total includes no change at all. But it fits what election studies find about the junior partner penalty.
The cost built up over time
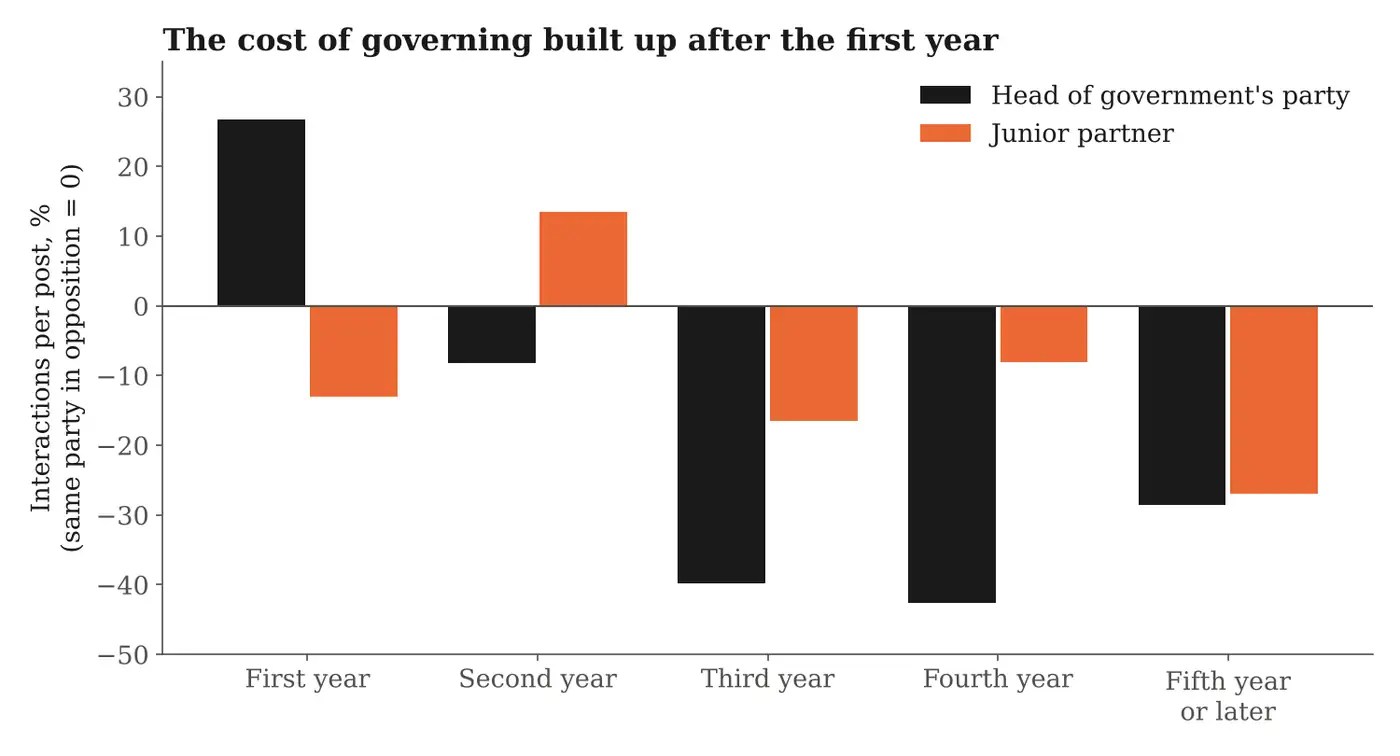
The cost was not immediate. In its first year in office, the prime minister’s party drew about 27% more per post than in opposition, a bit like a honeymoon, though the range is wide. By the third and fourth years it was drawing around 40% to 43% less. For junior partners the pattern was flatter, with the clearest fall only after four years or more.
That is very much the shape you would expect from the research on votes, where the cost of governing grows the longer a party is in power. It is also a reminder that the later years in office are the run-up to the next election, when a government may already be slipping in the polls.
Parties seemed to have their best years on Facebook before they governed, not while they did.
Leaving did not bring it back
If governing costs attention, you might expect it to return once a party goes back into opposition. In these data it did not, at least within the two years I can see. Compared with their opposition years before they governed, parties drew about 38% less per post in opposition after leaving government. Junior partners that left government had a particularly thin first year afterwards.
There is an important catch here. Parties usually go into government after a good run, and in my data their engagement had often been rising in the year before they entered. Some of what looks like a cost of governing may simply be the end of that rise. I cannot fully separate the two.
Fewer shares, less anger
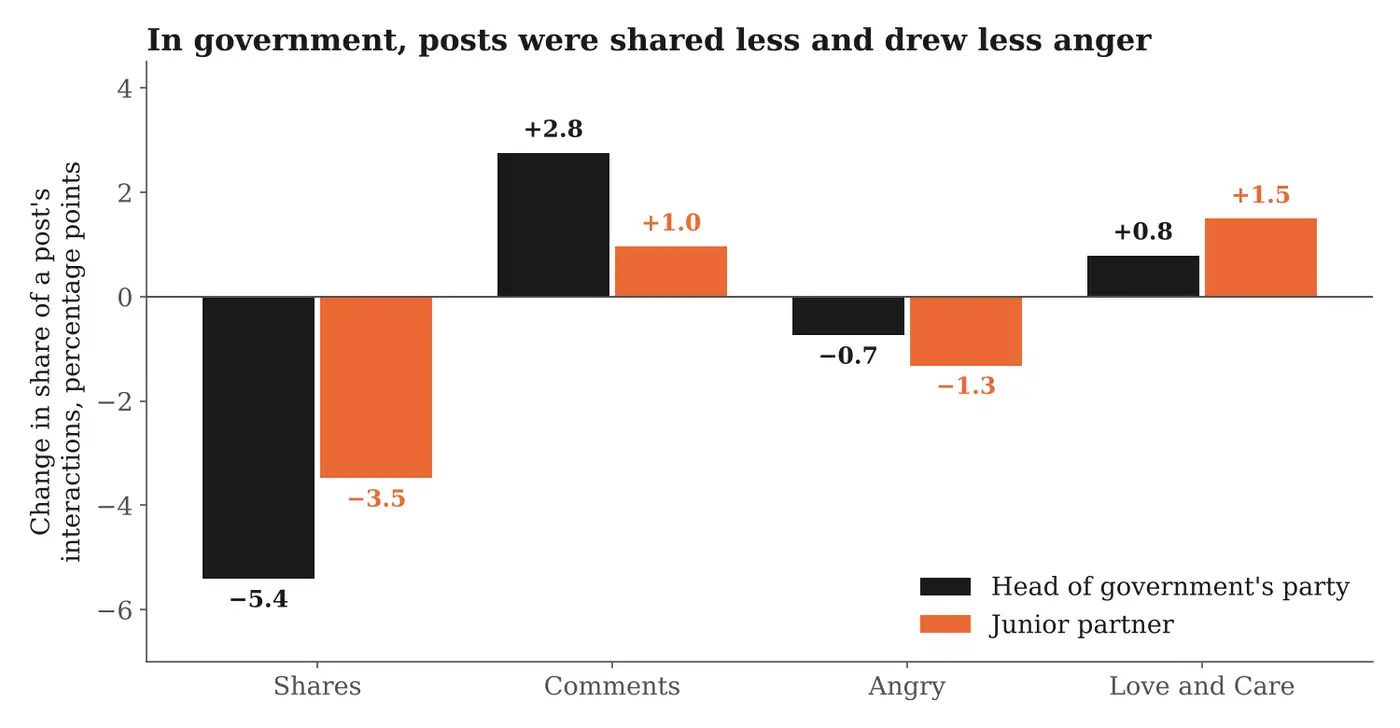
The kind of engagement changed too. In opposition, shares made up 17.5% of a party post’s interactions on average. In government, that fell by about 5 percentage points for prime ministers’ parties and 3.5 for junior partners. Governing parties also drew fewer angry reactions and slightly more love and care, while prime ministers’ parties drew more comments.
Shares matter because they carry a post beyond the people who already follow a page. One reading is that opposition posts, which may more often criticise the government, gave supporters something to pass on and something to be angry about. I cannot see the posts’ content in this analysis, so that is an interpretation, not a finding.
Populists were no different
Populist parties are often thought to struggle in office, because an anti-establishment message is harder to sustain from inside the establishment. I found no sign that office cost them more attention than other parties. But only 10 populist party pages went in or out of government in this period, so the uncertainty is large.
The caveats
This is a description of how parties’ engagement changed, not proof that governing caused it. Parties enter government after elections, often with new leaders and rising poll numbers, and leave after defeats, and I cannot pull all of that apart from office itself. When I allow each party its own long-run trend, the estimates get smaller and are no longer statistically clear. The pages come from my own CrowdTangle lists, not a full census, and some major governing parties are missing. The number of changes in government is modest, so the year-by-year patterns are noisy. And engagement is attention, not support: it includes critics and people abroad, and it says nothing about votes.
Still, the overall picture is consistent: on Facebook, as at the ballot box, office seems to wear parties down, and junior partners seem to feel it most in the attention they get overall.
I wrote the text, with drafting and editing assistance from Claude.
The views in this post and the paper are my own.

