
On 11 January 2018 Facebook announced it was rebuilding the News Feed around “meaningful social interactions”, and warned that pages might see their reach fall. Later leaks said European parties felt it pushed them towards negative content. But did the engagement they received actually change?
I looked at 418,477 posts from 176 party and leader pages in 20 European countries, comparing each page with itself before and after. The short answer is that the amount of engagement did not move. The kind of engagement did.
The preprint
Shared More, Liked Less? Facebook’s 2018 News Feed Change and the Pages of European Parties and Leaders
Open access, free to read, share and cite. It uses 105 party pages and 71 leader pages in 20 countries, March 2016 to December 2019.
Download the PDFRecord and DOI
Cite as: Hotham, T. (2026). Shared More, Liked Less? Facebook’s 2018 News Feed Change and the Pages of European Parties and Leaders. Preprint. https://doi.org/10.5281/zenodo.23403683
No fall in engagement
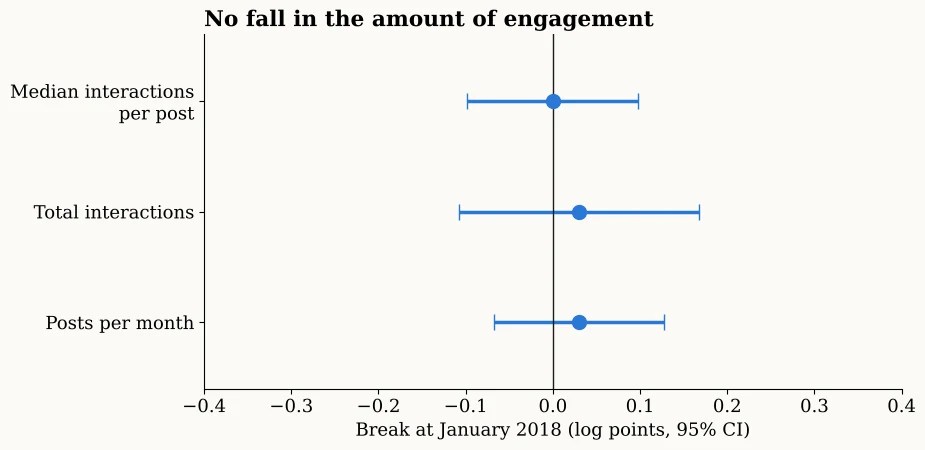
Facebook said pages would lose reach, so you would expect fewer reactions per post. I find nothing. The median post drew about the same in 2018 as in 2017, total engagement did not fall, and parties did not post less. The confidence intervals rule out a drop in the median post of more than about 10%.
(A model that fits one straight line across the whole period does show a fall of about a fifth. That is an artefact: engagement stayed flat for a year after the change and then rose steeply in 2019, so a straight line projected back to January 2018 looks like a drop.)
But people shared more
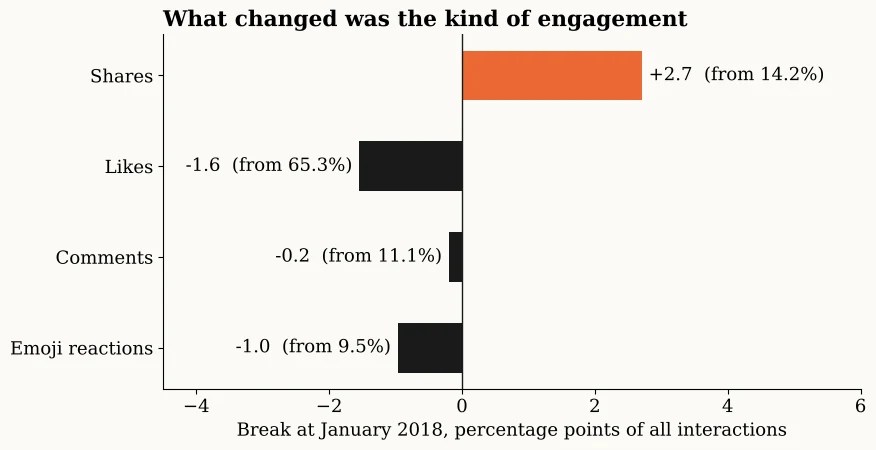
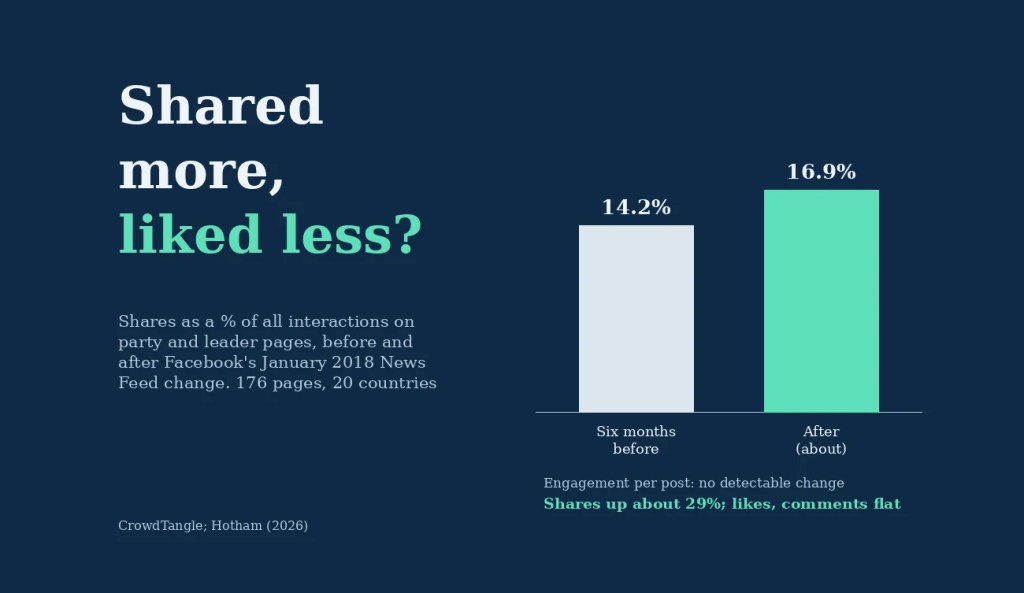
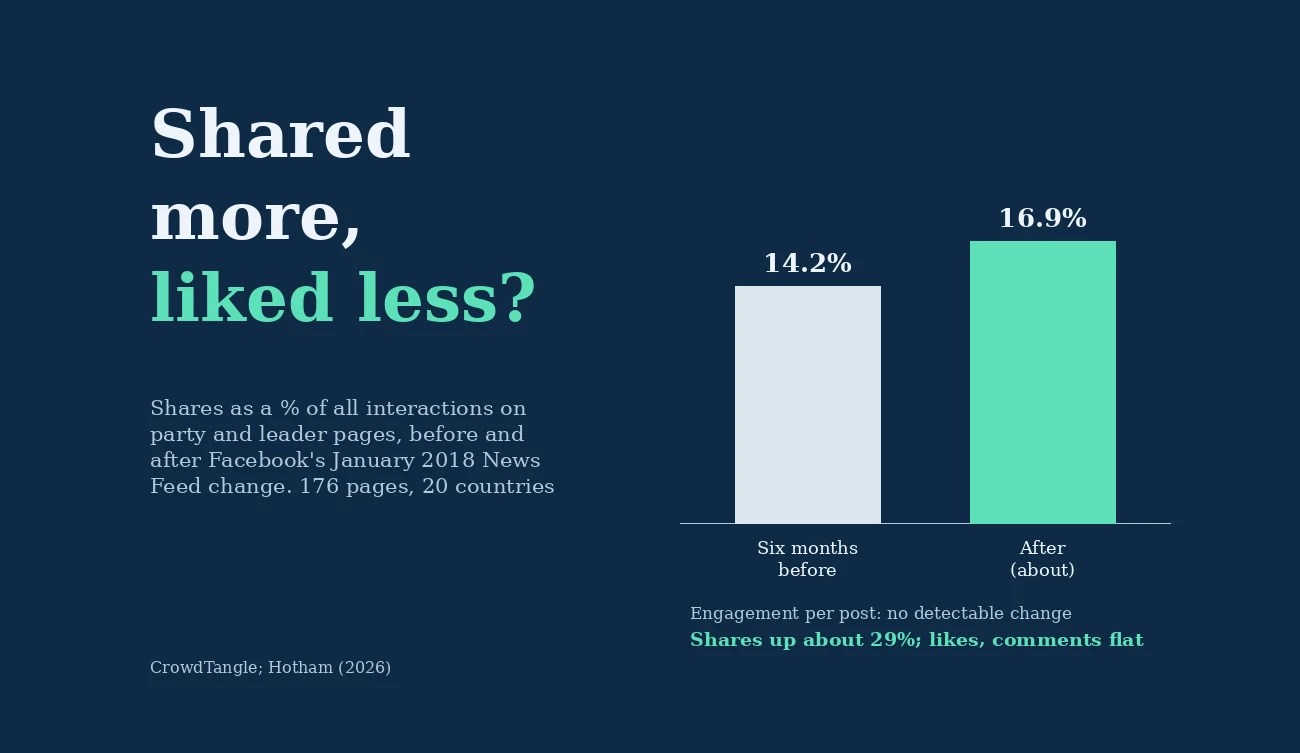
In the six months before, shares made up 14.2% of everything a page received, likes 65.3%, comments 11.1% and emoji 9.5%. At the change, shares jumped by 2.7 points. That was not likes being swapped for shares: the number of shares rose by about 29%, while the number of likes, comments and reactions stayed flat.
For about a year, audiences shared party posts more, and liked, commented and reacted no more than before.
That fits a ranking system that rewarded posts likely to be reshared. Shares matter for parties because they carry a post beyond the people who already follow the page.
Is it just the January slump?
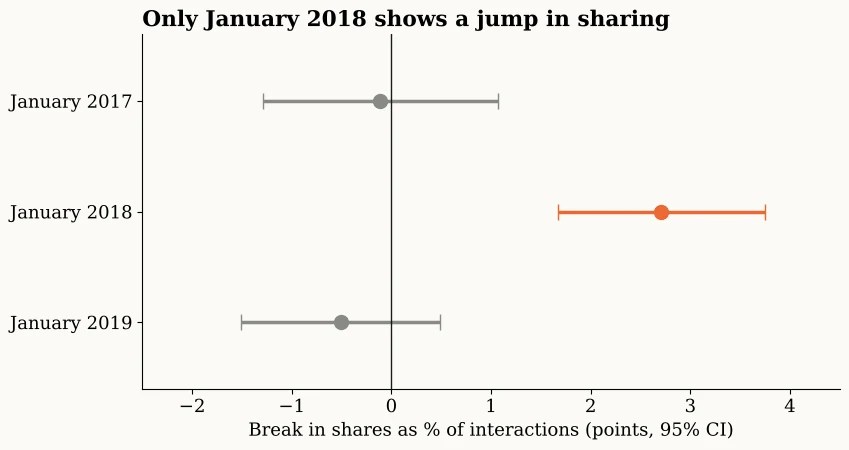
Engagement dips over Christmas and recovers, so I ran the same test at January 2017 and January 2019, and at every other month from September 2016 to June 2019. The January 2018 break in shares is the largest of 34 months, at about five standard errors. The breaks in the two other Januaries are about zero.
Who gained and who lost
The rise in sharing was positive in 17 of 19 countries, and clearly so in Germany, Spain, Finland, Norway and Sweden. It was 2.6 points bigger on populist parties’ pages, in line with the reporting that the change rewarded conflict, though I cannot see post content. It lasted about a year and was gone by mid-2019.
Larger pages lost engagement per post, about 21% relative to smaller ones. Within pages, video posts lost much of their edge (a 32% premium fell to about 14%) and link posts drew about 10% less than photos and text.
The caveats
Every page was hit at once, so there is no untreated group, only comparisons with the same pages earlier and with other months. Other changes, such as the December 2017 crackdown on engagement bait, cannot be separated out. CrowdTangle records engagement, not reach or content, so I cannot say whether parties became more negative or whether fewer people saw their posts. The pages are those on my lists, not a census. A natural next step is to link the engagement to what parties actually posted.
I wrote the text, with drafting and editing assistance from Claude.
The views in this post and the paper are my own.

