
Every campaign post on Facebook gets a public score within hours: likes, comments and shares. Parties watch those numbers, because they decide in part how many more people will see the post. So which kinds of post did best?
For my PhD I coded by hand every post I could retrieve from the Labour and Conservative Facebook pages, and the pages of their leaders, in the month before the 2015 and 2017 general elections. I recorded hundreds of features of each post, from who appeared in the picture to whether it made a pledge or cracked a joke. In a new paper I finally link that coding to the engagement each post received.
The preprint
What Earns Engagement? Hand-Coded Content and Facebook Interactions on British Party and Leader Pages, 2015 and 2017
Open access, free to read, share and cite. It uses my hand coding of 1,205 posts from the Labour and Conservative party and leader pages in the 2015 and 2017 general election campaigns.
Cite as: Hotham, T. (2026). What Earns Engagement? Hand-Coded Content and Facebook Interactions on British Party and Leader Pages, 2015 and 2017. Zenodo. https://doi.org/10.5281/zenodo.23398394
What I did
The data are 1,205 posts from eight pages: the Labour and Conservative party pages in both years, and the pages of David Cameron and Ed Miliband in 2015 and Theresa May and Jeremy Corbyn in 2017. Together they drew about 9.2 million interactions. An interaction is any like, comment, share or other reaction.
The key move is to compare posts with other posts on the same page. Corbyn’s page drew far more engagement than Miliband’s, but that says more about the audience than the content. Within a page, I also hold constant the format (photo, video, link or text), the length of the post, the week of the campaign, the day and time it went out, and the page’s number of followers on the day.
A detailed coding scheme offers many things to test, and some will look important by chance. So before running any models I picked nine features from the research literature and checked each one against an independent second coder who had recoded a sample of posts. I then corrected the results for the number of tests.
Negativity was the most reliable signal
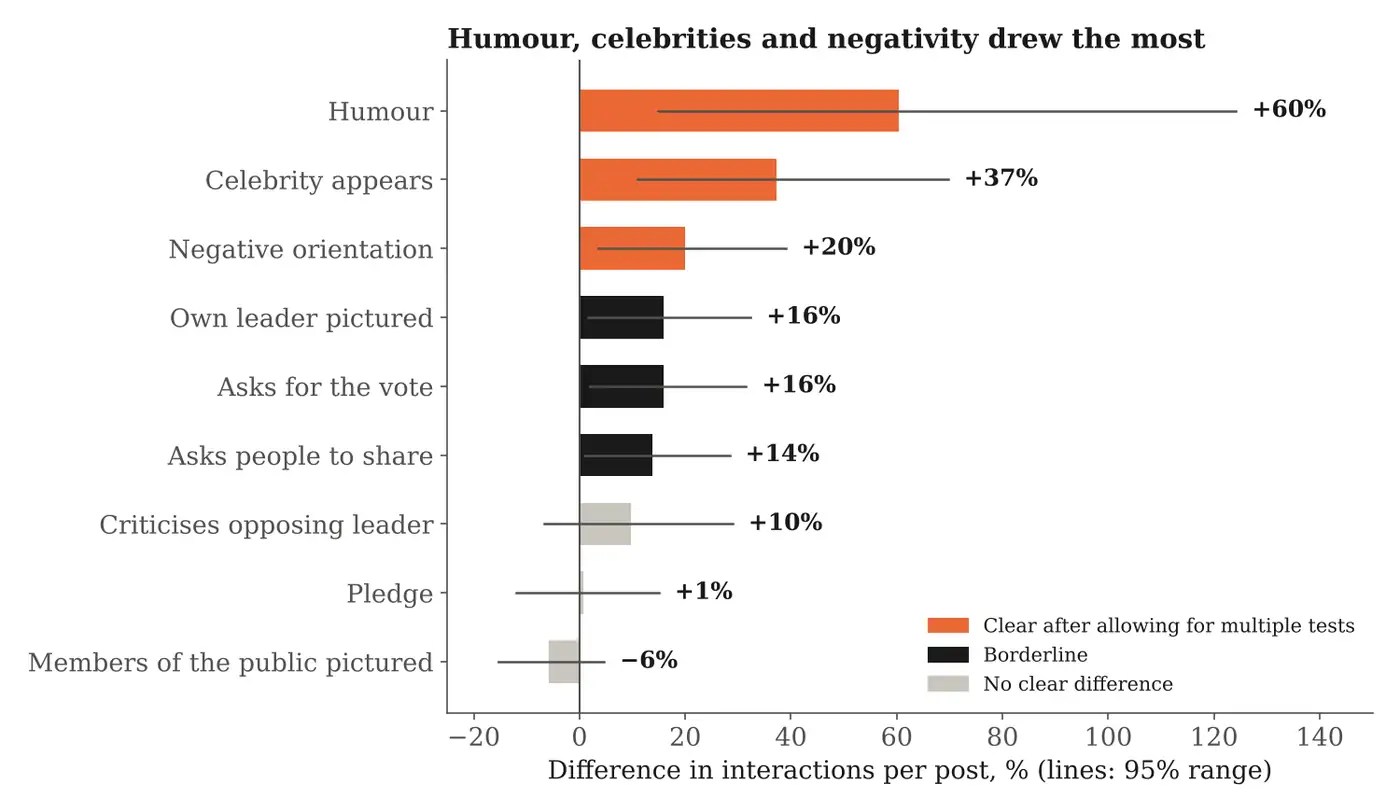
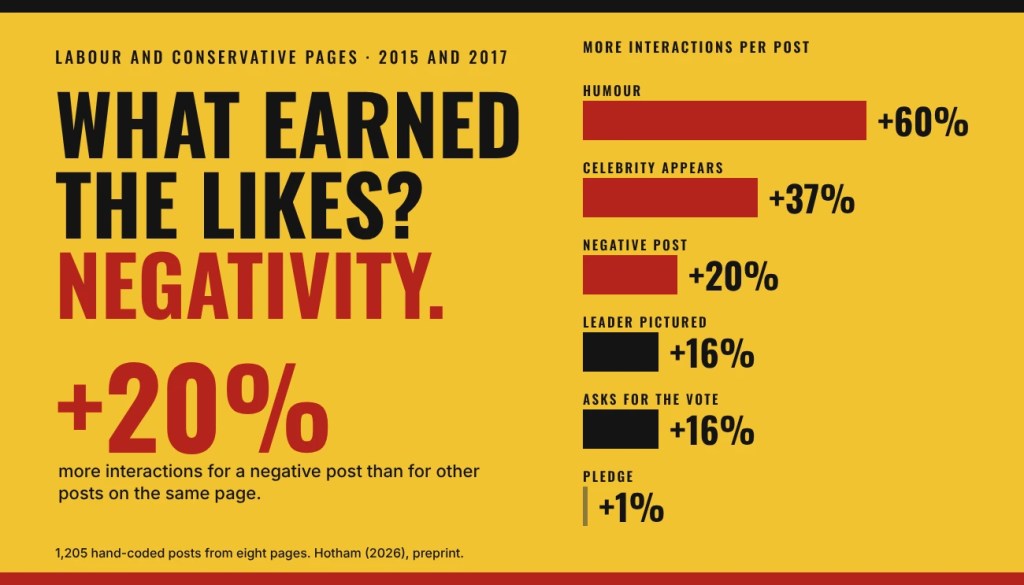
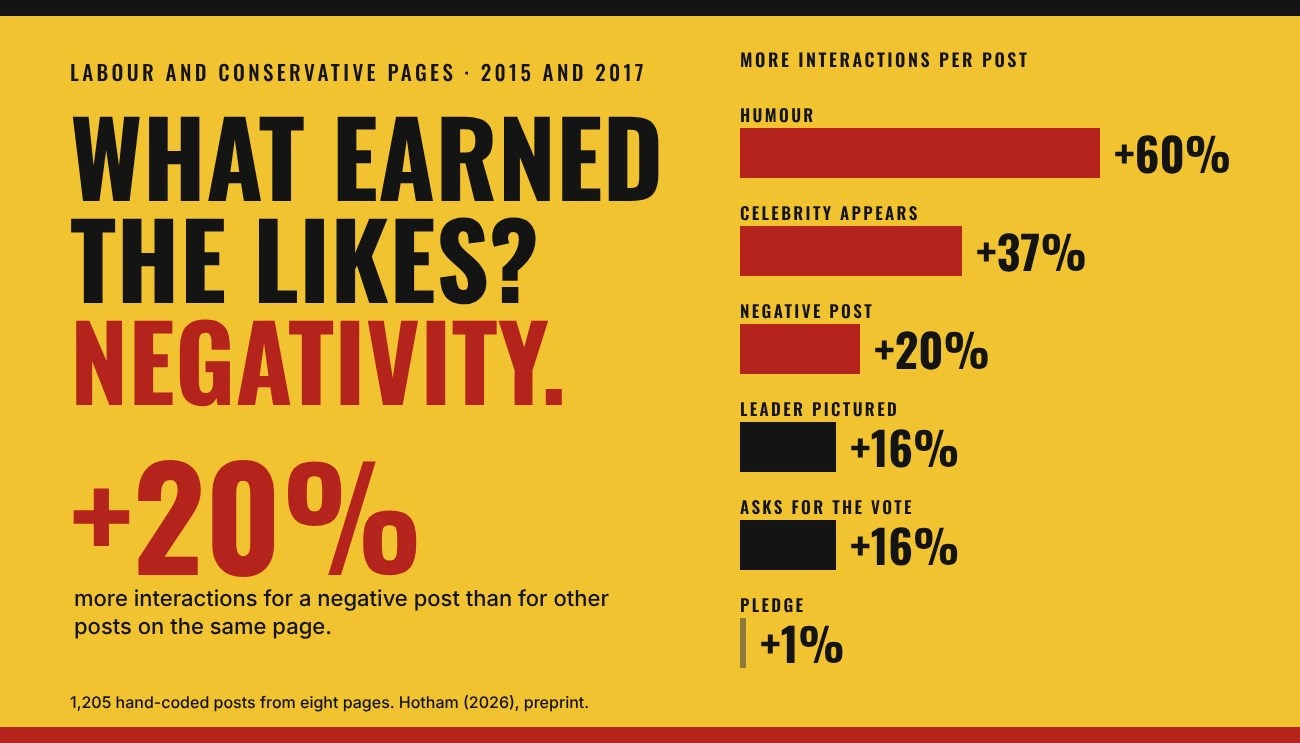
Posts with a negative orientation, meaning they criticised, attacked or expressed regret, drew about 20% more interactions than other posts on the same page. That is not huge: on each page the top tenth of posts took between a fifth and two fifths of all the engagement. But it is the most solid result in the paper. It showed up on seven of the eight pages and held in every check I ran.
Humour went with about 60% more interactions and celebrities with about 37% more. Posts that showed the page’s own leader, asked for the vote or asked people to share went with around 14% to 16% more, which is borderline once I allow for the number of tests.
Criticising the opposing leader drew about 29% more on its own, but most of that came from its being negative. Once negativity was taken into account, naming and criticising the other leader added little I could detect.
Pledges and pictures of ordinary people made no detectable difference to engagement.
Different content, different kinds of engagement
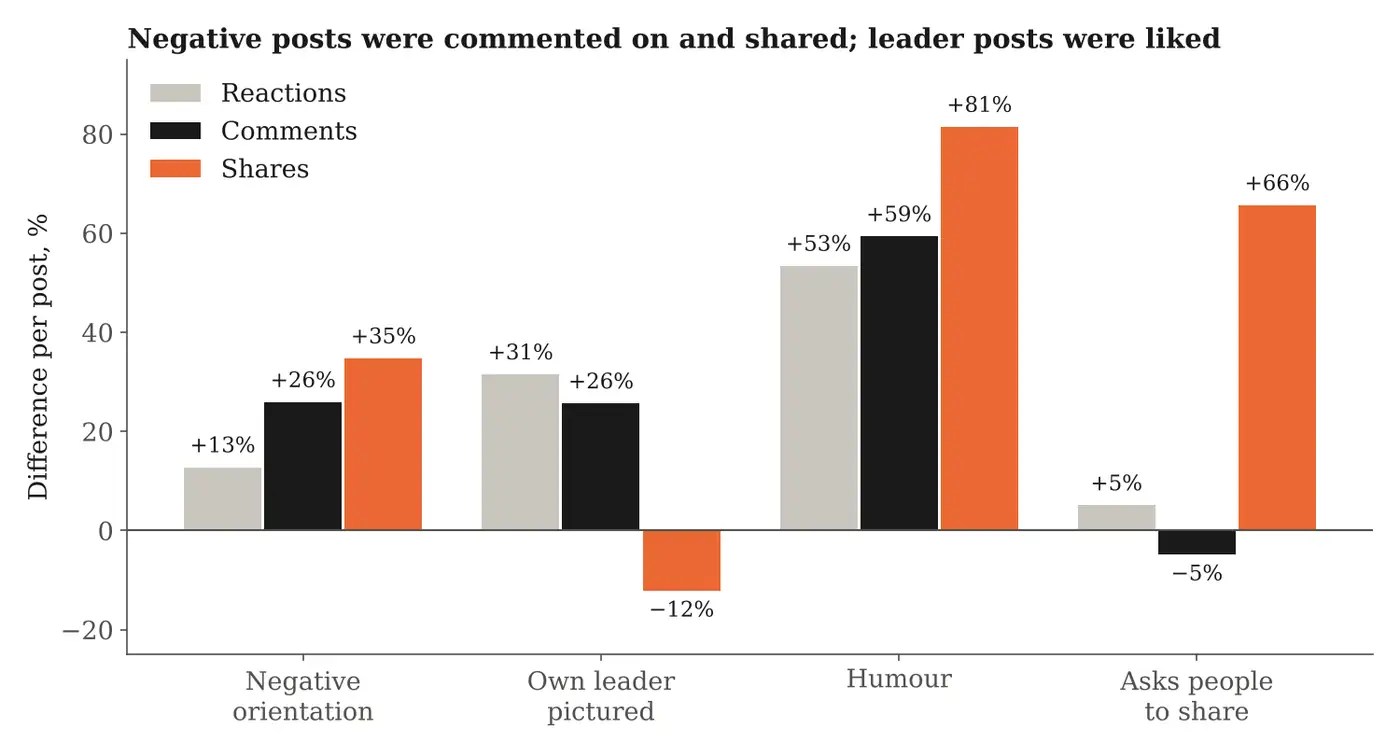
Negative posts mainly drew more comments (26% more) and shares (35% more). Posts showing the leader drew more reactions and comments but not more shares. Asking people to share did what it said: those posts were shared about 66% more, with no extra likes or comments.
Where the post appeared mattered too. Calls to vote went with about 33% more engagement on party pages and none on leader pages. Celebrities went with more engagement on party pages only, and they appeared almost entirely on the Labour side.
Anger and love in 2017
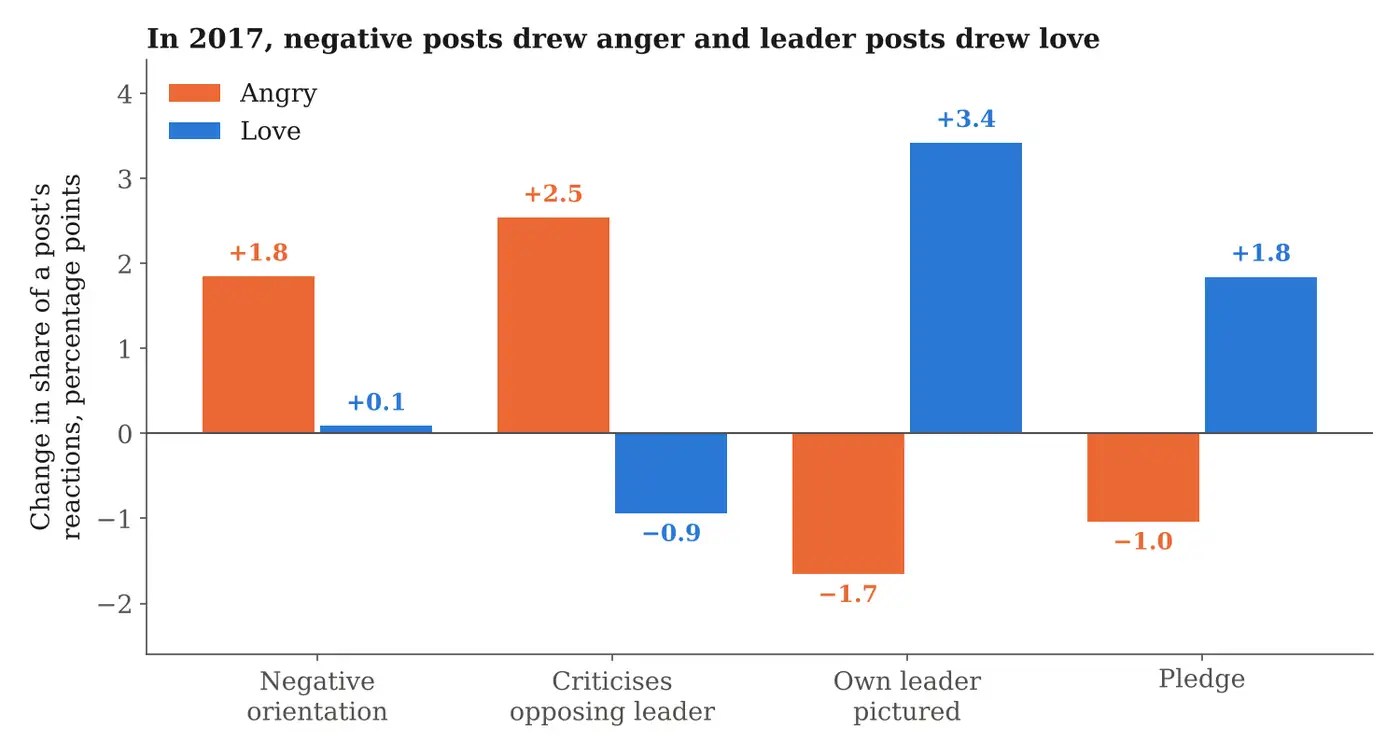
By 2017 Facebook let people react with love, anger and laughter as well as a like. On average 6.3% of reactions were love and 1.9% angry. Negative posts and posts criticising the opposing leader drew a larger share of angry reactions. Posts showing the leader, and pledges, drew a larger share of love. Humour, unsurprisingly, drew more laughter.
The caveats
This is association, not cause. A party may have attacked its opponents on days when there was more to attack, and those days may have drawn engagement anyway. Engagement is also not reach or persuasion: an angry comment from an opponent counts the same as a cheer from a supporter.
The sample has a gap. Facebook only let researchers collect a limited number of each page’s top posts, so for the 2015 and 2017 Labour pages and Corbyn’s page I have between 49% and 75% of the posts, mostly the more popular ones. On the five pages where the sample is close to complete, only negativity and calls to share went with clear increases. The results for humour, celebrities and leader pictures rest mainly on the Labour pages.
Finally, some codes were not reproduced well by the second coder, especially judgements about policy content. Policy detail, for instance, had low agreement, so I cannot tell whether it truly made no difference or whether my measure was too noisy to show one.
I wrote the text, with drafting and editing assistance from Claude.
The views in this post and the paper are my own.

