
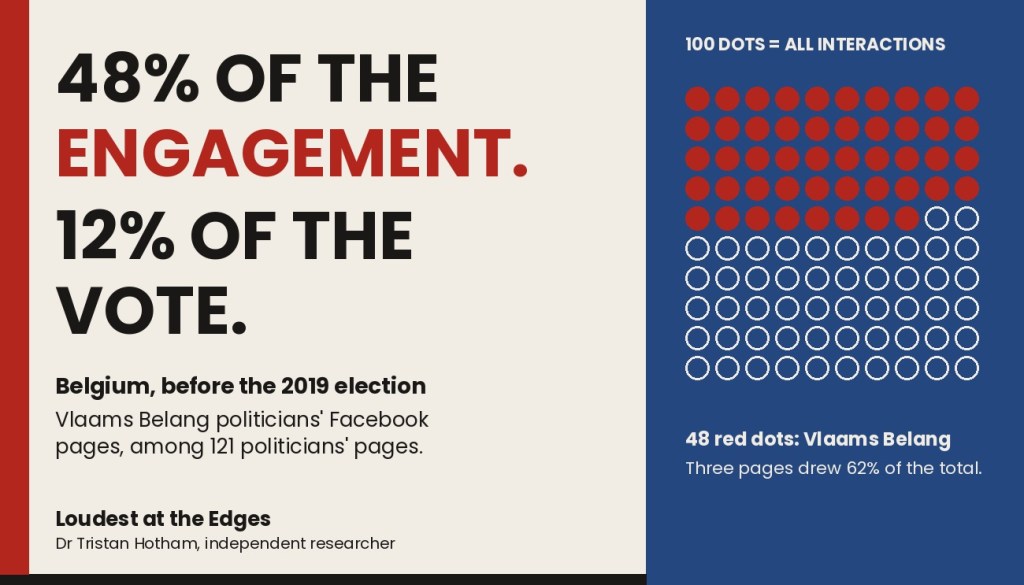
Before Belgium’s 2019 election, Vlaams Belang politicians’ Facebook pages drew 48% of all the interactions on 121 politicians’ pages. The party won 12% of the national vote. Three pages drew 62% of everything between them.
Facebook engagement was not spread across Belgium’s parties. It piled up at the edges, on a few pages, and mostly on the Dutch-speaking side of the language border.
I have written the data up as a preprint: “Loudest at the Edges: Belgian Politicians on Facebook and the 2019 Election.”
The preprint
Open access, free to read, share and cite. 8 pages with full methods and robustness checks.
Cite as: Hotham, T. (2026). Loudest at the Edges: Belgian Politicians on Facebook and the 2019 Election. Zenodo. https://doi.org/10.5281/zenodo.23396436
Why Belgium is an unusual case
The 2019 federal election was held on the same day as the regional and European elections. Vlaams Belang, which stands only in Flanders and Brussels, rose from 3.7% to 12% of the national vote for the Chamber, and the radical-left PVDA-PTB rose in both language communities. Belgium also has two largely separate party systems and media spaces, one Dutch-speaking and one French-speaking, competing in one national election. That matters for any engagement comparison.
What I did
The data come from my doctoral research and were collected through CrowdTangle. They cover 95,373 posts from the Facebook pages of 121 politicians, mostly members of the 2019 Chamber of Representatives and federal ministers, drawing 47.2 million interactions between 2014 and 2020. I compared each party’s politicians’ share of interactions in the 30 days before the election with the party’s share of the vote, within each language community, and then looked at how concentrated the engagement was and how it moved between parties over time.
What the data show
- Three pages drew most of it. Tom Van Grieken, the Vlaams Belang chair, drew 28% of all interactions in the month before the election, Theo Francken of N-VA 17.5% and Dries Van Langenhove, who sat with Vlaams Belang, 16.5%. Together that is 62%.
- The language gap was huge. Dutch-speaking politicians’ pages drew 1.67 million interactions in that month and French-speaking politicians’ pages 0.18 million, about nine times as many. So I compare parties within each community.
- The radical parties drew well above their vote. Among Dutch-speaking parties, Vlaams Belang drew 2.7 times its share of the vote and the PVDA 1.9 times. Among French-speaking parties, the PTB drew 2.9 times its share.
- Most others drew a fraction. N-VA (0.95), the PS (1.10) and the MR (0.83) drew about their share. The Christian Democrats (0.18), Liberals (0.22) and Greens (0.07) drew about a fifth of their share or less.
- Engagement moved from N-VA to Vlaams Belang. N-VA’s politicians drew the largest share from 2016 to 2018, reaching 63% in 2017, almost all through Francken, whose page drew 3.3 to 3.5 million interactions a year in 2017 and 2018. Vlaams Belang’s share rose from 1% in 2014 and 9% in 2017 to 38% in 2018, 47% in 2019 and 56% in the first nine months of 2020. Van Grieken’s page went from 0.03 million interactions in 2015 to 3.6 million in 2019.
Figure 1. Engagement against the vote, within each language community
Dutch-speaking parties
0.95 N-VA
2.74 Vlaams Belang
0.18 CD&V
0.22 Open Vld
0.46 sp.a
0.07 Groen
1.93 PVDA
French-speaking parties
1.10 PS
0.83 MR
0.02 Ecolo
2.92 PTB
0.49 cdH
0.24 DéFI
Well above vote share About vote share Well below vote share
Figure 2. Who drew the engagement
28.0% Tom Van Grieken (Vlaams Belang)
17.5% Theo Francken (N-VA)
16.5% Dries Van Langenhove (Vlaams Belang)
9.7% Peter Mertens (PVDA-PTB)
4.0% Raoul Hedebouw (PVDA-PTB)
3.9% John Crombez (sp.a)
1.5% Wouter Vermeersch (Vlaams Belang)
1.3% Ahmed Laaouej (PS)
Vlaams Belang N-VA Other parties
What did not change the picture
The results are not an artefact of my choice of window or page set. Vlaams Belang’s ratio in the national comparison is between 3.5 and 4.0 under every check, using windows of 14 and 60 days and keeping only each party’s top page or top three pages. The PVDA-PTB’s is between 1.5 and 1.7. The same four parties, Vlaams Belang, the PVDA-PTB, N-VA and sp.a, have the highest ratios in every version.
The limits
The list is of politicians, mostly 2019 members of the Chamber and ministers, not of parties. It leaves out several party leaders who were not members, including Bart De Wever and Paul Magnette, and all party pages, so the results describe the politicians in the list, not whole parties. Because the list was built around 2019 membership, the trends before 2019 partly reflect who was in the list. The number of pages per party varies relative to its seats, and the top-page checks reduce but do not remove that. Van Langenhove sat with Vlaams Belang but was not a party member. CrowdTangle’s historical coverage is not guaranteed to be complete. Interactions are not support: they include engagement from opponents, from outside Belgium and possibly from paid promotion. This is descriptive and observational, and one election is too few to generalise.
Why it matters
These data show where engagement was concentrated. They do not show who would win.
The parties other than Vlaams Belang, N-VA and the PVDA-PTB mostly drew a fraction of their vote on Facebook, and still won most of the seats. The shift from N-VA to Vlaams Belang over 2018 and 2019 coincides with N-VA’s loss of votes and Vlaams Belang’s gain, but the data cannot say whether engagement led, followed or simply accompanied that movement.
This is one of a series from the same data. I wrote the text, with drafting and editing assistance from Claude. The aggregated data, with no post text, are available from me on request.
The views in this post and the paper are my own.

