
When lockdowns began across Europe in 2020, governing parties and heads of government drew more attention on Facebook. So did the opposition. The rally was real, but it was modest and short.
Surveys in the spring of 2020 found that trust in governments rose across Europe. I wanted to know whether attention on Facebook moved the same way, towards the governing side and away from the opposition. The short answer is that the governing side did gain, by about a third to a half relative to the opposition in the first eight weeks of lockdown. But the opposition did not fade away, and the gain was gone by the summer.
I have written this up as a preprint: “A Smaller Rally: Governing and Opposition Pages on Facebook in Europe’s First Covid-19 Wave.”
The preprint
Open access, free to read, share and cite. It uses 81,372 posts from 147 party and leader pages in 15 European countries.
Cite as: Hotham, T. (2026). A Smaller Rally: Governing and Opposition Pages on Facebook in Europe’s First Covid-19 Wave. Zenodo. https://doi.org/10.5281/zenodo.23396940
Why I looked at Facebook
Surveys tell us what people say they think of their government. They say less about where people turned their attention. In earlier work on Britain I found that official government pages drew about 5% of the engagement on British government, party and politicians’ pages before the pandemic and 29% in the first wave. This paper asks whether the same thing happened across Europe, using the official pages of national parties and the personal pages of party leaders.
The data come from my doctoral research and were collected through CrowdTangle. They do not include government department pages, so the question here is narrower than in the British paper.
What I did
I lined up each country on a common timeline around the week its lockdown began, defined as the first day its Oxford COVID-19 Government Response Tracker stringency index reached 70. Then I compared governing and opposition pages in the same country and the same week, so that anything affecting all of a country’s pages at once, such as a surge in Facebook use, drops out. I also ran the same comparison on the same weeks of 2019 as a placebo. The main sample has 40 governing pages and 107 opposition pages, which posted 81,372 times and drew 177 million interactions.
What happened
- Both sides got busier. In the first eight weeks of lockdown, interactions with governing pages roughly doubled, and interactions with opposition pages rose by about 60%.
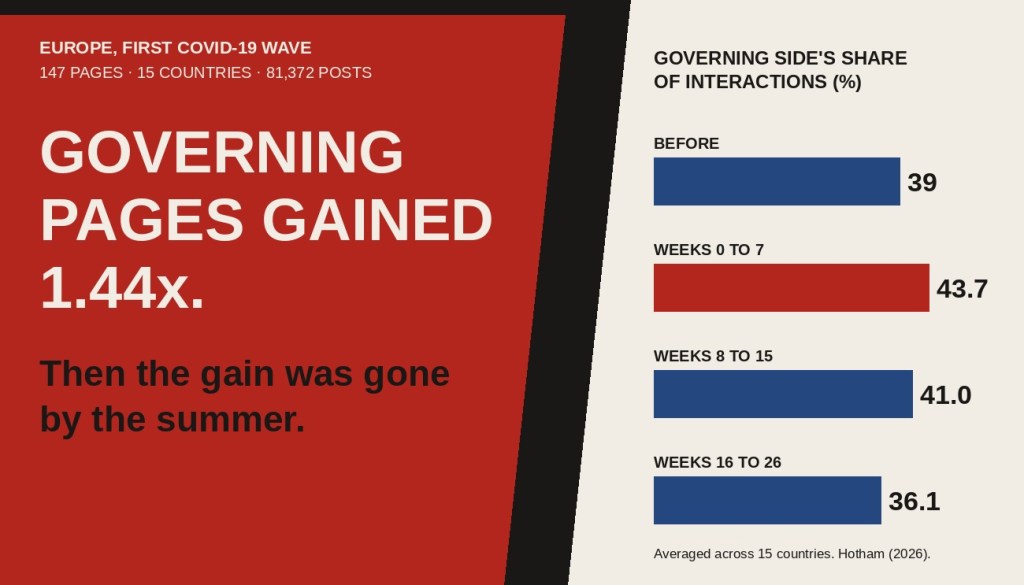
- Governing pages gained more. Relative to the opposition, governing pages gained by a factor of 1.34 with each page weighted equally (95% CI 0.86 to 2.08) and 1.44 when weighted by interactions (1.05 to 1.96). Governing pages gained more than the opposition in 11 of the 15 countries. In Finland, France, Lithuania and Romania the opposition gained more.
- The gain began early. It showed up in the two weeks before lockdown, when the virus already dominated the news.
- It was a rally to a person, not to parties. The interaction-weighted gain for heads of government’s own pages was 1.87 (1.49 to 2.35). Party pages gained less: 1.06 weighted equally and 1.29 weighted by interactions.
- It faded fast. Weighted by interactions, the governing side’s relative interactions fell by about 2.8% a week, so half the gain had gone in about 8 weeks and all of it in about 16. The governing side’s share of interactions went from about 39% to a peak of 49% in the second week of lockdown and ended at 36.1% in the summer weeks, slightly below where it began.
Figure 1. Almost every country got busier, and most governing sides got busier still
Governing pages Opposition pages
Belgium
2.11
1.58
Denmark
4.00
1.58
Finland
0.78
1.44
France
1.48
1.84
Germany
1.17
1.10
Greece
2.73
1.49
Hungary
3.97
2.05
Ireland
5.60
0.59
Lithuania
1.46
2.46
Luxembourg
2.60
1.31
Norway
1.23
0.72
Portugal
3.22
1.38
Romania
0.93
1.69
Spain
1.56
1.49
United Kingdom
3.71
2.08
Did stricter lockdowns or more deaths mean bigger rallies?
Within countries, week by week, the governing side’s relative position tracked the recent death toll more closely than lockdown stringency. That fits a rally driven by the threat of the virus more than by the government’s own action, though deaths and stringency rose and fell together, so I cannot cleanly separate them. Between countries, neither measure predicted how big the rally was. Greece and Portugal, with strict lockdowns and few deaths, saw rallies about as large as countries with many deaths such as the United Kingdom and Sweden, while Belgium and Spain, with two of the three highest death rates in the sample, saw small ones. With 16 countries this is a descriptive check, not strong evidence either way.
Laughter and anger went quiet, on both sides
In Britain, the striking change was that laughing and angry reactions almost vanished from the government’s own pages. Across Europe, haha reactions made up 3.1% of likes and reactions on heads of government’s pages before lockdown and 0.9% in the first eight weeks, and angry fell from 2.7% to 1.1%. Love and care rose from 8.8% to 11.9%. But laughter fell on opposition leaders’ pages too, from 2.4% to 1.3%. So part of this was a change in the tone of political Facebook in general, not only in how people treated those in power. What set heads of government apart was that anger stayed low while anger on opposition leaders’ pages rose over the summer, but these differences are imprecise.
Figure 2. Share of likes and reactions, before and in the first eight weeks of lockdown
Before lockdown Weeks 0 to 7, heads of government Weeks 0 to 7, opposition leaders
Haha, heads of government
3.1%
0.9%
Haha, opposition leaders
2.4%
1.3%
Angry, heads of government
2.7%
1.1%
Angry, opposition leaders
4.1%
4.2%
Love and care, heads of government
8.8%
11.9%
Love and care, opposition leaders
6.6%
7.5%
What did not hold up
The placebo is the most important check, and it is humbling. In the same weeks of 2019, a spring full of elections, governing pages also gained relative to the opposition when weighted by interactions: 1.34 (0.83 to 2.14), almost as large as the 2020 estimate of 1.44. Comparing the 2020 change with the 2019 change for the same pages gives 1.15 and 1.06, with wide intervals. So I cannot claim that the European rally, measured over all governing and opposition pages, was larger than the ordinary movement of these pages in a spring of national and European elections. The estimates with pages weighted equally are also not distinguishable from no change. Populist opposition pages did not differ clearly from other opposition pages.
The limits
The pages are a curated list, not a census. Some countries have many pages, Germany has four party pages and no leader pages, and many heads of government have no personal page in the data, so the comparison is between the governing and opposition pages each country’s list contains. The sample is small, with 15 countries, 40 governing pages and only a handful of heads of government, so estimates are imprecise and depend on how pages are weighted. The design is descriptive: lockdowns were not assigned at random and fell within two weeks of each other, so their timing cannot be separated from the arrival of the virus or from news coverage of it. Interactions measure attention, not support, because people engage with posts they dislike. The data come from CrowdTangle and end in 2020, and they cover one platform only.
Why it matters
The rally on European political Facebook was real but modest, short and hard to separate from the noise of ordinary political weeks.
If you read a surge of attention to a leader’s page as a surge of support, check what the rest of the political landscape was doing at the same moment. Here, attention to politics rose on both sides, and the governing side’s share rose only modestly. The paper extends my doctoral research on how political parties use Facebook and my earlier study of Britain’s first wave. The data were collected through CrowdTangle during that research, and aggregated data are available from me on request.
I wrote the text, with drafting and editing assistance from Claude.
The views in this post and the paper are my own.

