
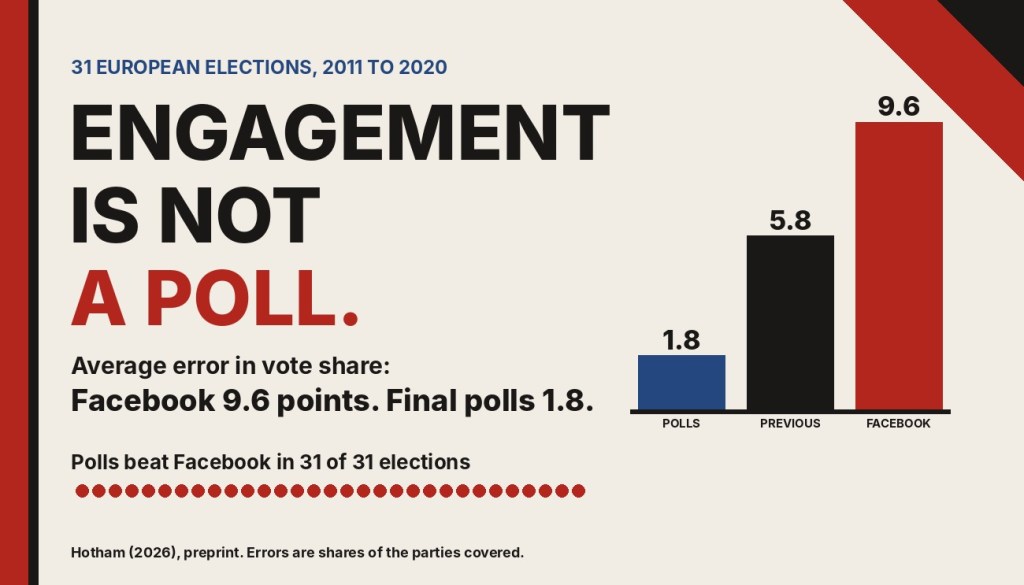
Facebook engagement was a worse guide to the vote than the final polls in every one of 31 European elections. On average it missed by 9.6 points. The polls missed by 1.8.
Every campaign produces social media numbers, and they are often read as a sign of who is winning: whose posts are shared most, whose page gets the most reactions. I wanted to know whether that reading holds up.
I have written the answer up as a preprint: “Engagement Is Not a Poll: Facebook and 31 European Elections, 2011 to 2020.”
The preprint
Open access, free to read, share and cite. 9 pages with full methods and robustness checks. Preprint, not peer reviewed.
Cite as: Hotham, T. (2026). Engagement Is Not a Poll: Facebook and 31 European Elections, 2011 to 2020. Zenodo. https://doi.org/10.5281/zenodo.23396654
Why test this again
Claims that social media activity predicts votes go back to early Twitter studies, which said that mentions of parties or candidates tracked their vote. Those results turned out to be fragile and did not hold up across later studies. Facebook pages give a cleaner test. Parties run official pages, interactions are counted the same way everywhere, and the numbers can be set directly against polls and results. In my earlier case studies I had found mixed answers, so here I pool the evidence.
What I did
I took the official Facebook pages of parties in 31 national elections in 15 European countries between 2011 and 2020, 172 party-elections in all. The data come from my doctoral research and were collected through CrowdTangle. For each party I worked out its share of all interactions (reactions, comments and shares) on the covered parties’ pages in the 30 days before the vote. I then compared that with three things: the party’s actual vote, the average of the final polls, and simply repeating the previous election’s result. All four are shares of the parties covered, so they sum to 100 in each election.
As a forecast, engagement was poor
- The average miss was large. Engagement was out by 9.6 points, against 1.8 for the final polls and 5.8 for repeating the previous result.
- Polls won every time. Engagement did worse than the polls in all 31 elections, and worse than the previous result in 24 of them.
- It rarely picked the winner. The polls named the largest party correctly in 28 elections, the previous result in 20 and engagement in 13.
- It got the order wrong more often. The average rank correlation with the result within elections was 0.93 for the polls, 0.77 for the previous result and 0.55 for engagement.
- The ranking survives other ways of counting. In points of the national vote the errors are 1.3 for the polls, 7.4 for engagement and 4.4 for the previous result. In the 19 elections where the covered parties won at least 70% of the vote they are 1.2, 8.9 and 4.8.
Figure 1. How far each measure was from the vote
1.8 Final polls
5.8 Repeating the previous election
9.6 Facebook share of engagement
The errors were not random
Populist parties’ Facebook share was about ten points higher, relative to their vote, than that of other parties of similar size, and larger parties were understated. This is the engagement premium of populist parties I found in earlier work, and it means raw engagement systematically overstates them. Some elections were far worse than others, as Figure 2 shows.
Figure 2. Where engagement was furthest from the vote
Romania 2016
Polls 4.6, Facebook 36.2
Germany 2013
Polls 1.3, Facebook 26.1
Slovakia 2016
Polls 10.7, Facebook 21.3
Slovenia 2014
Polls 2.1, Facebook 18.5
Portugal 2019
Polls 0.4, Facebook 17.6
Slovakia 2012
Polls 1.4, Facebook 17.3
Final polls Facebook share
Did engagement add anything to the polls?
A little on its own, nothing once the polls are known.
- It carried some information. A party’s Facebook gap relative to its previous result explained about a third of the variance in the change in its vote (R² of 0.36).
- The polls already had it. Holding the polls constant, the Facebook gap added little: the coefficient was 0.07 and not significant. A party whose Facebook share ran ten points ahead of its poll share beat its poll by less than one point on average.
- Adding it to a regression barely moved the fit. The polls carried almost all the weight (0.93 against 0.06), and explained variance rose only from 0.958 to 0.961.
- Adjusting the polls made things worse. In a test that left each election out of the estimation in turn, the adjusted forecasts had a mean absolute error of 2.17 points against 2.00 for the polls alone, and improved on the polls in only 14 of 31 elections.
When the polls were wrong
This is the one place engagement looks interesting. Among the 12 largest poll errors, engagement pointed in the direction of the error in 10. They include Slovakia in 2016, Lithuania in 2016 and Slovakia in 2020. But the 12 come from only six elections, and I selected them after the event. Among the 37 populist party-elections, a gap between engagement and polls went with poll error (a coefficient of 0.16), but that depends on one election: without Slovakia in 2016, where only four parties are covered, it falls to 0.04 and is no longer significant. I read this as a pattern worth testing on new elections, not as a forecasting rule.
The limits
The parties are those with pages in my CrowdTangle lists, which cover some countries much better than others. Germany has only three parties in the data, for example, and shares of the covered parties exaggerate differences where few parties are covered. I check this with raw points of the national vote and with high-coverage elections, and the ranking does not change. Interactions include engagement from opponents and from outside the country, and CrowdTangle’s historical coverage is not guaranteed to be complete. I look at party pages only, not advertising, groups or private sharing.
There is one more caveat I want to be plain about. The poll averages, drawn from about 475 polls, were compiled by AI agents from public lists of published polls, mostly on Wikipedia. I checked one election, Sweden in 2018, against the source table and the averages matched exactly. The others have not yet been checked by hand. I also kept ten rows where poll and vote definitions differ, and the results hold when I drop them.
Why it matters
Engagement is a measure of attention. It should not be read as a poll.
Attention is related to political momentum, which is why engagement moves with the polls, but it is a different quantity. It includes people reacting, commenting and sharing repeatedly, some of them opponents and some of them outside the country. Treating it as a forecast would have overstated the populist parties and got the largest party wrong far more often than the polls did.
The party-election data, including the poll averages and their sources, are available from me on request. I do not publish post-level data or quote posts. The data came from my doctoral research, and I wrote the text, with drafting and editing assistance from Claude.
The views in this post and the paper are my own.

