
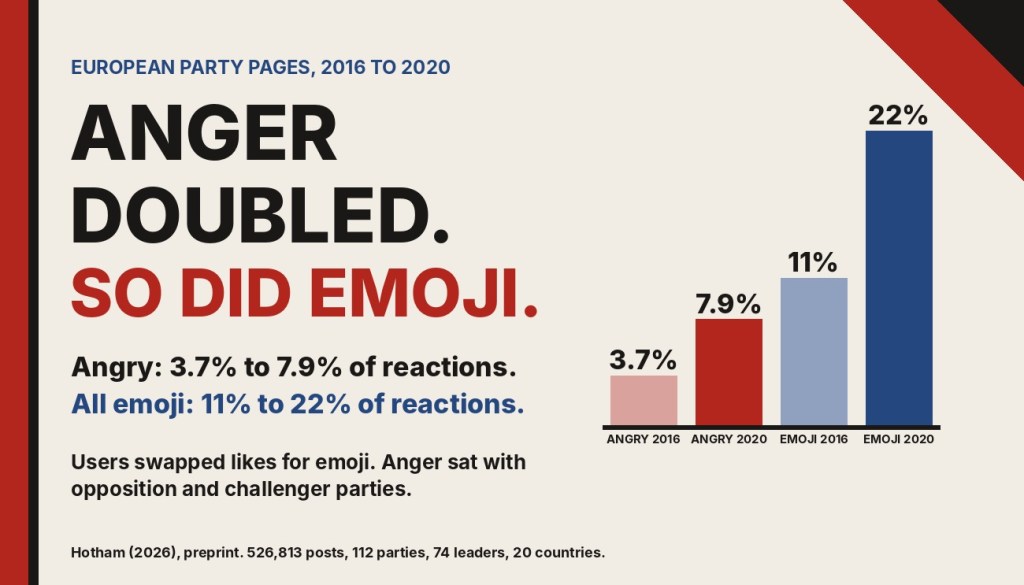
Angry reactions on European party pages roughly doubled between 2016 and 2020, from 3.7% to 7.9% of all reactions. But so did every other emoji: 11% to 22%.
Facebook added emoji reactions in 2016, and later reporting based on internal documents said the platform weighted them, Angry included, more heavily than likes when ranking posts. If anger was rewarded, you might expect political pages to have become angrier places. I wanted to check, using the pages of parties and their leaders.
I have written it up as a preprint: “Angrier, or Just More Expressive? Facebook Reactions to European Parties and Leaders, 2016 to 2020.”
The preprint
Open access, free to read, share and cite. 8 pages with full methods and robustness checks. Preprint, not peer reviewed.
Cite as: Hotham, T. (2026). Angrier, or Just More Expressive? Facebook Reactions to European Parties and Leaders, 2016 to 2020. Zenodo. https://doi.org/10.5281/zenodo.23396858
What I did
I used 526,813 posts from the pages of 112 parties and 74 party leaders in 20 European countries, from 2016 to 2020. The data come from my doctoral research and were collected through CrowdTangle. I measured anger two ways: Angry reactions as a share of all reactions, and as a share of emoji reactions, meaning everything other than likes. The second measure strips out the general shift from likes to emoji. To compare parties I looked at pages in the same country and month, so that the same national politics and the same stretch of time were held constant.
Anger rose, but so did everything else
- The headline number doubled. Angry reactions went from 3.7% of all reactions in 2016 to 5.3% in 2017, 7.2% in 2018, 5.9% in 2019 and 7.9% in 2020.
- Emoji of every kind rose too. Emoji made up 11% of reactions in 2016 and 22% in 2020, as users replaced likes. Love and Care rose most in points, from 4.5% of all reactions to 9.1%.
- As a share of emoji, anger rose only modestly. Pooled across pages it was 32% in 2016, 37% in 2018, 30% in 2019 and 36% in 2020. Within pages it fell by 0.19 points a month, about ten points over the period.
- Why the two views differ. The pages that drew the most anger grew fastest. Populist radical-right pages drew 16% of all emoji reactions in 2016 and 35% in 2020. Weighting pages by their emoji volume, the within-page trend is flat.
Figure 1. Anger and emoji, 2016 against 2020
Angry, as % of all reactions
2016: 3.7%. 2020: 7.9%.
All emoji, as % of all reactions
2016: 11%. 2020: 22%.
Angry, as % of emoji reactions (pooled)
2016: 32%. 2020: 36%.
2016 2020
Where the anger was
The clearer variation was by political position, not by year. Pooled, anger made up 10.2% of reactions on populist radical-right pages and 9.1% on populist radical-left pages, against 4.1% on mainstream pages. Within the same country and month, populist radical-right pages drew 3.1 points more anger as a share of all reactions than mainstream pages, and 10.5 points more as a share of emoji. Other populist parties drew 1.5 points more.
I would not lean too hard on the radical-right gap. Clustering the standard errors by country, or using party pages only, gives a similar estimate (3.1 and 2.9 points) that is no longer significant at the 5% level. The pattern is best described as anger on challenger parties of left and right, most strongly on the radical right.
Figure 2. Angry reactions by party family and by position
10.2% Populist radical right
9.1% Populist radical left
6.8% Non-populist far left
5.5% Other populist
4.1% Mainstream
By position
7.6% Opposition pages
2.6% Government pages
Government quiets the page
Government status was the most robust difference. Pages of parties in government drew 2.2 points less anger as a share of all reactions than opposition pages in the same country and month, and 11.3 points less as a share of emoji. The difference holds when clustering by country. It also held within parties: when a party changed status, being in government went with about one point less anger. That estimate comes mainly from the 37 pages whose party entered government (0.7 points less anger). For the 12 whose party left government there was no clear change.
What did anger go with?
- Elections. In the 30 days before a national election, the anger share was 1.9 points lower than at other times on the same page. Campaigns may bring out more supportive reactions, or bring in audiences that react less angrily. The data cannot separate the two.
- Sharing. Holding total reactions, page and month constant, ten points more anger as a share of a post’s reactions went with about 17% more shares and 19% more comments.
- Not so for love or laughter. Ten points more Love and Care, or more Haha, went with no more shares, though with more comments. Wow, a rare reaction, went with more shares still (+36%).
Among the common emotions, anger was the one most closely associated with sharing, the form of engagement that carries a post beyond its own audience. That is an association within pages, not a causal effect. The content that makes people angry may also be the content they want to share.
The limits
The pages are those in my CrowdTangle lists, which cover some countries and parties better than others. Germany has only four pages, for example. Comparing within country-months and within pages limits that problem but does not remove it. Reaction counts are those at the time of export in 2020, not at the time of posting. Reactions record what audiences clicked, not how they felt, and they include reactions from opponents, from outside the country and possibly from coordinated or paid activity. An Angry reaction may be anger at the party or anger with the party at someone else, and the data cannot tell these apart. Facebook’s ranking and the way reactions were displayed changed during the period, so changes over time mix audience behaviour with platform design. I do not analyse the content of posts, and the results on spread are associations.
Why it matters
European party pages did not become steadily angrier. Anger stayed with those out of power and on the radical right, and it went with wider sharing.
If you track anger as a share of all reactions over these years, you will see a rise that is mostly a rise in emoji use. Studies of this period should allow for that shift. And if Facebook’s ranking did reward anger, as reported, the parties that drew the most of it would have gained an edge in reach. That may be part of why populist pages draw so much engagement, which I look at in a companion paper.
Aggregated data (reactions by page and month) are available from me on request. I do not publish post-level data or quote posts. The data came from my doctoral research, and I wrote the text, with drafting and editing assistance from Claude.
The views in this post and the paper are my own.

